Review
. 2021 Feb 17;14(1):19.
doi: 10.1186/s12284-021-00457-0.

A Semi-Dominant Mutation in OsCESA9 Improves Salt Tolerance and Favors Field Straw Decay Traits by Altering Cell Wall Properties in Rice

Affiliations
Review

A Semi-Dominant Mutation in OsCESA9 Improves Salt Tolerance and Favors Field Straw Decay Traits by Altering Cell Wall Properties in Rice

Yafeng Ye et al. Rice (N Y). .

Abstract

Background: Cellulose synthase (CESA) mutants have potential use in straw processing due to their lower cellulose content, but almost all of the mutants exhibit defective phenotypes in plant growth and development. Balancing normal plant growth with reduced cellulose content remains a challenge, as cellulose content and normal plant growth are typically negatively correlated with one another.

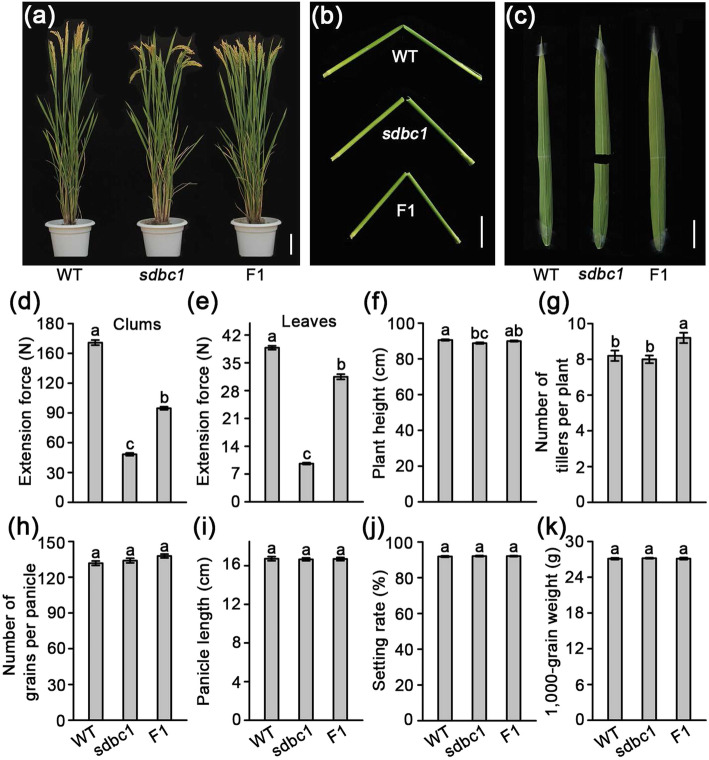
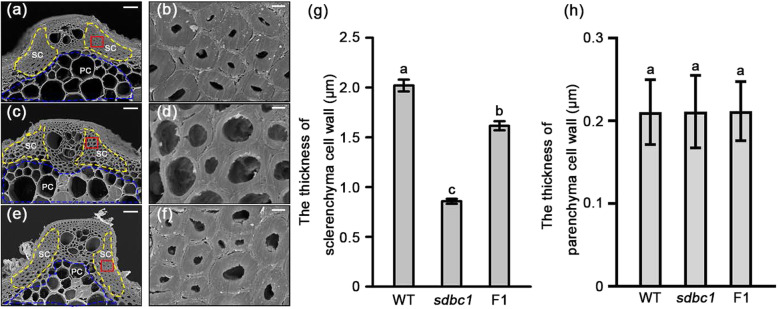
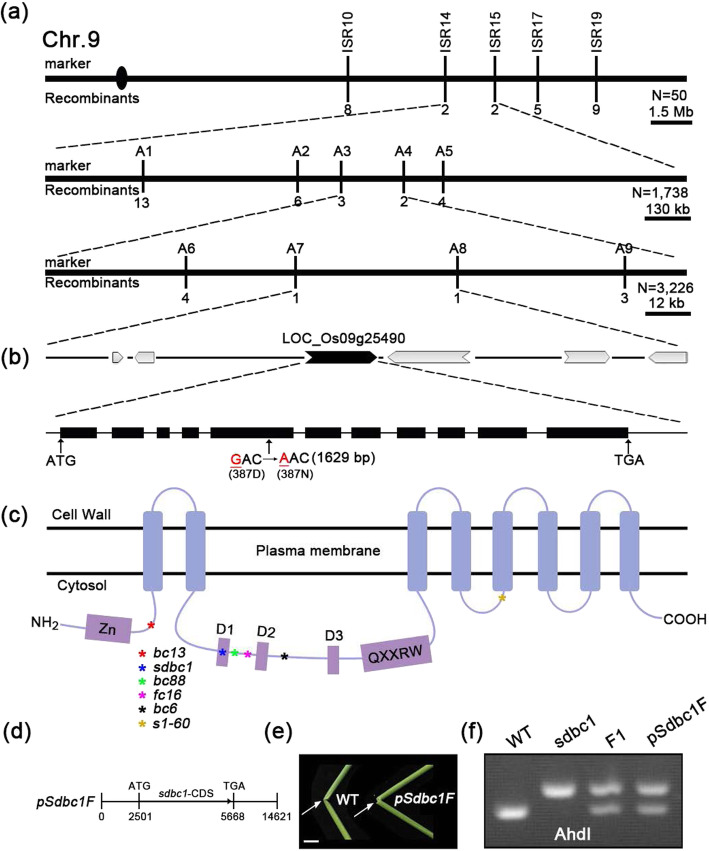
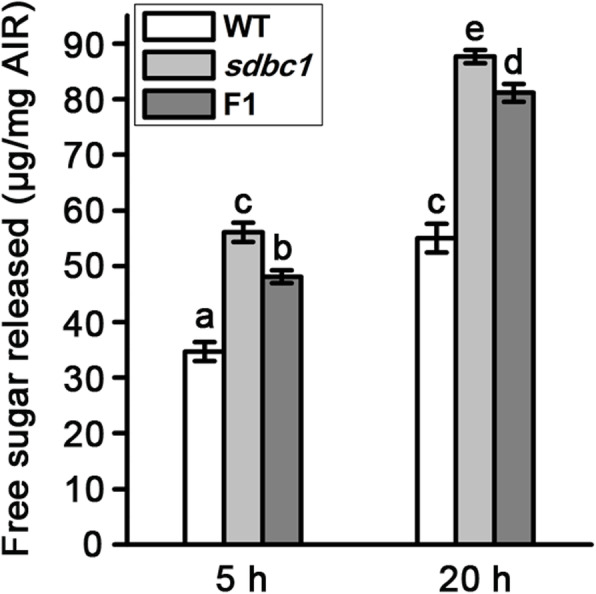
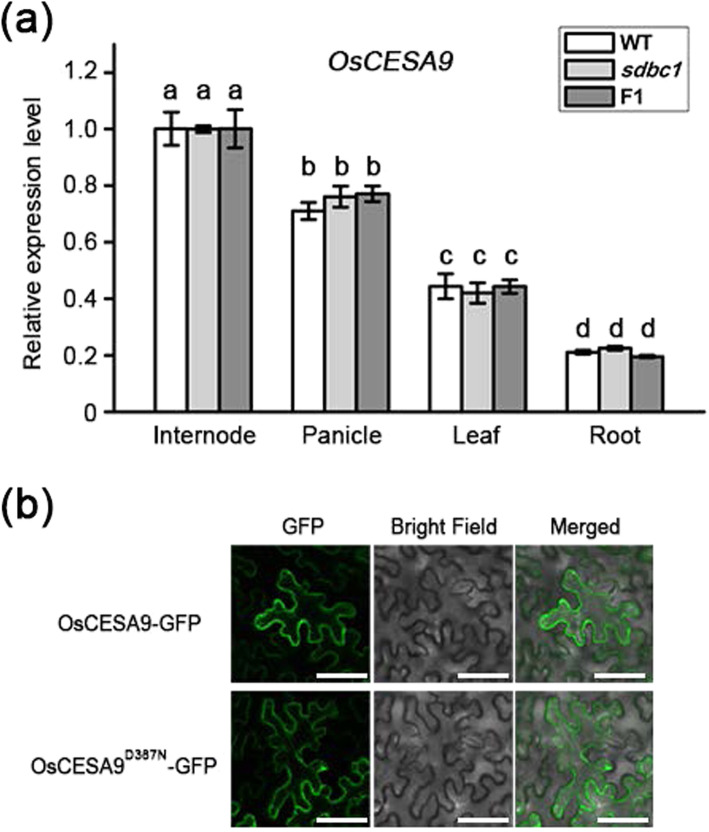
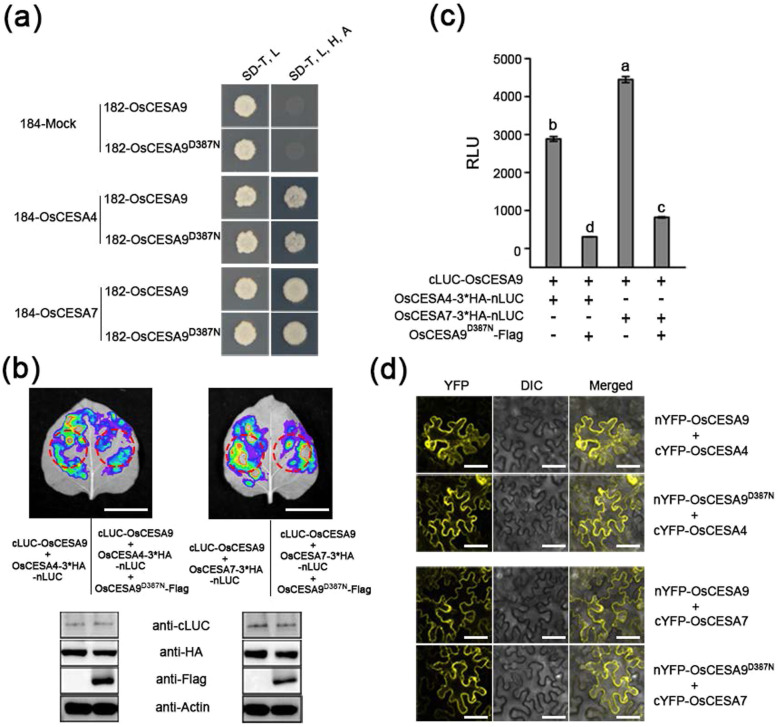
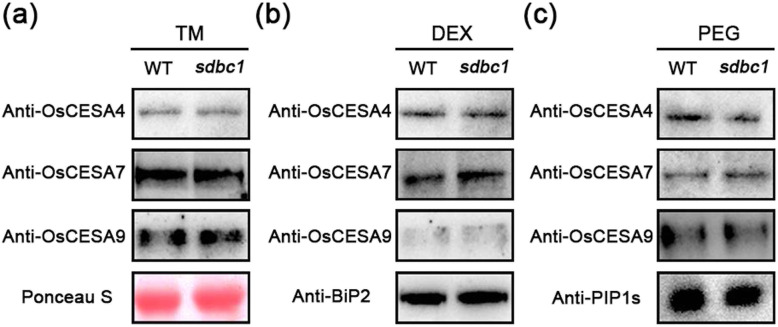
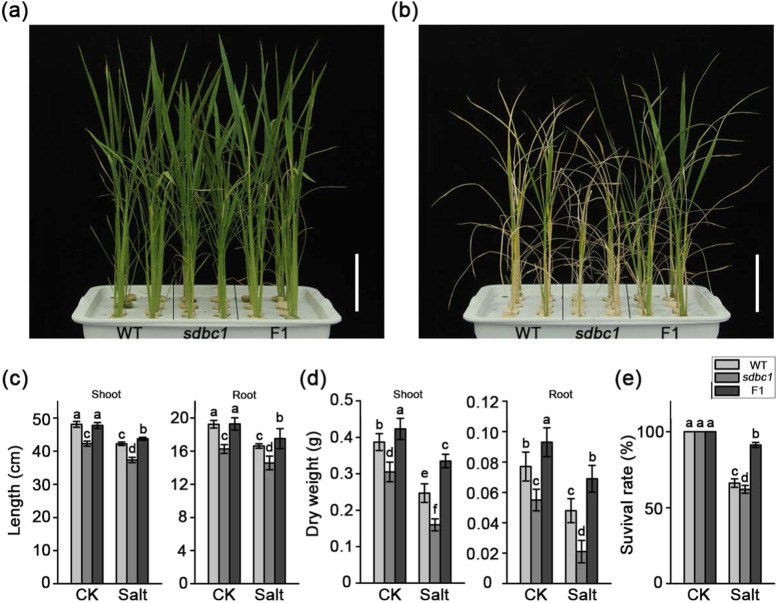
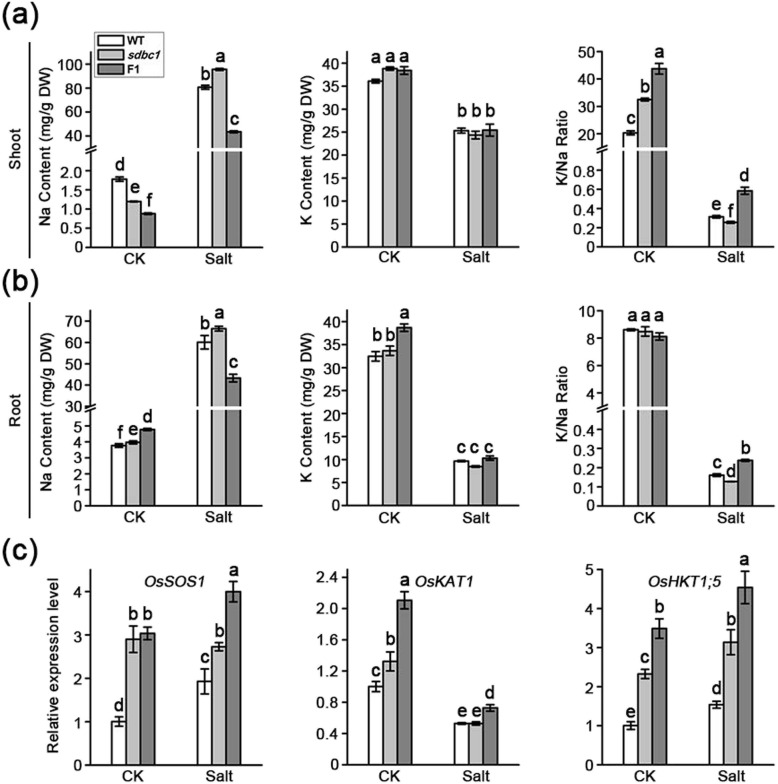
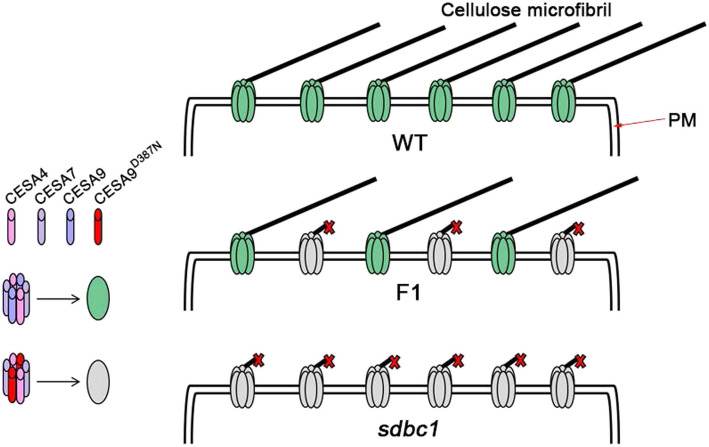
Result: Here, the rice (Oryza sativa) semi-dominant brittle culm (sdbc) mutant Sdbc1, which harbors a substitution (D387N) at the first conserved aspartic acid residue of OsCESA9, exhibits lower cellulose content and reduced secondary wall thickness as well as enhanced biomass enzymatic saccharification compared with the wild type (WT). Further experiments indicated that the OsCESA9D387N mutation may compete with the wild-type OsCESA9 for interacting with OsCESA4 and OsCESA7, further forming non-functional or partially functional CSCs. The OsCESA9/OsCESA9D387N heterozygous plants increase salt tolerance through scavenging and detoxification of ROS and indirectly affecting related gene expression. They also improve rice straw return to the field due to their brittle culms and lower cellulose content without any negative effects in grain yield and lodging.

Conclusion: Hence, OsCESA9D387N allele can improve rice salt tolerance and provide the prospect of the rice straw for biofuels and bioproducts due to its improved enzymatic saccharification.

Keywords: Cellulose synthesis; Rice; Salt tolerance; Secondary cell wall (SCW); Straw process.


Conflict of interest statement

The authors declare that they have no competing interests.

Figures

Fig. 1
Fig. 1
sdbc1 mutant identification and agronomic trait observation. a Four month old wild type (WT), sdbc1 homozygous (sdbc1) and Sdbc1 heterozygous (F1) plants. Bar = 10 cm. b, c Brittleness of culms (Bar = 5 cm) and leaves (Bar = 3 cm). d, e Measurements of the extension force of internodes and leaves. f Plant height. g Tiller number h Number of grains per panicle. i Panicle length. j Seed setting rate. k 1000-grain weight. Error bars represent SE (n = 50). Different letters denote significant differences (P < 0.05, Duncan’s multiple range test)
Fig. 2
Fig. 2
Scanning electron micrographs of the sclerenchyma cell walls of WT (a), sdbc1 (c) and F1 plant (e). b, d and f are enlargements of the red boxed areas in a, c and e, respectively. Bars = 20 μm (a, c and e) and 2 μm in (b, d and f). g The thickness of sclerenchyma cell walls. h The thickness of parenchyma cell walls. SC: sclerenchyma cell, indicated by the yellow dash line; PC: parenchyma cell, indicated by the blue dash line. Error bars represent SE (n = 30). Different letters denote significant differences (P < 0.05, Duncan’s multiple range test)
Fig. 3
Fig. 3
Map-based cloning of the SDBC1 gene. a The sdbc1 locus was mapped to the region between markers ISR14 and ISR15 on chromosome 9 and further narrowed to an approximately 45 kb region between markers A7 and A8. Vertical lines represent the positions of molecular markers and the number of recombinants. b 6 predicted ORFs within the fine mapping region and sequencing analysis revealed a point mutation that results one amino acid change at the 387th residue. c Protein structure of OsCESA9. Different color asterisks represent different OsCESA9 alleles. d A construct for complementary assay. e Folding the internodes of rice plants (indicated by the arrows) to show the reduced mechanical property in the complemented plants, Bar = 2 cm. f A CAPS marker (digested by AhdI) was developed to distinguish the WT and sdbc1 background
Fig. 4
Fig. 4
Saccharification analysis of the wall residues from WT, sdbc1 and F1 internodes. The wall residues were treated with enzyme mixture for 5 and 20 h. Error bars indicate SE from the mean of three replicates. Different letters denote significant differences (P < 0.05, Duncan’s multiple range test)
Fig. 5
Fig. 5
OsCESA9D387N mutation does not affect its expression pattern and subcellular localization. a The expression level of OsCESA9 in various rice organs of WT, sdbc1 and F1 plants. The Actin1 gene was used as an internal control. b The subcellular localization of OsCESA9 and OsCESA9D387N. Full-length OsCESA9 and OsCESA9D387N fused with green fluorescent protein (GFP) were expressed in N. benthamiana leaves, Bars = 60 μm
Fig. 6
Fig. 6
OsCESA9D387N compete with OsCESA9 for interaction with OsCESA4 and OsCESA7. a Both OsCESA9 and OsCESA9D387N can interact with OsCESA4 and OsCESA7 in yeast. 182-OsCESA9 and 182-OsCESA9D387N are the bait plasmid containing full length cDNA of OsCESA9 and OsCESA9D387N, respectively. 184-OsCESA4 and 184-OsCESA7 are the prey plasmid containing full length cDNA of OsCESA4 and OsCESA7, respectively. 184-Mock, empty prey plasmid. SD/−T -L, SD medium lacking tryptophan and leucine; SD/−T -L -H -A, SD medium lacking tryptophan, leucine, histidine, and adenine. b, c Split firefly luciferase complementation (SPLC) assays showing the interactions of OsCESA9 with OsCESA4 and OsCESA7 were weakened in the presence of OsCESA9D387N in N. benthamiana leaves, Bars = 2 cm. The western blotting results in (b) indicating all constructs were agroinfiltrated into N. benthamiana leaves have been expressed. c The relative luminescence unit (RLU) values were measured by using the red circle (b) for crude enzyme extraction. Different letters denote significant differences (P < 0.05, Duncan’s multiple range test). d BiFC assays indicate that OsCESA9D387N direct interact with OsCESA4 and OsCESA7 on the plasma membrane, consist with its WT form OsCESA9, Bars = 60 μm
Fig. 7
Fig. 7
The OsCESA9D387N mutation does not affect secondary cell wall CSC trafficking. a Western blotting analysis of OsCESA4, OsCESA7 and OsCESA9 with their polyclonal antibodies in microsomal pellet between WT and sdbc1 plants. Ponceau S, loading control; TM, total membrane. b and c Western blotting analysis of OsCESA4, OsCESA7 and OsCESA9 in DEX (endomembrane) and PEG (plasma membrane) fractioned membrane proteins extracted from WT and sdbc1 plants. DEX, the endomembrane fraction; PEG, the plasma membrane fraction; Anti-BiP2 and Anti-PIP1s antibodies are used to label the marker protein in the endomembrane and plasma membrane, respectively. Western blotting analysis has been repeated for at least three times
Fig. 8
Fig. 8
The Sdbc1 heterozygous (F1) plants have more tolerance to salt. a and b are the phenotypes of WT, sdbc1 and F1 plants before and after slat stress, respectively. c The shoot (left) and root (right) lengths for WT, sdbc1 and F1 plants under control and salt stress conditions. d The shoot (left) and root (right) biomasses per plant for WT, sdbc1 and F1 plants under control and salt stress conditions. e The survival rates of the WT, sdbc1 and F1 plants after salt stress treatment. Error bars indicate the SE of three biological repeats. Different letters denote significant differences (P < 0.05, Duncan’s multiple range test)
Fig. 9
Fig. 9
OsCESA9D387N mutation effects Na+ and K+ homeostasis. a and b Na+ content (left), K+ content (middle) and K+/Na+ ratio (right) in the shoots and roots of WT, sdbc1 and F1 plants, respectively. Different letters denote significant differences. c Expression levels of genes that encode for Na+ and K+ transporters in WT, sdbc1 and F1 plants. The Actin1 gene was used as an internal control. CK, control check. Error bars indicate the SE of three biological repeats. (P < 0.05, Duncan’s multiple range test)
Fig. 10
Fig. 10
A hypothesis model of OsCESA9D387N mutation. In the presence of OsCESA9D387N, OsCESA9D387N can also interact with OsCESA4 and OsCESA9 to form non-functional or partially functional CSCs, and further affect cellulose synthesis. PM, plasma membrane

References

    1. Alam A, Zhang R, Liu P, Huang J, Wang Y, Hu Z, Madadi M, Sun D, Hu R, Ragauskas AJ, et al. A finalized determinant for complete lignocellulose enzymatic saccharification potential to maximize bioethanol production in bioenergy Miscanthus. Biotechnol Biofuels. 2019;12:99. doi: 10.1186/s13068-019-1437-4. - DOI - PMC - PubMed
    1. Cabiles DMS, Angeles OR, Johnson-Beebout SE, Sanchez PB, Buresh RJ. Faster residue decomposition of brittle stem rice mutant due to finer breakage during threshing. Soil Tillage Res. 2008;98:211–216. doi: 10.1016/j.still.2007.12.004. - DOI
    1. Cao H, Guo S, Xu Y, Jiang K, Jones AM, Chong K. Reduced expression of a gene encoding a Golgi localized monosaccharide transporter (OsGMST1) confers hypersensitivity to salt in rice (Oryza sativa) J Exp Bot. 2011;62:4595–4604. doi: 10.1093/jxb/err178. - DOI - PMC - PubMed
    1. Cao WH, Liu J, He XJ, Mu RL, Zhou HL, Chen SY, Zhang JS. Modulation of ethylene responses affects plant salt-stress responses. Plant Physiol. 2007;143:707–719. doi: 10.1104/pp.106.094292. - DOI - PMC - PubMed
    1. Chen H, Zou Y, Shang Y, Lin H, Wang Y, Cai R, Tang X, Zhou JM. Firefly luciferase complementation imaging assay for protein-protein interactions in plants. Plant Physiol. 2008;146:368–376. doi: 10.1104/pp.107.111740. - DOI - PMC - PubMed

LinkOut - more resources