. 2021 Apr 15;32(8):800-822.
doi: 10.1091/mbc.E20-10-0635. Epub 2021 Feb 17.

Roles for ELMOD2 and Rootletin in ciliogenesis

Affiliations

Roles for ELMOD2 and Rootletin in ciliogenesis

Rachel E Turn et al. Mol Biol Cell. .

Abstract

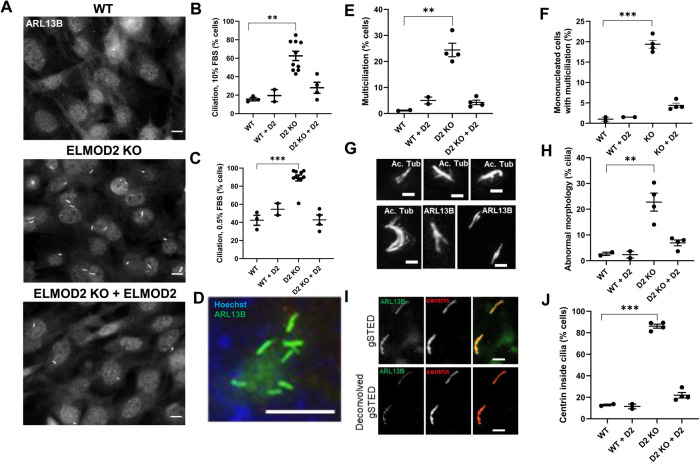
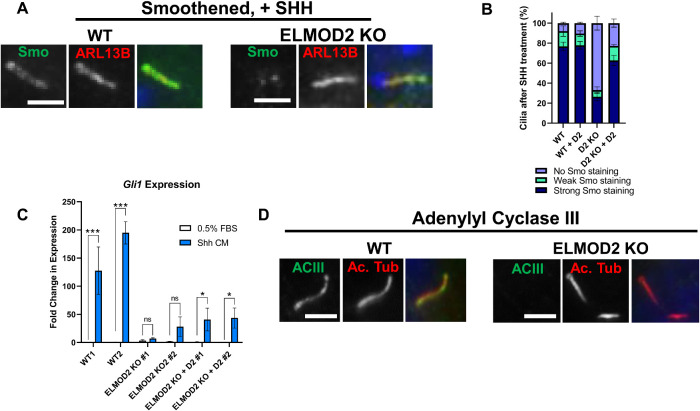
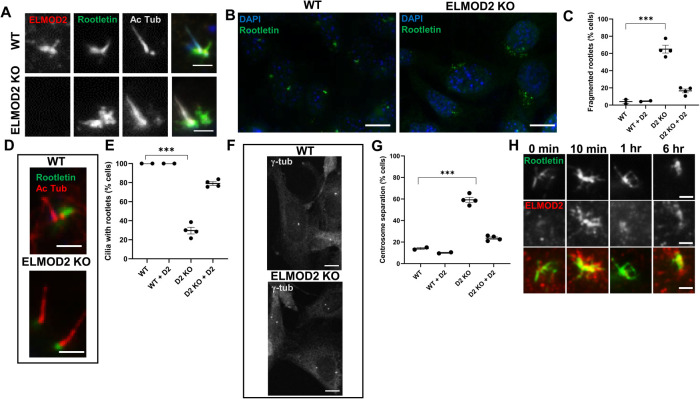
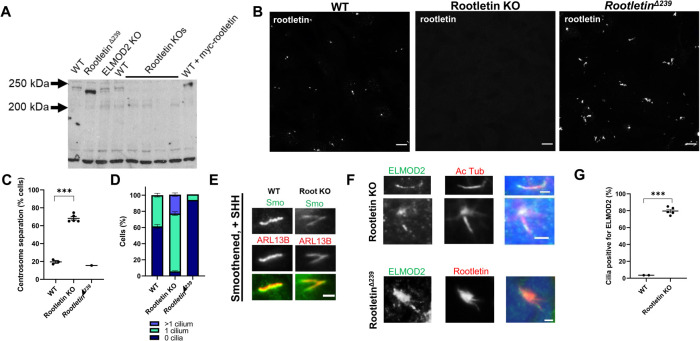
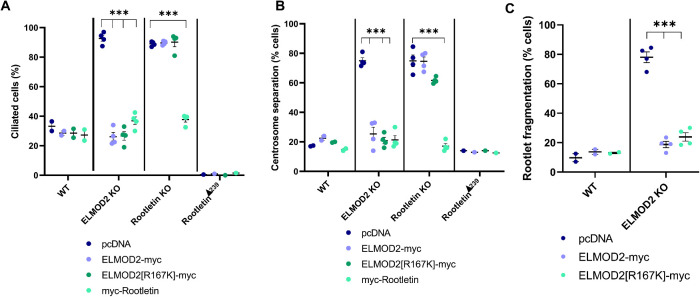
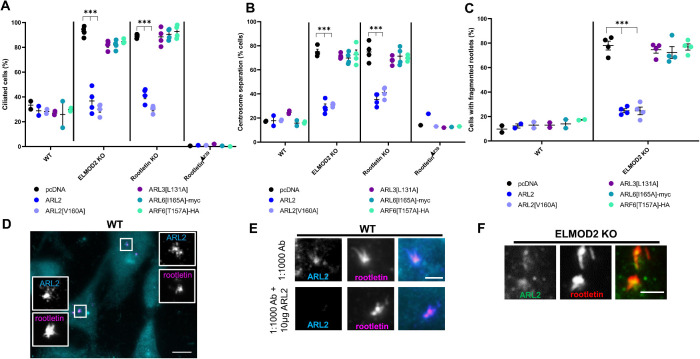
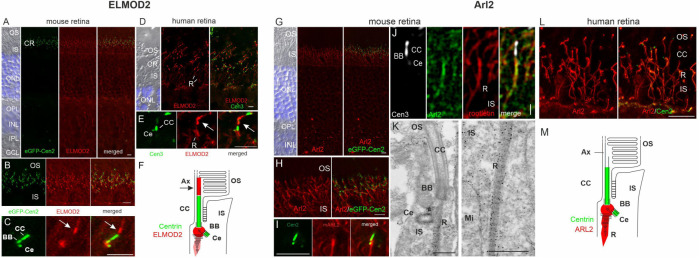
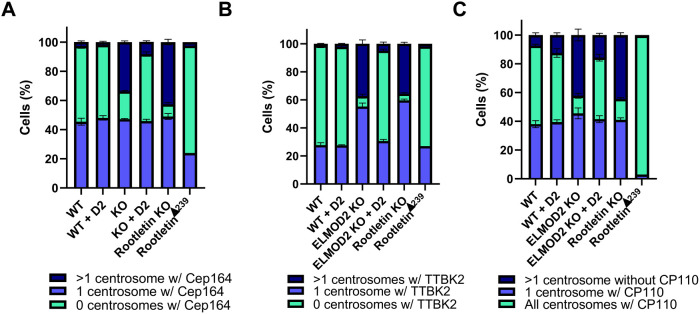
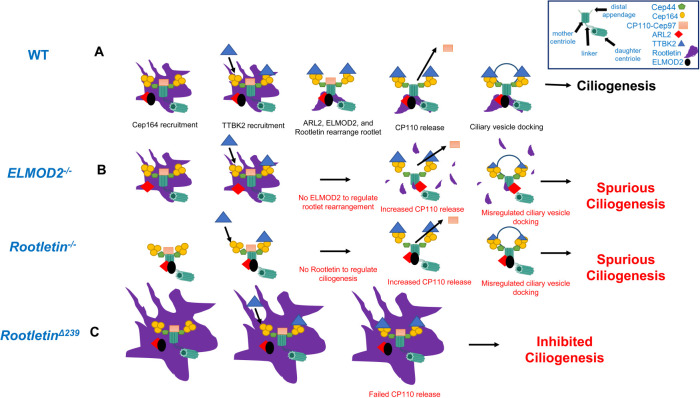
ELMOD2 is a GTPase-activating protein with uniquely broad specificity for ARF family GTPases. We previously showed that it acts with ARL2 in mitochondrial fusion and microtubule stability and with ARF6 during cytokinesis. Mouse embryonic fibroblasts deleted for ELMOD2 also displayed changes in cilia-related processes including increased ciliation, multiciliation, ciliary morphology, ciliary signaling, centrin accumulation inside cilia, and loss of rootlets at centrosomes with loss of centrosome cohesion. Increasing ARL2 activity or overexpressing Rootletin reversed these defects, revealing close functional links between the three proteins. This was further supported by the findings that deletion of Rootletin yielded similar phenotypes, which were rescued upon increasing ARL2 activity but not ELMOD2 overexpression. Thus, we propose that ARL2, ELMOD2, and Rootletin all act in a common pathway that suppresses spurious ciliation and maintains centrosome cohesion. Screening a number of markers of steps in the ciliation pathway supports a model in which ELMOD2, Rootletin, and ARL2 act downstream of TTBK2 and upstream of CP110 to prevent spurious release of CP110 and to regulate ciliary vesicle docking. These data thus provide evidence supporting roles for ELMOD2, Rootletin, and ARL2 in the regulation of ciliary licensing.


Figures

FIGURE 1:
FIGURE 1:
Deletion of ELMOD2 causes ciliary defects. (A) ELMOD2 KO cells display increased ciliation and multiciliation, compared with WT MEFs. Cells were grown to ∼80% confluence, fixed with 4% PFA, permeabilized with 0.1% Triton X-100, and stained for ARL13B as a marker of ciliation. Representative images were collected at 60× magnification using wide-field microscopy. Scale bar = 10 µm. (B) Using the same conditions as described in A, ciliation was scored in two WT, 10 ELMOD2 KO, and four ELMOD2-rescued lines. One hundred cells per cell line were scored for the presence of one or more cilia. ARL13B and acetylated tubulin were used as markers to detect cilia. (C) The same experiment was performed as described for B, except that cells were serum starved and plated at 90–100% confluence. (D) Loss of ELMOD2 leads to increased multiciliation. Cells were fixed with 4% PFA, permeabilized with 0.1% Triton X-100, and stained for ARL13B to detect cilia and with Hoechst to identify individual cells. Images were collected using wide-field microscopy at 100× magnification. Scale bar = 10 µm. (E) The same experiment was performed as described for C, except that multiciliation (>1 cilia) was scored. (F) The same experiment was performed as described for E, except that multiciliation was scored in mononucleated cells with only one to two centrosomes. This was performed to ensure that the multiciliation phenotype was not simply a consequence of cell cycle defects. (G) Examples of cilia with abnormal morphology are shown. Images were collected using wide-field microscopy at 100× magnification, highlighting the branching/splaying. Panels are labeled to indicate whether ARL13B or acetylated tubulin staining is shown, though no differences were noted. Scale bar = 2 µm. (H) Serum-starved cells stained for ARL13B and acetylated tubulin were scored for abnormal morphology (i.e., branching or splaying). Only ciliated cells were scored. (I) g-STED microscopy (100× magnification) confirms the localization of centrin to cilia in ELMOD2 KO cells. The two cilia shown in this image are in a single cell. These cilia have centrin localization along the length of the cilium as well as at buds. (J) Percentages of cells with cilia positive for centrin were scored. Experiments were performed in triplicate, and the average of the triplicate for each line was plotted. Results were tabulated in an interleaved scatterplot via GraphPad Prism. Statistical significance was assessed using one-way ANOVA; ** = p < 0.01; *** = p < 0.0001.
FIGURE 2:
FIGURE 2:
Ciliary signaling is disrupted in ELMOD2 KO lines. (A) ELMOD2 KO cells show decreased Smo recruitment after SHH treatment, compared with WT cells. Cells (two WT, four ELMOD2 KO, and four ELMOD2 KO + ELMOD2-myc) were serum starved, treated with SHH-enriched medium for 24 h to induce, fixed with 4% PFA, and permeabilized with 0.1% Triton X-100. Cells were costained for Smo, ARL13B, and Hoechst. Scale bar = 10 µm. (B) Cells were stained as described in A, and 100 were scored per line in triplicate. Ciliated cells were binned into either having strong, weak, or no Smo staining, as described under Materials and Methods. The average of the triplicates for each line was determined, and the data were plotted as a stacked bar graph. Error bars indicate SEM. (C) ELMOD2 KO MEFs show reduced SHH-stimulated Gli1 transcriptional response, compared with WT cells. Cells were collected 48 h after SHH treatment, and levels of Gli1 mRNA were determined using qPCR. Data are presented as mean fold change ± SD, and bar graphs indicate normalized mRNA expression. Statistical significance was assessed using two-way ANOVA; * = p < 0.05; *** = p < 0.0001, ns = not significant. (D) ELMOD2 KO cells show reduced recruitment of ACIII. Serum-starved cells were fixed and stained for ACIII, as described under Materials and Methods. Representative images were collected via wide-field microscopy at 100× magnification. Scale bar = 10 µm.
FIGURE 3:
FIGURE 3:
ELMOD2 localizes to rootlets, and its deletion causes rootlet defects. (A) ELMOD2 localizes to rootlets in WT MEFs. WT or KO cells were fixed for 5 min in ice-cold methanol and stained for ELMOD2, acetylated tubulin, and Rootletin, as described under Materials and Methods. Images were collected via wide-field microscopy at 100× magnification. Scale bar = 10 µm. (B, C) ELMOD2 KO cells have increased rootlet fragmentation. Serum-starved, methanol-fixed cells were stained for Rootletin and Hoechst. Images were collected using wide-field microscopy at 100× magnification and (C) scored in duplicate for fragmented rootlets. (D) Rootletin staining in ELMOD2 KO cells is limited to the base of cilia and is more condensed than in WT cells. Growth and fixation conditions were the same as in B. Cells were stained with Rootletin and acetylated tubulin (to mark cilia). Images were collected via wide-field microscopy at 100× magnification. (E) The same conditions as described for C were used to score cell lines for cilia with rootlets. Only ciliated cells were scored. (F) ELMOD2 KO cells show increased centrosome separation. Serum-starved cells were fixed with ice-cold methanol, stained for γ-tubulin, and imaged via confocal microscopy at 100× magnification, with z-projections. Scale bar = 10 µm. (G) Using the same conditions as described in B, cells were scored for centrosome separation using FIJI image processing software with the provided measuring tool. Cells were counted as “separated” if they were more than 2 µm apart. (H) ELMOD2 and Rootletin staining both change after serum starvation. WT MEFs were fixed at different times after serum starvation and stained for ELMOD2 and Rootletin. Representative wide-field images were collected at 100× magnification. Staining of each at basal bodies is strongly increased within 10 min, showing extensive overlap. At later times each becomes more concentrated into a smaller area, but filamentous staining of ELMOD2 is lost before that of Rootletin. When scoring was performed, the average of duplicates of individual lines was plotted using an interleaved scatterplot. Error bars indicate SEM. Statistical significance was assessed using one-way ANOVA; *** = p < 0.0001.
FIGURE 4:
FIGURE 4:
Rootletin KO lines phenocopy ELMOD2 KO ciliary and centrosomal cohesion defects. (A) Immunoblotting shows the absence of Rootletin in Rootletin KO, no changes from WT in ELMOD2 KO cells, and strongly increased expression in RootletinΔ239 cells. Equal protein was loaded into a 7.5% polyacrylamide gel before being transferred to nitrocellulose membrane and stained for Rootletin, as described under Materials and Methods. The band migrating at ∼240 kDa, based on comparison to protein standards, in WT and ELMOD2 KO MEFs is absent in Rootletin KO lines. This band is increased in intensity upon expression of myc-Rootletin (far right lane). The RootletinΔ239 cell lysate, instead, has a stronger staining band that migrates ∼20 kDa faster compared with WT. An image after 1-min exposure to film is shown. See Supplemental Figure S6 for other images. (B) Confocal images (100× magnification, z-stacks) of WT, Rootletin KO, and RootletinΔ239 cells stained for Rootletin are shown. Scale bar = 10 µm. (C) Rootletin KO cells have increased centrosome separation compared with WT. Cells were fixed with ice-cold methanol and stained for γ-tubulin to mark centrosomes. Fields of cells at 100× magnification were taken and processed using FIJI imaging software to measure the distance between centrosomes. Centrosomes that were more than 2 µm apart were considered separated. This experiment was performed in duplicate, and the average of the duplicates of each line was plotted in an interleaved scatterplot. Error bars indicate SEM. Statistical significance was assessed using one-way ANOVA; *** = p < 0.0001. (D) Serum-starved WT, Rootletin KO, and RootletinΔ239 cells reveal that loss of Rootletin leads to increased ciliation, while expression of Rootletin [Δ239] prevents ciliation. Cells were stained for acetylated tubulin or ARL13B and scored in duplicate for having either 0, 1, or >1 cilia. Data were graphed in GraphPad Prism using a stacked bar graph. Error bars indicate SEM. (E) Serum-starved, SHH-treated WT and Rootletin KO cells were stained for Smo and ARL13B. Wide-field images collected at 100× magnification are shown. Scale bar = 2 µm. (F) ELMOD2 localizes to cilia in Rootletin KO and strongly to rootlets in the RootletinΔ239 mutant. Serum-starved cells were stained for ELMOD2 and either Rootletin or acetylated tubulin. Images were collected via wide-field microscopy at 100× magnification. Scale bar = 10 µm. (G) The Rootletin KO cells described in F were scored for percentage of cells with cilia positive for ELMOD2. The experiment was performed in duplicate, and the average of the duplicates of each line was plotted in an interleaved scatterplot. Error bars indicate SEM. Statistical significance was assessed using one-way ANOVA; *** = p < 0.0001.
FIGURE 5:
FIGURE 5:
ELMOD2-myc and ELMOD2[R167K]-myc rescue ciliation and centrosomal cohesion defects in ELMOD2 KO but not Rootletin KO cells. Cell lines (two WT, four ELMOD2 KO, four Rootletin KO, and RootletinΔ239) were transfected with either empty vector or plasmids directing expression of ELMOD2-myc or ELMOD2[R167K]-myc before being replated onto coverslips, serum starved, fixed with ice-cold methanol, and stained for Rootletin, acetylated tubulin, and γ-tubulin. Cells were scored in duplicate for either (A) percent ciliation, (B) centrosome separation (centrosomes >2 µm apart), or (C) rootlet fragmentation, with 100 cells scored per replicate. The averages of individual lines were plotted as individual points in leafed scatterplots. Error bars indicate SEM. Statistical significance was assessed using one-way ANOVA, comparing each of the test groups to WT. In cases where multiple conditions show the same statistically significant change compared with WT, a bracket pointing to each line showing that change is indicated; *** = p < 0.0001.
FIGURE 6:
FIGURE 6:
ARL2 and ARL2[V160A] reverse the increased ciliation, rootlet fragmentation, and centrosome separation defects seen in ELMOD2 and Rootletin KO cells. Cell lines (two WT, four ELMOD2 KO, four Rootletin KO, and RootletinΔ239 mutant) were transfected with the following constructs: pcDNA (empty vector control), ARL2, ARL2[V160A], ARL3[L131A], ARL6[I165A]-myc, or ARF6[T157A]-HA before being serum starved for 24 h. Cells were then stained for Rootletin, acetylated tubulin, and γ-tubulin and then scored in duplicate for either (A) percent of cells with at least one cilium, (B) centrosome separation (centrosomes >2 µm apart), or (C) rootlet fragmentation, with 100 cells scored per replicate. The averages of individual lines were plotted as individual points in leafed scatterplots. Error bars indicate SEM. Statistical significance was assessed using one-way ANOVA, comparing each of the test groups to WT. In cases where multiple conditions show the same statistically significant change compared with WT, a bracket pointing to each condition is shown; *** = p < 0.0001. (D) WT cells show ARL2 colocalization with Rootletin. A representative image is shown using wide-field microscopy at 100× magnification. Scale bar = 10 µm. (E) ARL2 staining at rootlets is lost with antigen competition. Images were collected using the same conditions as described in A, except that in the bottompanel the primary antibody was incubated with 10 µg purified recombinant human ARL2 before use in cell staining. (F) ARL2 localization to rootlets is maintained in ELMOD2 KO cells. Images were collected using the same conditions as described in D, except that ELMOD2 KO cells rather than WT MEFs were used.
FIGURE 7:
FIGURE 7:
ELMOD2 and ARL2 display specific localizations to either the periciliary region and the base of the axoneme or the basal body and the ciliary rootlet, respectively, in human and mouse retinal photoreceptor cells. Human and mouse retinas harvested from patient donors or WT (bl6) and transgenic eGFP-CETN2 mice were cryosectioned, immunolabeled, and analyzed with either a deconvolution microscope, a confocal laser scanning microscope, or transmission electron microscopy, as described under Materials and Methods. (A, B) In the retina of transgenic eGFP-CETN2 mice, immunolabeling revealed prominent immunofluorescence of ELMOD2 in the ciliary region (CR) of the photoreceptor cell layer at the junction between the outer segment (OS) and the inner segment (IS). The other retina layers, blue DAPI-stained outer and inner nuclear layers (ONL, INL), outer and inner plexiform layers (OPL, IPL), and ganglion cell layer (GCL) did not show substantial staining. (C) Higher-magnification imaging revealed ELMOD2 in the periciliary region between the GFP-centrin signal at the basal body (BB) and the adjacent centriole (Ce) and in continuum of the connecting cilium (CC), the axoneme of the photoreceptor OS base (arrow). (D, E) Coimmunolabeling using ELMOD2 and centrin 3 antibodies validated the periciliary region and axoneme (arrow) localization of ELMOD2, but also indicate weak staining of ciliary rootlets (R) in human retinal photoreceptor cells. (F) Scheme of ELMOD2 localization in photoreceptor cells. ELMOD2 localizes to the base of the axoneme (Ax), the periciliary region, and to the ciliary rootlet (in human). (G, H, I) In transgenic eGFP-CETN2 mice, immunostaining indicated the localization of ARL2 in the periciliary region and at the ciliary rootlets (R) of the photoreceptor CC. (J) Furthermore, coimmunolabeling of ARL2 and Rootletin in mouse retinas revealed colocalization of both proteins. (K) Immunoelectron microscopic preembedding labeling revealed ARL2 localization in ciliary rootlets (R) and at the adjacent centriole (Ce) and basal body (BB) in the periciliary region and thereby confirmed the colocalization of ARL2 and Rootletin. Mi, mitochondrion. (L) In human retinas immunostaining of ARL2 and centrin 2 validated the rootlet localization as it was previously shown in the mouse retina. (M) Scheme of ARL2 localization in photoreceptor cells. ARL2 is localized to the periciliary region (at BB and Ce) and the ciliary rootlet (R). Scale bar in G–J and L: 5 µm; in K: 400 nm.
FIGURE 8:
FIGURE 8:
ELMOD2 KO causes misregulation of markers of different steps in ciliogenesis. (A) Loss of ELMOD2 or Rootletin leads to increased Cep164 recruitment. Cells (two WT, four ELMOD2 KO, four ELMOD2 KO + ELMOD2-myc, four Rootletin KO, and one RootletinΔ239) were serum starved and scored for changes in Cep164 localization, using γ-tubulin to mark centrosomes, as described under Materials and Methods. Cells were scored in duplicate and binned as either having 0, 1, or >1 centrosome positive for Cep164. Data were plotted in a stacked bar graph, and error bars indicate SEM. (B) TTBK2 is increased at centrosomes in ELMOD2 and Rootletin KO cells. The same conditions as shown for A were used to monitor changes in TTBK2 recruitment, except that cells were costained with both γ-tubulin and acetylated tubulin to track both centrosomes and cilia, and cells were fixed for only 5 min. (C) Deletion of either ELMOD2 or Rootletin leads to increased CP110-negative centrosomes, even cells with >1 centrosome being negative for CP110. The same conditions as shown for A were used to determine whether CP110 localization to centrosomes changes in ELMOD2 KO cells.
FIGURE 9:
FIGURE 9:
ELMOD2, ARL2, and Rootletin work together to prevent spurious ciliogenesis. (A) In WT cells responding to serum starvation or signal to ciliate, ELMOD2 is shown bound to ARL2 at basal bodies and with Cep44, the CP110-Cep97 complex, all surrounded by rootlets and the recent recruitment of Cep164 highlighted at the start (left) of the pathway. The presence of Cep164 recruits TTBK2 directly, and subsequently rootlets are reorganized as licensing continues. The release of CP110-Cep97 allows for ciliary vesicle docking and ciliogenesis to occur. We propose that ELMOD2 and Rootletin act early in suppressing ciliogenesis to regulate licensing, by preventing spurious CP110-Cep97 complex release. (B) In the absence of ELMOD2 or Rootletin we see increased incidence of Cep164 and TTBK2 recruitment, loss of rootletin organization around the basal body in ELMOD2 KO or simply no rootlets in the Rootletin KO, and increased CP110 release, resulting in consequent increased ciliation and multiciliation. (C) The RootletinΔ239 line shows increased localization of Rootletin, ARL2, and ELMOD2 at centrosomes and strongly reduced ciliation compared with WT. These cells have slightly reduced Cep164 and TTBK2 recruitment and strong retention of CP110, resulting in inhibition in ciliogenesis progression.

Similar articles

Cited by

References

    1. Ahmadian MR, Stege P, Scheffzek K, Wittinghofer A (1997). Confirmation of the arginine-finger hypothesis for the GAP-stimulated GTP-hydrolysis reaction of Ras. Nat Struct Biol 4, 686–689. - PubMed
    1. Akiyama T, Inoko A, Kaji Y, Yonemura S, Kakiguchi K, Segawa H, Ishitsuka K, Yoshida M, Numata O, Leproux P, et al. (2017). SHG-specificity of cellular Rootletin filaments enables naive imaging with universal conservation. Sci Rep 7, 39967. - PMC - PubMed
    1. Altschuler Y, Liu S, Katz L, Tang K, Hardy S, Brodsky F, Apodaca G, Mostov K (1999). ADP-ribosylation factor 6 and endocytosis at the apical surface of Madin-Darby canine kidney cells. J Cell Biol 147, 7–12. - PMC - PubMed
    1. Aspenstrom P (2020). Fast-cycling Rho GTPases. Small GTPases 11, 248–255. - PMC - PubMed
    1. Bahe S, Stierhof YD, Wilkinson CJ, Leiss F, Nigg EA (2005). Rootletin forms centriole-associated filaments and functions in centrosome cohesion. J Cell Biol 171, 27–33. - PMC - PubMed

Publication types

LinkOut - more resources