. 2021 Feb 17;17(2):e1008677.
doi: 10.1371/journal.pcbi.1008677. eCollection 2021 Feb.

A comprehensive computational model of animal biosonar signal processing

Affiliations

A comprehensive computational model of animal biosonar signal processing

Chen Ming et al. PLoS Comput Biol. .

Abstract

Computational models of animal biosonar seek to identify critical aspects of echo processing responsible for the superior, real-time performance of echolocating bats and dolphins in target tracking and clutter rejection. The Spectrogram Correlation and Transformation (SCAT) model replicates aspects of biosonar imaging in both species by processing wideband biosonar sounds and echoes with auditory mechanisms identified from experiments with bats. The model acquires broadband biosonar broadcasts and echoes, represents them as time-frequency spectrograms using parallel bandpass filters, translates the filtered signals into ten parallel amplitude threshold levels, and then operates on the resulting time-of-occurrence values at each frequency to estimate overall echo range delay. It uses the structure of the echo spectrum by depicting it as a series of local frequency nulls arranged regularly along the frequency axis of the spectrograms after dechirping them relative to the broadcast. Computations take place entirely on the timing of threshold-crossing events for each echo relative to threshold-events for the broadcast. Threshold-crossing times take into account amplitude-latency trading, a physiological feature absent from conventional digital signal processing. Amplitude-latency trading transposes the profile of amplitudes across frequencies into a profile of time-registrations across frequencies. Target shape is extracted from the spacing of the object's individual acoustic reflecting points, or glints, using the mutual interference pattern of peaks and nulls in the echo spectrum. These are merged with the overall range-delay estimate to produce a delay-based reconstruction of the object's distance as well as its glints. Clutter echoes indiscriminately activate multiple parts in the null-detecting system, which then produces the equivalent glint-delay spacings in images, thus blurring the overall echo-delay estimates by adding spurious glint delays to the image. Blurring acts as an anticorrelation process that rejects clutter intrusion into perceptions.


Conflict of interest statement

The authors have declared that no competing interests exist.

Figures
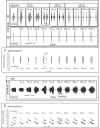
Fig 1
Fig 1. Wideband biosonar broadcasts and echoes.
(A,B) Time waveforms and (C) spectrograms of a bottlenose dolphin echolocation click (broadcast, left) and a series of two-glint echoes with glint-delay spacings (Δt) from 9 to 700 μs (left to right). The click contains only three prominent waves and is about 50 μs long. In the expanded-time waveforms (A), for glint-delay intervals as short as 26 to 35 μs, both reflections are visible as highlights (labeled), and for further spacings they pull apart completely. In contrast, for the spectrograms (C), which have an integration-time of 250 μs, the glint reflections overlap and interfere with each other, creating a single vertical spectrogram ridge that has nulls or ripples in its profile at frequency spacings (Δf) equal to the inverse of the glint time spacings (e.g., at 35 μs Δt, the Δf is 29 kHz). Although the two glint highlights are visible in the time waveforms (A) from 26 to 700 μs, in the spectrograms (C) they pull apart only at 300–700 μs. (D) Time waveforms and (E) spectrograms of a big brown bat FM echolocation chirp (broadcast, left) and a series of two-glint echoes with glint-delay spacings (Δt) from 9 to 700 μs (left to right). The bat chirp is 3 ms long with 1st and 2nd harmonics (FM1 sweeping from 55 to 25 kHz; FM2 sweeping from 90 to 50 kHz). The width of the dark ridges in the FM spectrograms (E) is the integration-time (about 300–350 μs). The duration of the bat chirp is longer than any of the glint-delays, so the time waveforms (D) are completely overlapped from 9 to 700 μs. The highlights in the time waveforms (labeled) are not individual reflections, as is the case for the dolphin click echoes, but instead represent peaks in the interference of the two reflections. The spectrograms (E) have interference nulls at frequency spacings (Δf) equal to the inverse of the glint time spacings (e.g., at 100 μs Δt, the Δf is 10 kHz). The spectral nulls appear as well-defined ripples in the dolphin echo spectrograms (C) for time spacings as short as 26–35 μs because all the frequencies appear at the same moment, so the spectrogram ridge is a continuous vertical stripe. For the bat chirps, the dispersion of frequencies along the sweeps and their bifurcation into 2 harmonics (E) obscures the nulls as ripples until the glint-delay spacing is long enough that two or more nulls are present in each harmonic (100 μs). For spacings of 500 and 700 μs, the spectrogram ridges pull apart to form separate echoes.
Fig 2
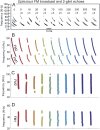
Fig 2. Time-frequency adaptability of FM bat biosonar sounds.
FM pulses recorded from a big brown bat performing in psychophysical tests of virtual echo delay discrimination with electronically-generated echoes [38]. Increasing levels of wideband noise (X axis) were added to the echoes, which induced the bat to increase the duration of its broadcasts from 1–2 ms with no noise (far left) to 6–7 ms in intense noise (far right). Performance in the task nevertheless remained the same in terms of percentage error responses showing that echo reception and delay perception adapt to changing duration of signals.
Fig 3
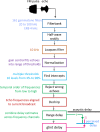
Fig 3. Block diagram of SCAT model.
The input is an FM pulse followed by an echo at delay (t) with two glint reflections separared by (Δt). These signals are segmented into parallel frequency channels by 161 bandpass filters (4th order gammatone filters, center frequencies from 20 to 100 kHz, equivalent rectangular bandwidth, ERB, 4 kHz), then half-wave rectified and lowpass filtered (10 kHz cutoff). Outputs are then normalized to fit into 10 equally spacedthreshold levels (3% to 98% full-scale). Processing started at the lowest frequencies in the broadcast in bats 23–25 kHz); if these particular frequencies are absent, then echoes are rejected and processing is not started [64]. To remove the slope of the FM sweeps, echo frequencies are dechirped on the time-frequency plane by setting zero origin of time for individual bandpass frequency channels to threshold times of the pulse, resulting in corresponding thresholds of echoes arrayed at longer delay corresponding to target range. These threshold times are then analyzed by two parallel pathways—range delay from total echo delay (t) determined by time between pulse and echo thresholds combined across all broadcast frequencies, and glint delay (Δt) from spectral notch detection followed by extraction of time spacing for glint reflections before merging of range delay and glint spacing onto a common perceived delay scale (blue, at output).
Fig 4
Fig 4. Algorithms in SCAT model for processing of FM pulses.
(A) Initial reception of biosonar broadcast and returning echo. The FM pulse contains two harmonic sweeps FM1, FM2) and is followed 6 ms later by 100-μs two-glint FM echoes containing multiple interference nulls at frequencies 10 kHz apart (reciprocal of 100-μs glint spacing) caused by overlapping glint reflections. The model computes spectrograms with 161 parallel gammatone bandpass filters tuned to center frequencies of 20–100 kHz. Filter outputs are half-wave rectified, lowpass-filtered at 10 kHz, and thresholded with 10 amplitude levels. In each channel, the time that elapses between crossings from the same threshold in the chirp and the echo (horizontal arrows, blue circles) marks delay measurements. At frequencies where echo and broadcast spectrograms have the same amplitude, crossings register echo delay from times-of-occurrence accurately. If the echo is weaker, crossings across all frequencies are later due to amplitude-latency trading, and the delay estimate is longer. At frequencies with interference nulls, echo amplitude is locally weaker than at surrounding peak frequencies. At nulls, crossing is later due to amplitude-latency trading (red time offset). (B) Delay is estimated frequency-by-frequency using the pulse-to-echo elapsed times. Threshold crossings in the pulse mark the start of the delay estimate (time zero). Across frequencies, time intervals between pulse and echo crossings are aligned on pulse thresholds at zero time, which dechirps the FM sweeps to make vertical row of time marks. Only crossings from one threshold are shown in A and B to illustrate time marks (blue circles). Time of echo thresholds creates a similar vertical row of marks in each channel, modified by amplitude-latency trading. The threshold marks at the nulls occur later (to the right), causing the dechirped echo to have a scalloped appearance. The leftmost, leading edge of the curved thresholds marks the echo’s 6 ms delay. (C) Inversion of representation from echo amplitudes across frequencies to echo nulls across frequencies. Close-up view on left shows dechirped echo threshold marks for 6–7 activated thresholds (#1 up to 7 out of 10 levels on color bar). This representation is densely populated, coming from all the time-frequency values that exceed different threshold levels spread across about 0.2 ms from lowest threshold (dark blue) to highest threshold (light green). Spectrogram amplitudes track along the thresholds as clusters where they exceed thresholds; nulls have marks only at lowest thresholds because their amplitudes are weak (dark blues), and the track of these threshold events is curved, extending to longer times (rightward) due to amplitude-latency trading. Between peaks, where the thresholds are clustered, there are voids at the center of nulls where none of the thresholds are crossed. Locations of nulls are extracted from scalloped pattern of thresholds across frequencies. These longer latencies and the voids are transformed into representation of the nulls (red horizontal arrows), which is a sparse representation due to inversion from the dense representation of amplitudes that exceed thresholds. This peak-to-null inversion is key to subsequent processing: The late or absent responses at nulls trigger new responses that progress to next stage, a triangular network of model neurons that registers the nulls and connects adjacent nulls with triangular connections at different frequency spacings set by frequency separation between filters in the filterbank. Frequencies of nulls are marked in red dots at the left of the triangular network in 0.5 kHz frequency steps, the same as the gammatone filters. The frequency differences between nulls form a zig-zag pattern of coincidence responses that register the frequency spacing of adjacent nulls (Δf) by their right-most triangular apex points in the zig-zag. These points are read out of the triangular network by the vertical alignment of the triangular apex points (vertical dashed red arrow) projected down onto the horizontal frequency difference scale. This yields an estimate for the average frequency spacing of the nulls (Δf = 10 kHz). The corresponding reciprocal of 100 μs is registered on the horizontal delay difference scale and the spacing of the glint reflections in the echo. (D) The 100-μs glint delay estimate from the triangular network in C (red arrow) is attached to the 6 ms overall echo delay estimate from the thresholds in B (blue arrow) to form an image of the target’s range and shape.
Fig 5
Fig 5. Fine structure of SCAT spectrograms.
(A) Frequency response curves for subset of 32 parallel bandpass filters from the SCAT input system (frequencies from 20 to 100 kHz at 2.5 kHz intervals, a subset of the full filterbank of 161 filters at 0.5 kHz intervals). (B) Dechirped filter outputs (half-wave-rectified, 10 kHz lowpass filtered) for FM broadcast and 100 μs two-glint echo at selected FM1 and FM2 frequencies. Crossings for threshold #4 shown as red dots; dechirping aligns threshold crossings in broadcast at time zero. Horizontal red lines show spectrogram delays in each frequency channel. Curved appearance illustrates effect of amplitude-latency trading (ALT) on individual delay values near nulls in echo spectrum. (C) Heat maps show sequence of peaks in filter outputs for 1st harmonic bands of 26–43 kHz in FM1 and corresponding 2nd harmonic frequency bands of 52–84 kHz in FM2 (marked by vertical red lines in A). Both plots are dechirped by alignment to #4 threshold crossings. The seeming oversampling of frequencies by closely-spaced bandpass filters in A reveals a detailed representation of the cycle-by-cycle structure for adjacent frequency bands in FM1 in spite of 10 kHz lowpass filtering, while this structure is lost at FM2 frequencies, especially above 60 kHz.
Fig 6
Fig 6. Enhanced registration of nulls by amplitude-latency trading.
Dechirped SCAT spectrograms for FM pulse and two-glint echoes with (A) 30 μs glint delay separation and (B) 100μs glint delay separation. Threshold crossings (threshold #3) are marked by circles (orange for no amplitude-latency trading (i.e., just threshold crossing delay); blue for amplitude-latency trading (i.e., threshold crossing delay augmented to 25 μs longer latency per dB attenuation). Inset in B shows magnified view of one null in the 100-μs echo. The 6ms range delay is marked by the leading (left) vertical edge of the row of dots for each echo. Without amplitude-latency trading, the nulls appear as interruptions, or voids, in the orange spectrograms, with a slight rightward trend as frequency approaches the center of the null and the lower amplitude moves the threshold crossings to slightly longer times. The deviations from the range delay can be used to estimate each null’s frequency entirely using threshold-crossing timing information.
Fig 7
Fig 7. SCAT display format for 100 μs glint.
Format of SCAT model output display for the twotwo-glint 100-μs test echo in Fig 4. The horizontal (X axis) shows the range delay from Fig 4B. The frequency scale (Y axis) shows center frequencies of the bandpass filters. The zero origin of the horizontal echo delay scale (X axis) is the dechirped FM pulse (dashed blue line). The echo’s dechirped spectrogram is traced on the X-Y plane by blue dots representing 2nd threshold level as an example. The threshold-crossings follow the scalloped pattern representing low amplitude values at the nulls with longer response latencies (amplitude-latency trading) (see Fig 6). Range delay of the dechirped echo is marked by a light-blue histogram on the X axis. The leading edge of the histogram is taken as the delay because the tail of the histogram is lengthened by amplitude-latency-trading, which retards the delay estimate past the objective delay. The vertical scale (Z axis) shows the estimated time separation of the glints derived from the zig-zag coincidences plotted on the triangular null-detecting network (transparent blue). It is scaled nominally from 300 μs at the bottom (a limit set by the 300-μs filter integration-time where the spectrograms separate into two ridges; Fig 1) to 12.5 μs at the top (a limit set by the maximum width of glint spacing capable of being registered on the 80 kHz wide base of the triangle). Spectral nulls are marked at 10 kHz intervals along the bottom Y-axis edge of the triangle. The back (X-Z) plane shows the glint separation extracted from the triangular null-spacing network from the frequencies of nulls and coincidences that trace a zig-zag pattern according to null separations, with the apex of the zig-zag triangles marking the glint spacing in microseconds. The glint spacing is displayed as a horizontal red histogram rotated sideways on the back plane. The height of the histogram is enlarged for better display. Numerical values of time on the horizontal (X) axis for target range and glint spacing on the vertical (Z) axis are combined into the bat’s perception of each target (Fig 4D).
Fig 8
Fig 8. SCAT displays for different targets.
The SCAT model outputs for three different two-glint echoes at different range delays are consolidated into a single 3D display using the format of Fig 7. (No significance is attached to their range delays; the grouping is merely a way to set up multiple echoes for processing as a batch.) They have glint separations of 50, 100, and 200 μs, respectively (left to right). The frequency scale (Y axis) shows the center frequencies of the bandpass filters. The zero origin of the horizontal echo delay scale (Y axis) is the dechirped FM pulse (dashed blue line). Each echo’s dechirped spectrogram is traced on the X-Y plane by blue dots representing 2nd threshold level, which follow the scalloped pattern representing low amplitude values at the nulls with longer response latencies.). Each dechirped range delay is marked by a black histogram, with delay spaces of 2 ms along the X axis between the dechirped delays. The glint separations are displayed on the spectral to temporal networks (transparent blue triangles). The back (X-Z) plane shows the glint separation extracted from the triangular null-spacing network from the frequencies of nulls and coincidences that trace a zig-zag pattern according to null separations, with the apex of the zig-zag triangles marking the glint spacing in microseconds. The vertical (Z) axis is scaled from 300 μs at the bottom (a limit set by the 300-μs filter integration-time where the spectrograms separate into two ridges; Fig 1) to 12.5 μs at the top (a limit set by the maximum width of glint spacings capable of being registered on the 80 kHz wide base of the triangle). The target shapes are displayed by the glint spacing as horizontal black histograms on the back plane. The height of each histogram is scaled for better display. Numerical values of time on the horizontal (X) axis for target range and glint spacing on the vertical (Z) axis are combined into the bat’s perception of each target.
Fig 9
Fig 9. Conventional and SCAT spectrograms for two-glint click echoes.
(A) The bottlenose dolphin click is formed into two-glint echoes (glint delays 0 to 70 μs) that appear to have separate highlights in the time waveforms (Fig 1A) but merged clicks with spectral nulls in the spectrograms for glint delays of 9 to 200 μs (replotted from Fig 1C). (B) After conversion into auditory spectrograms by the bandpass filterbank, the timing of the ten threshold-level detections (#1 to #10 in color bar) are nearly superimposed in the dechirped broadcast spectrogram (“0 glint,” left), sliding 0.12 ms slightly rightwards as the threshold level rises from lowest (blue) to highest (red). The glint interference patterns modulate the amplitude of the echo spectrograms so that the full range of threshold-crossings (from blue to red) appears at the peaks but not at the intervening nulls, where only the lowest thresholds yield any detections at all. Due to amplitude-latency trading, the time-axis re-represents the amplitudes of the peaks and nulls along the frequency axis by the scalloped pattern of threshold levels. Some echoes don’t have higher threshold crossings because the gain control in SCAT model is an approximate process to align the echo strength to be as close to the broadcast but lower.
Fig 10
Fig 10. SCAT displays for two-glint click echoes.
The 3D SCAT plots of the whole series of two-glint click echoes from Fig 9 portray the range delay of each target on the horizontal X axis and the glint delay of each target on the X-Z plane. Using the display format defined in Fig 7, the dechirped spectrograms are plotted on the X-Y plane. For glint delays from 18 to 200 μs in Fig 9, the triangular network extracts the glint delay for each target from the apex points of the red zig-zag line on the triangular network. Combining the whole series of echoes into a batch for processing yields a graph of glint spacing on the X-Z plane. When the glint spacing reaches 300 μs, the two glint reflections pull apart in the spectrograms and no longer have an interference spectrum to be plotted on the triangular network or projected onto the back plane. Both glints then appear entirely on the horizontal overall delay axis.
Fig 11
Fig 11. SCAT spectrograms for two-glint FM echoes.
(A) Conventional spectrograms for the series of two-glint echoes (0 to 700 μs glint delays) of a bat chirp replotted from Fig 1E. The broadcast has two harmonics (FM1, FM2) (left). For glint delays of 9–300 μs, the spectrograms of the glint reflections are merged and have spectral nulls that appear as patterned ripples for 70–300 μs. At short glint delays of 9–35 μs, the nulls are too far apart to appear as ripple; instead, they obliterate wider segments of the spectrograms. At longer delays of 500–700 μs, the reflections pull apart to form separate ridges that trace the two harmonics. (B) SCAT spectrograms showing threshold crossings as points marking the instantaneous frequency of the sweeps by their threshold crossings (to avoid overlap of dots representing different thresholds, only threshold #3 is illustrated here). The nulls are represented by voids and the scalloped shape of the curves tracing the FM sweeps. (C,D) Dechirped SCAT spectrograms with FM1 and FM2 plotted separately. Segregation of harmonics into two bands is done to take into account the way the bat separates them and assigns FM1 as necessary for delay processing, with FM2 only used if its frequencies mirror those in FM1 [64].
Fig 12
Fig 12. Dechirped SCAT spectrograms for two-glint FM echoes.
Dechirped spectrograms of FM echoes at all ten threshold levels (color bar in the top row) show the characteristic scalloped appearance due to the movement to longer latencies at higher thresholds (yellow to red) for frequencies of peaks and the restriction of threshold crossings to the lowest thresholds at the nulls (blue). FM1 and FM2 are plotted separately, with both harmonics in the broadcast at left. The threshold crossings for the broadcast follow vertical stripes, but the amplitude variations in the two-glint echoes break up the stripes into segments that appear as islands centered on the peaks (see also Fig 4C). The nulls are recognizable by the holes in the spectrograms.
Fig 13
Fig 13. SCAT display for two-glint FM echoes.
The 3D SCAT plot for the series of FM echoes in Fig 12 portrays glint spacing of each target on the X-Z plane associated with its corresponding overall echo delay on the X-Y plane. The spectrograms are trace by blue and green dots for threshold crossings (#3 is illustrated). The dots (blue) tracing FM2 are moved (“dithered”) slightly to the right to avoid overlap with FM1 (green). Estimates for glint spacings from 18 to 300 μs are determined from the triangular null-spacing network and projected onto the back (X-Z plane). For echoes with recognizable spectral ripples (glint delays of 70, 100, 200, and 300 μs) that are traced by red zig-zag lines on the triangular network, the intersection of FM1 and FM2 introduces perturbations in the estimates. When the glint spacing exceeds 300 μs, the two glint reflections pull apart to form separate dechirped spectrograms and no longer have an interference spectrum to be plotted on the back plane. Both glints then appear entirely on the horizontal overall delay axis.
Fig 14
Fig 14. 3D SCAT display for lowpass click echo.
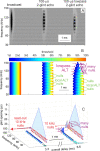
The continuous spectrum of the dolphin clicks helps to illustrate how the SCAT model processes clutter echoes. (A) Periodic spectral ripple for the 100-μs two-glint echo is visible at 10 kHz intervals in the spectrogram from the bandpass filters (see Fig 9), while both the ripple and the broader reduction in strength across high frequencies are visible in the lowpass 100-μs echo. (B) The dechirped SCAT spectrograms show the same pattern of peaks and nulls across the echo spectrum for the two-glint echo (stack of ten thresholds in color bar), but the lowpass echo’s broadly lower amplitude at high frequencies reduces the threshold crossings to only the lowest (blue) and retards their latencies due to amplitude-latency trading. The lowpass roll-off in amplitude is translated into the rightward-curved trajectory of threshold crossings, which brings them into the same latency format used to detect nulls (longer latencies at some frequencies relative to others). (C) The triangular network of null-detecting coincidence nodes readily extracts the 10 kHz null spacing in the two-glint echo and displays it as a 100-μs glint delay on the X-Z plane. In the lowpass echo, the 10 kHz spacing of the nulls also is extracted and displayed, but the wide region of lower amplitudes and longer latencies between 100 and 140 kHz resembles an additional, very wide null. The triangular network registers it as a multiplicity of narrower nulls with a range of different widths from the minimum null spacing of about 3 kHz to about 15 kHz. The resulting nulls all are entered onto the triangular network, which converts them into numerous glint-delay estimates ranging in size from the inverse of 3 kHz (300 μs) to the inverse of 15 kHz (70 μs) (see Fig 15).
Fig 15
Fig 15. Glint-delay display for click echoes.
(A) Graph showing the glint-delay distributions displayed in Fig 14C on the X-Z plane and derived by the triangular network for the 100-μs two-glint echo (red) and the lowpass 100-μs two-glint echo (blue). The 100-μs peak is the salient feature of the two-glint echo from its 10 kHz null spacing, while the lowpass echo shows the 100-μs peak largely swamped by the broad set of nulls from the lowpass region of the triangular network. The lowpass echo represents off-axis clutter, and the blurring effect of the many extraneous nulls detected across the lowpass region illustrates the masking effect of clutter interference with perception of the second glint. (B) The blurring effect that obscures the 100-μs glint in A is mitigated by using the total image “energy,” or the area under each curve, to normalize the display of glint delay, which becomes unmasked by the spread of energy across the glint-delay axis.
Fig 16
Fig 16. Effects of progressively increasing lowpass filtering on FM echoes.
(A) Bandpass filter spectrograms of FM broadcast (for simplification of illustration, signals have just 1 harmonic sweep from 100 down to 20 kHz) and series of seven numbered 100-μs two-glint echoes that have increasing amounts of lowpass filtering (shaded triangle for filtering; shaded ovals for nulls). As lowpass filtering cutoff spreads downward in frequency, the nulls are obscured in the affected high-frequency band. (B) Dechirped SCAT spectrograms (just threshold #1 at 3% amplitude) for the broadcast (at zero on the range delay axis) and the seven numbered lowpass-filtered echoes from A. The spectral nulls (shaded ovals) are visible from the scalloped shape of the spectrograms due to the longer latencies at the individual nulls’ frequencies from amplitude-latency trading. The gradually increasing lowpass filtering (shaded triangle) causes the threshold crossings to shift to longer latencies over higher-frequency region from amplitude-latency trading. It transposes the lower amplitudes from lowpass filtering into longer latencies but also creates the appearance of a single, wide null over the 70–100 kHz high end of the spectrum. How this spurious null is registered turns out to be the key to coping with clutter.
Fig 17
Fig 17. 3D SCAT display for lowpass FM echoes.
3D SCAT display of range-delay and glint-delay estimates for the seven numbered 100-μs lowpass FM echoes in Fig 16. Range-delay histograms along the horizontal X axis here are also shown in Fig 16B. The glint-delay estimates derived from the triangular network are projected onto the X-Z backplane. For the echo with minimal lowpass filtering (echo #1; see Fig 16B), the 10-kHz null spacing is easily seen as the corresponding 100-μs glint delay (red arrow), although even the slight amount of lowpass filtering in echo #1 is enough to start producing a few additional nulls at glint-delays around 250–300 μs (very small shaded purple triangle in corner of large triangular network), making a second peak in the glint-delay histogram. As lowpass filtering becomes stronger (echoes #2-#3), the 100-μs glint in the glint-delay histogram becomes swamped by the spread of the additional nulls that fill up the lowpass region (increasing size of shaded purple triangle in corner of large triangular network). These spurious nulls (and the corresponding shaded triangles) stop spreading across more frequencies for echoes #4-#7. The 100-μs glint is barely discernible in the glint-delay histograms projected onto the X-Z plane. Progressively more lowpass filtering expands the single broad null caused by amplitude-latency trading, which grows and fills more of the large triangular network, but it does not spread below 50–60 kHz, so the addition of further spurious nulls (and the increasing size of the shaded triangle) thereafter stops.
Fig 18
Fig 18. Glint-delay display for FM echoes.
(A) Graph showing the glint-delay distributions displayed in Fig 17 on the X-Z plane and derived by the triangular network for the 100-μs two-glint FM echo (black) and the series of lowpass 100-μs two-glint FM echoes (red to green). The 100-μs peak is the salient feature of the two-glint echo from its 10 kHz null spacing, while the series of lowpass echoes show the 100 μs peak increasingly swamped by the broad set of nulls from the lowpass region of the triangular network in Fig 17. The lowpass echoes represent increasingly large angles of off-axis clutter, and the blurring effect of the many extraneous nulls detected across the lowpass region illustrates the masking effect of clutter interference with perception of the second glint. (B) The progressively stronger blurring effect that obscures the 100 μs glint in A is mitigated by using the total image “energy,” or the area under each curve, to normalize the display of glint delay, which becomes unmasked by the spread of energy across the glint-delay axis.
Fig 19
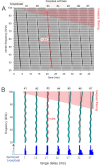
Fig 19. SCAT displays for fluttering moth echoes.
(A) Horizontal stream of echoes (top) and spectrograms (bottom) recorded during a wingbeat cycle from a fluttering army worm moth ensonified from the side (aspect view insert) [53]. The 1.25 ms echoes from successive ensonifications were extracted and strung together to form this sequence. Echo amplitude is modulated by wingbeats, largely due to a wing moving into a posture perpendicular to the incident sound and creating a specular reflection with a flat spectrum. At other orientations, the weaker wing reflections bring up the glint reflections from other moth body parts so that interference becomes stronger and spectral nulls (red arrows) are more obvious (echoes 15–18). (B) 3D SCAT plots for echoes 14–18 from A. Three of the ten threshold crossings (#2 to #4) are displayed on X-Y plane, marked in dark blue (left) to light blue (right), respectively. For echoes that contain prominent notches, the triangular network finds and displays glint delays that change according to the wingbeats to portray the acoustic version of target shape.

Similar articles

Cited by

References

    1. Griffin DR. Listening in the dark. New Haven: Yale University Press; 1958.
    1. Neuweiler G. Biology of bats. Oxford: Oxford University Press; 2000.
    1. Au WWL. The sonar of dolphins. New York: Springer; 1993.
    1. Thomas JA, Moss CF, Vater M, editors. Echolocation in bats and dolphins. Chicago: Univ. of Chicago Press; 2004.
    1. Surlykke A, Nachtigall PE, Fay RR, Popper AN, editors. Biosonar. New York: Springer; 2014.

Publication types

LinkOut - more resources