. 2021 Feb 17;16(2):e0229703.
doi: 10.1371/journal.pone.0229703. eCollection 2021.

Long-term changes in kelp forests in an inner basin of the Salish Sea

Affiliations

Long-term changes in kelp forests in an inner basin of the Salish Sea

Helen D Berry et al. PLoS One. .

Abstract

Kelp forests form an important biogenic habitat that responds to natural and human drivers. Global concerns exist about threats to kelp forests, yet long-term information is limited and research suggests that trends are geographically distinct. We examined distribution of the bull kelp Nereocystis luetkeana over 145 years in South Puget Sound (SPS), a semi-protected inner basin in a fjord estuary complex in the northeast Pacific Ocean. We synthesized 48 historical and modern Nereocystis surveys and examined presence/absence within 1-km segments along 452 km of shoreline. Compared to the earliest baseline in 1878, Nereocystis extent in 2017 decreased 63%, with individual sub-basins showing up to 96% loss. Losses have persisted for decades, across a range of climate conditions. In recent decades, Nereocystis predominantly occurred along shorelines with intense currents and mixing, where temperature and nutrient concentrations did not reach thresholds for impacts to Nereocystis performance, and high current speeds likely excluded grazers. Losses predominated in areas with elevated temperature, lower nutrient concentrations, and relatively low current velocities. The pattern of long-term losses in SPS contrasts with stability in floating kelp abundance during the last century in an area of the Salish Sea with greater wave exposure and proximity to oceanic conditions. These findings support the hypothesis that kelp beds along wave-sheltered shorelines exhibit greater sensitivity to environmental stressors. Additionally, shorelines with strong currents and deep-water mixing may provide refugia within sheltered systems.


Conflict of interest statement

The authors have declared that no competing interests exist.

Figures
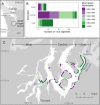
Fig 1
Fig 1. Most recent observation of Nereocystis presence along shorelines in South Puget Sound (SPS) between 1873 and 2018.
(A) The location of SPS, the southern terminus of the Salish Sea. (B) Bar charts show the most recent year Nereocystis was present in 1-km segments within each sub-basin. Years were binned into 20-year increments, with two bins excluded due to lack of data. (C) The -6.1 m bathymetric contour line denotes all shorelines where Nereocystis occurrence was assessed, classified by the most recent observation of presence (same legend as in B). The gray line denotes absence throughout the time period. The general location of three sub-basins (West, Central and East) is defined at the top of the map, and dotted gray lines on the map identify precise boundaries. Map image based on publicly available data from the Washington State Department of Natural Resources.
Fig 2
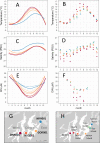
Fig 2. Monthly water characteristics at mid-channel long-term monitoring stations (left) and nearshore stations (right).
(A, B) mean water temperature to 5 m depth. (C, D) mean salinity to 5 m depth. (E) DIN concentration at mid-channel stations at depths of 0 m (solid line) and 10 m (dashed line). (F) DIN concentration at nearshore stations at depths of 0.25 m (point) and 4 m (triangle), with data slightly offset horizontally for visibility. Site locations for (G) mid-channel stations and (H) nearshore stations. Mid-channel long-term monitoring station data (left) represent a cubic spline curve fit to mean values from more than 2 decades of sampling for all stations except NRR001 (3 years). Nearshore stations (right) were sampled monthly at -6.1 m (MLLW) between September 2017 and August 2018. Map image based on publicly available data from the Washington State Department of Natural Resources.
Fig 3
Fig 3
Distribution of Nereocystis persistence at 1-km segments (A) before 1980 and (B) after 1980. Persistence was calculated as the proportion of all observations in each segment with Nereocystis present within each time period. All 1-km segments where Nereocystis occurred at least once in either time period were included (n = 120).
Fig 4
Fig 4. Nereocystis extent between 1878 and 2017 in SPS.
(A) Number of 1-km segments with Nereocystis present, based on seven comprehensive snapshot surveys, summarized over three sub-basins. Recent estimates (1999, 2013 and 2017) are dramatically reduced relative to estimates in 1878, 1935 and 1978. The 1911 estimate could represent a low point in kelp extent, but likely reflects methodological differences in survey methods (commercial beds). (B) Time series of the Ensemble Oceanic Niño Index (ENS ONI) [111]. Gray shading indicate years of synoptic snapshot data collection (some spanned multiple years). Black points identify mean ENS ONI values during the growing season in the year of kelp surveys for synoptic snapshots. Gray circles are scaled to represent the percentage of all segments surveyed for a synoptic snapshot during individual years.
Fig 5
Fig 5. Current and wave exposure at 1-km segments with Nereocystis.
The annual mean of maximum daily current velocity (y-axis) was derived from a 2014 model run of the Salish Sea Model [110, 111]. Average annual maximum wave height (x-axis) was modeled between 1950 to 2010 by the Washington Coastal Resilience Project [112]. 1-km kelp segments are coded by sub-basin and the most recent year that Nereocystis was observed (n = 120).

Similar articles

Cited by

References

    1. Anecdotes Pauly D. and the shifting baseline syndrome of fisheries. Trends in Ecology & Evolution. 1995;10(10):1 10.1016/s0169-5347(00)89171-5 - DOI - PubMed
    1. Graham HM. Effects of local deforestation on the diversity and structure of southern California giant kelp forest food webs. Ecosystems. 2004;7(4):341–57.
    1. Pratchett MS, Hoey A, Wilson S. Reef degradation and the loss of critical ecosystem goods and services provided by coral reef fishes. Current Opinion in Environmental Sustainability. 2014;7:37–43.
    1. Steneck RS, Graham MH, Bourque BJ, Corbett D, Erlandson JM, Estes JA, et al. Kelp forest ecosystems: biodiversity, stability, resilience and future. Environmental Conservation. 2002;29(04):436–59. 10.1017/S0376892902000322 - DOI
    1. Wernberg T, Krumhansl K, Filbee-Dexter K, Pedersen MF. Chapter 3—Status and Trends for the World’s Kelp Forests In: Sheppard C, editor. World Seas: an Environmental Evaluation (Second Edition): Academic Press; 2019. p. 57–78.

Publication types

LinkOut - more resources