

Examining the role of olfaction in dietary choice
- PMID: 33596417
- PMCID: PMC8864488
- DOI: 10.1016/j.celrep.2021.108755
Examining the role of olfaction in dietary choice
Abstract
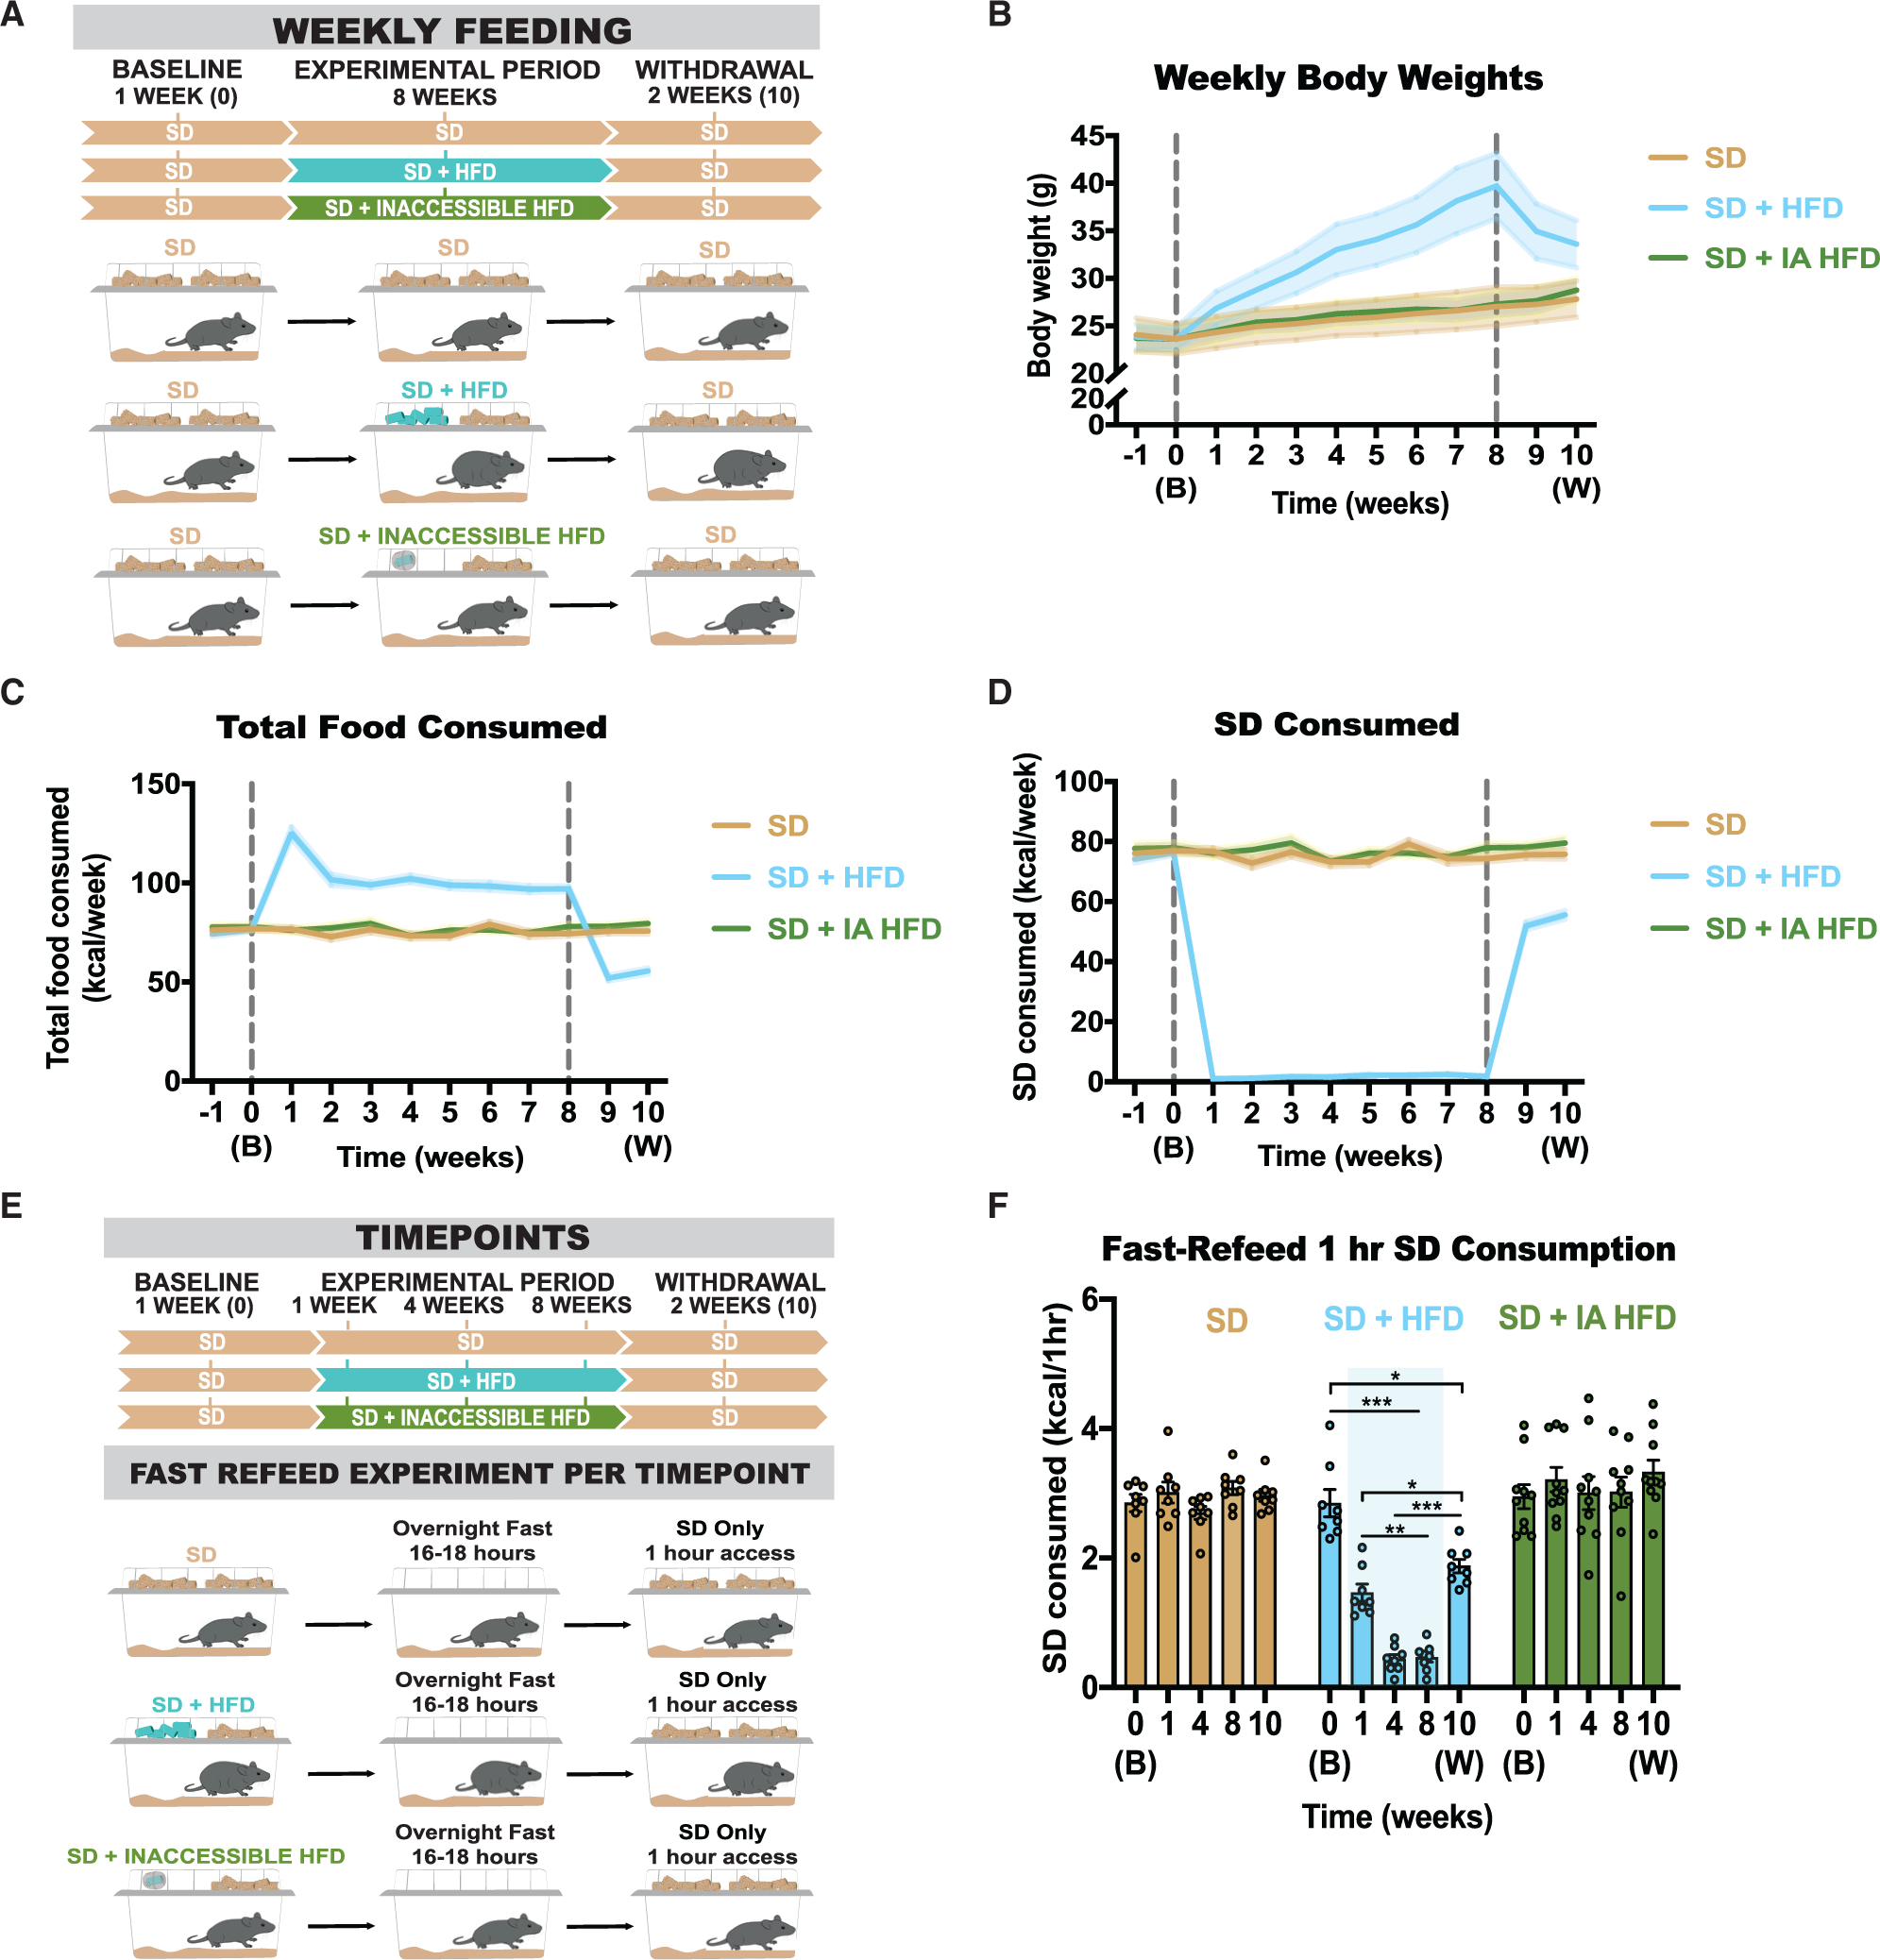
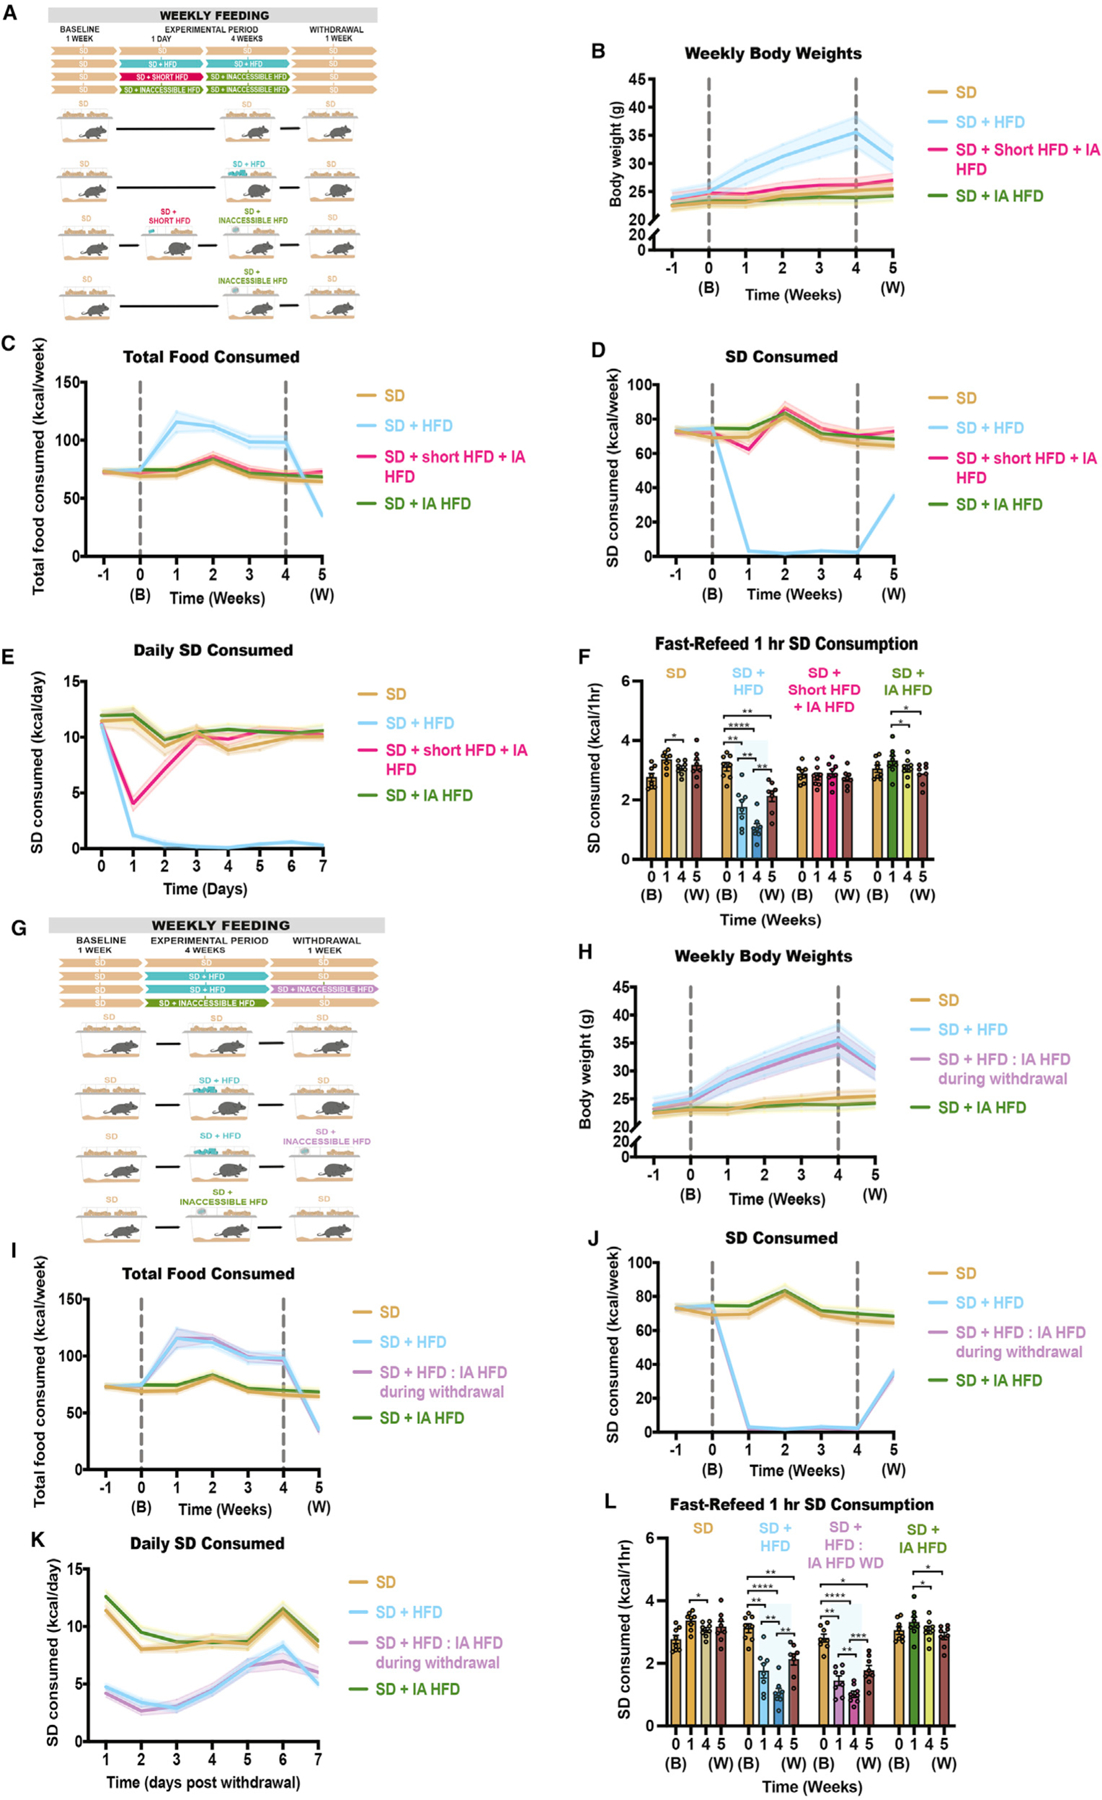
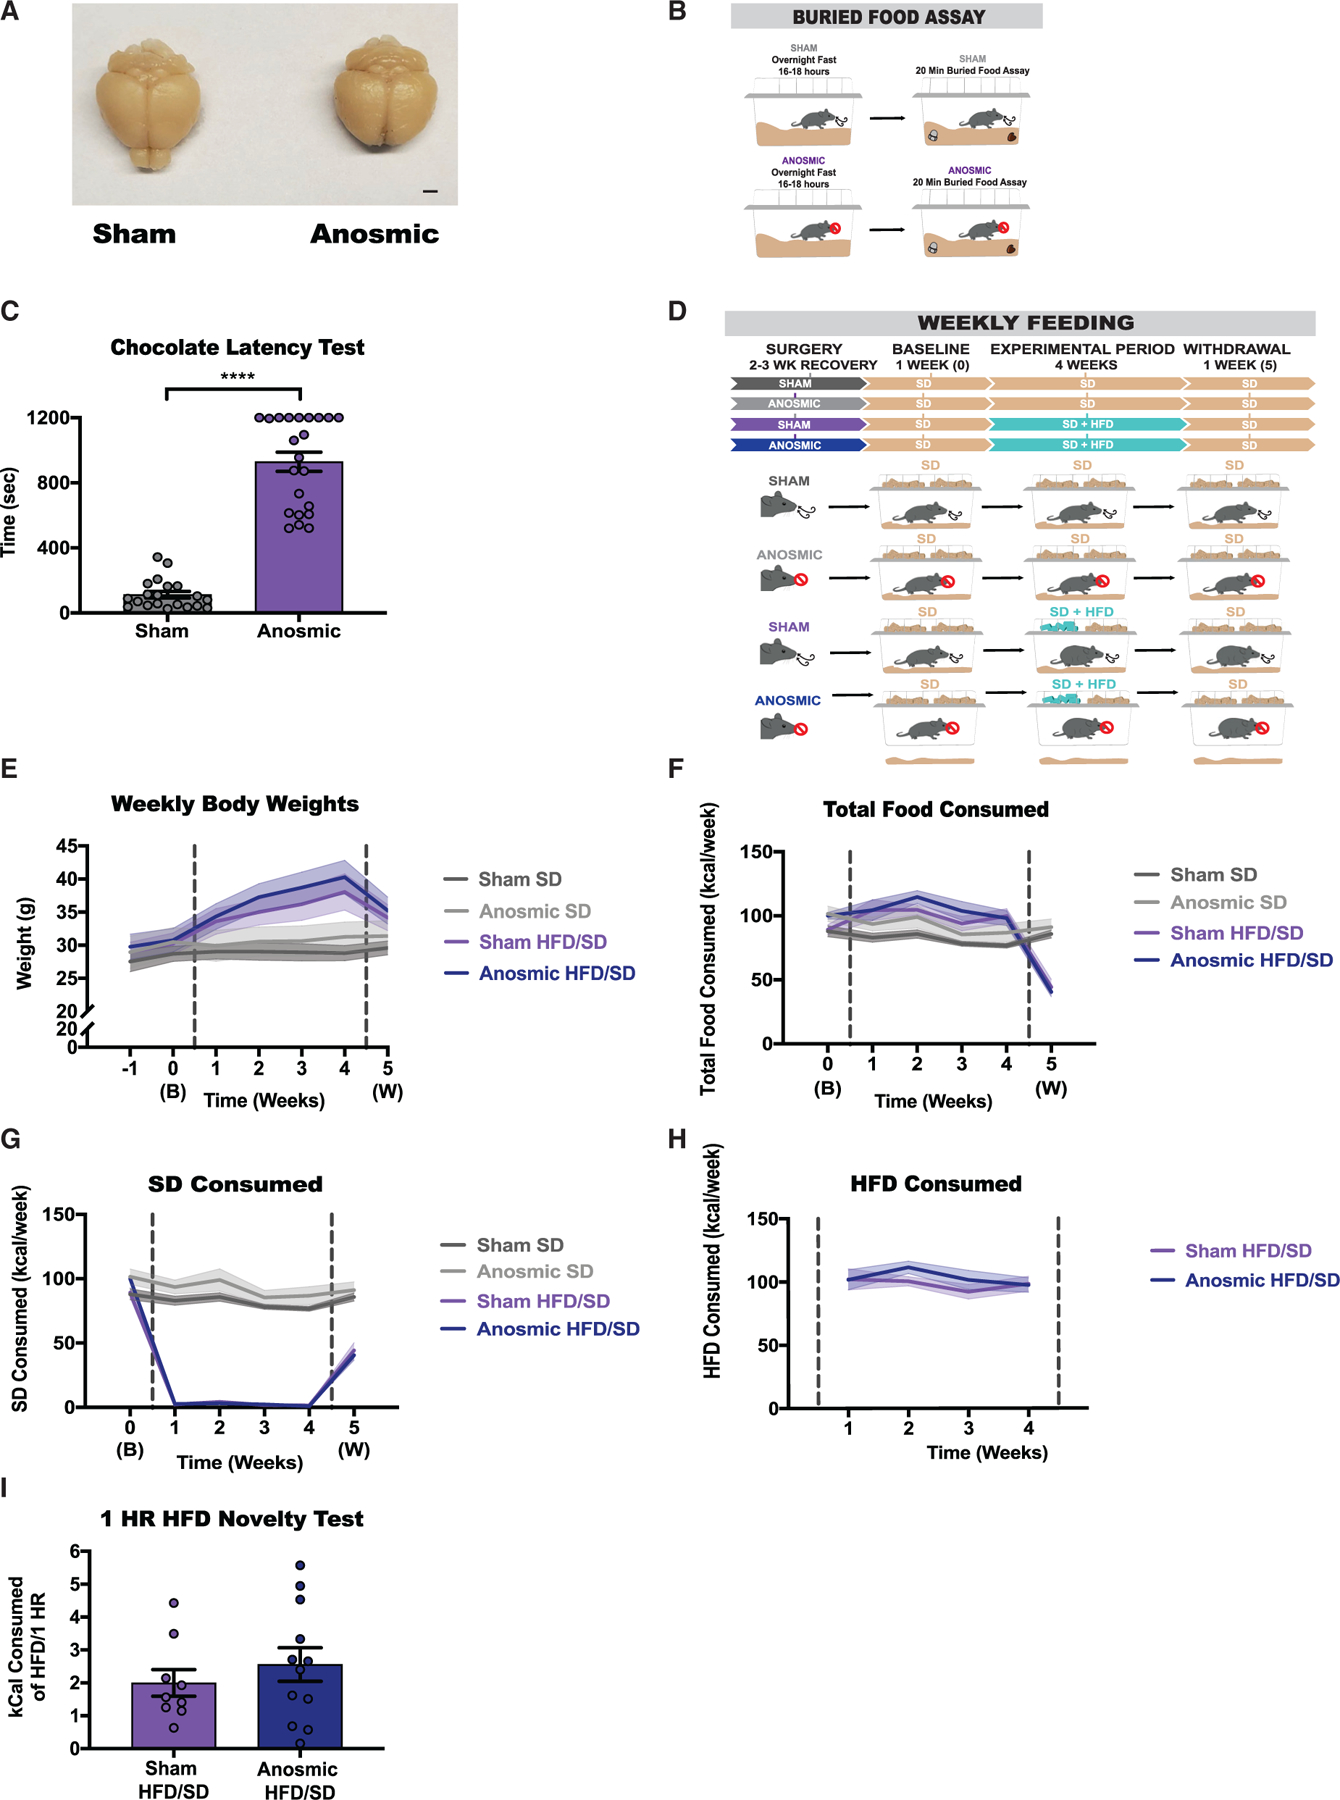
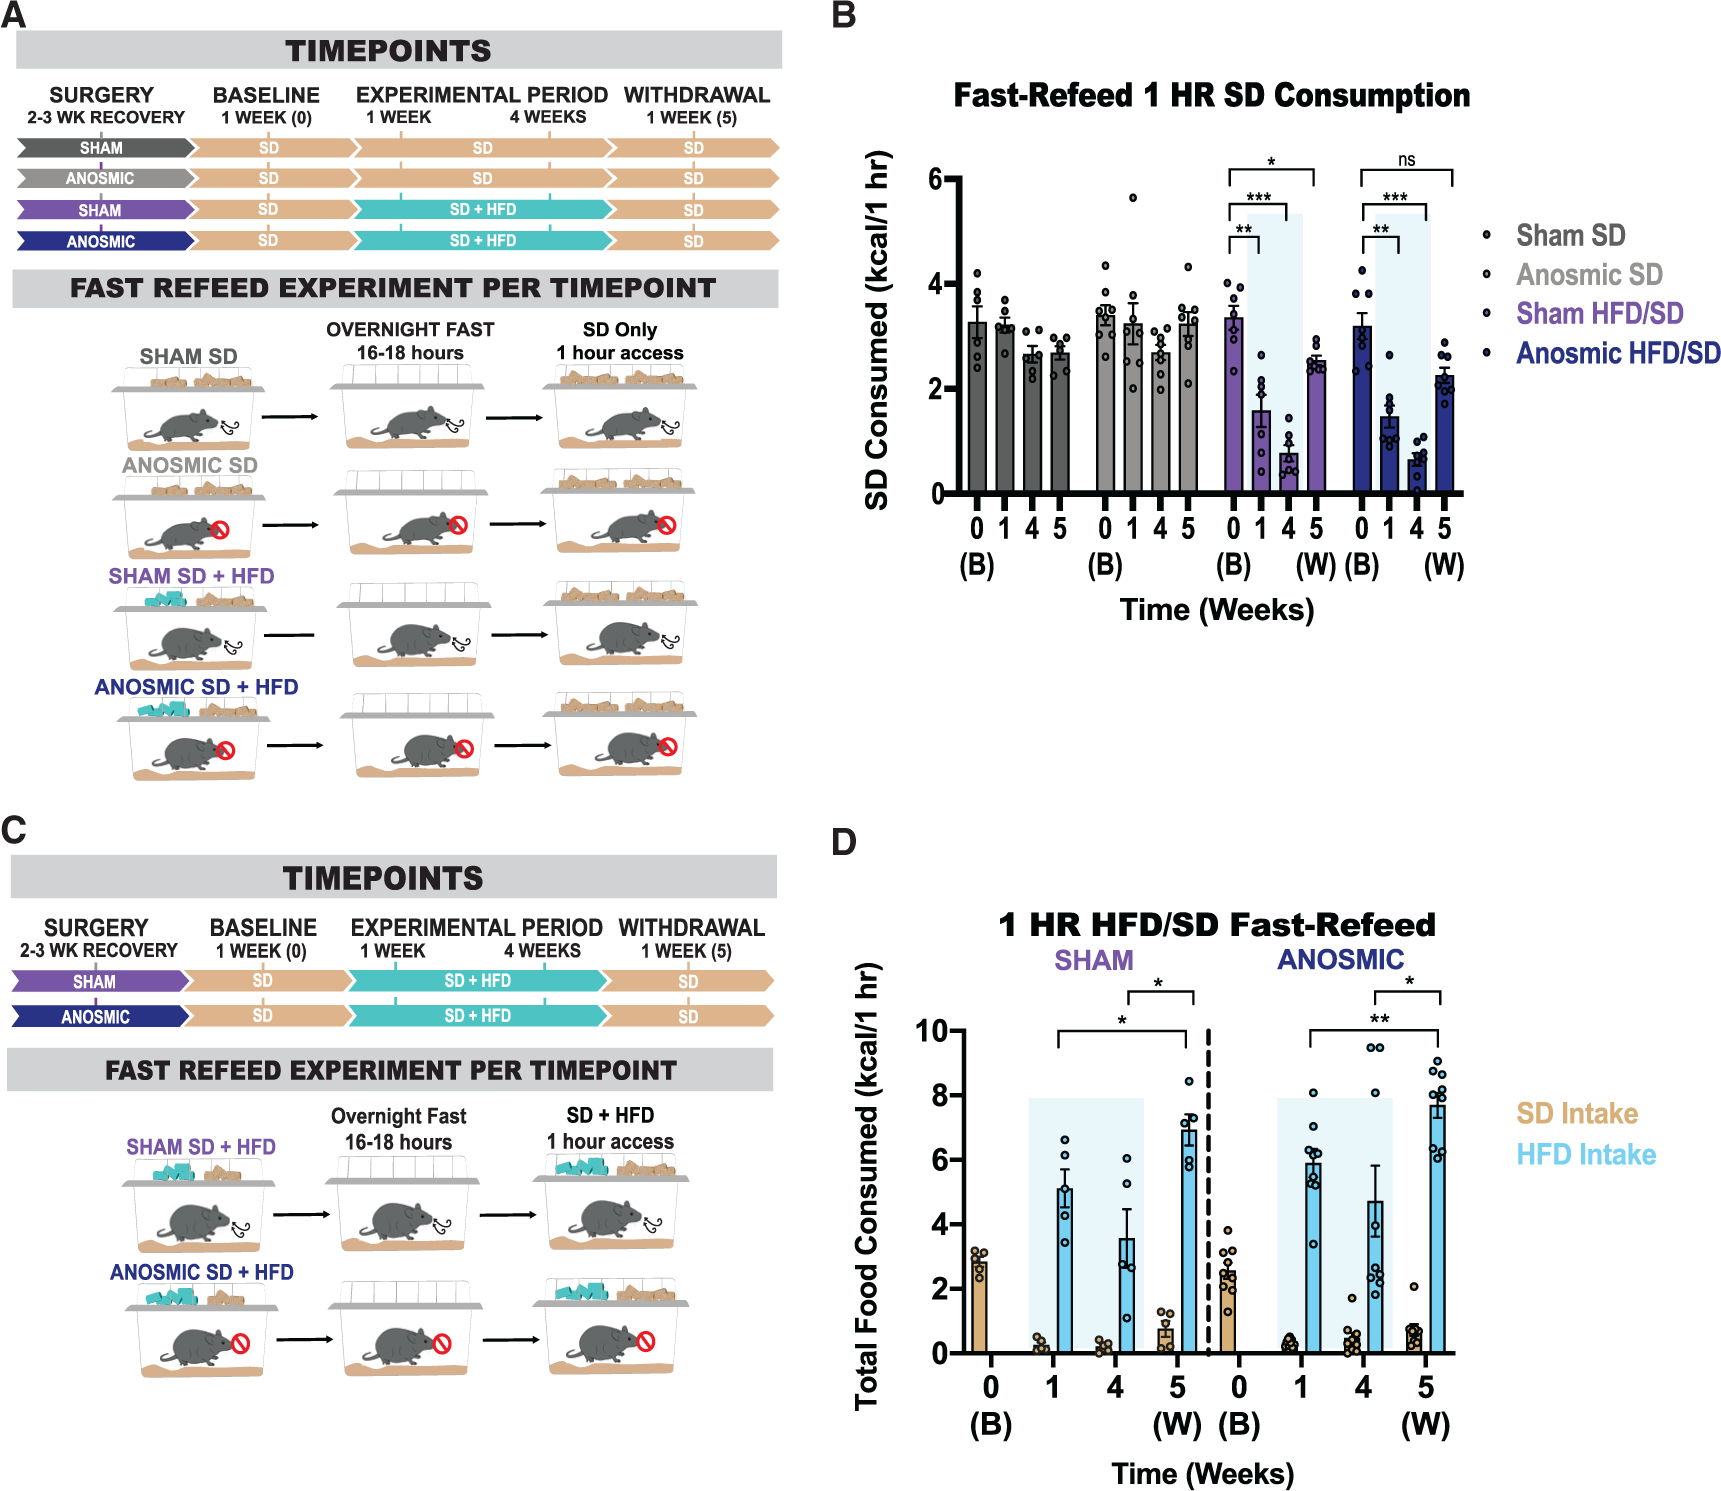
Obesity is frequently caused by calorie-rich dietary choices across the animal kingdom. As prandial preference toward a high-fat diet develops in mice, an anti-preference or devaluation of a nutritionally balanced but less palatable standard chow diet occurs concomitantly. Although mechanistic insights underlying devaluation have been observed physiologically in the brain, it is unclear how peripheral sensory processing affects food choice. Because olfactory cues and odor perception help coordinate food preference and intake, we determine the role of smell in the targeted consumption of a high-fat diet and simultaneous devaluation of a standard chow diet. Using inaccessible food and loss-of-function manipulations, we find that olfactory information is neither sufficient nor necessary for both the acute and chronic selection of high-fat diet and coincident diminished value of standard diet. This work suggests alternative means are behind the immediate and sustained consumption of high-fat diet and concurrent standard diet devaluation.
Keywords: anosmia; devaluation; high-fat diet; obesity; olfaction.
Published by Elsevier Inc.
Conflict of interest statement
Declaration of interests The authors declare no conflicts of interest in association with the results of this paper.
Figures
Similar articles
-
Dietary fat content and absorption shape standard diet devaluation through hunger circuits.Mol Metab. 2024 Nov;89:102021. doi: 10.1016/j.molmet.2024.102021. Epub 2024 Aug 30. Mol Metab. 2024. PMID: 39216534 Free PMC article.
-
Short-term consumption of highly processed diets varying in macronutrient content impair the sense of smell and brain metabolism in mice.Mol Metab. 2024 Jan;79:101837. doi: 10.1016/j.molmet.2023.101837. Epub 2023 Nov 17. Mol Metab. 2024. PMID: 37977411 Free PMC article.
-
Hyperlipidemic diet causes loss of olfactory sensory neurons, reduces olfactory discrimination, and disrupts odor-reversal learning.J Neurosci. 2014 May 14;34(20):6970-84. doi: 10.1523/JNEUROSCI.3366-13.2014. J Neurosci. 2014. PMID: 24828650 Free PMC article.
-
Stressing the importance of choice: Validity of a preclinical free-choice high-caloric diet paradigm to model behavioural, physiological and molecular adaptations during human diet-induced obesity and metabolic dysfunction.J Neuroendocrinol. 2019 May;31(5):e12718. doi: 10.1111/jne.12718. Epub 2019 Apr 24. J Neuroendocrinol. 2019. PMID: 30958590 Free PMC article. Review.
-
Psychobiology of food preferences.Int J Obes Relat Metab Disord. 2001 Dec;25 Suppl 5:S13-6. doi: 10.1038/sj.ijo.0801905. Int J Obes Relat Metab Disord. 2001. PMID: 11840208 Review.
Cited by
-
Progress in the Development of Detection Strategies Based on Olfactory and Gustatory Biomimetic Biosensors.Biosensors (Basel). 2022 Oct 11;12(10):858. doi: 10.3390/bios12100858. Biosensors (Basel). 2022. PMID: 36290995 Free PMC article. Review.
-
Olfactory function in diabetes mellitus.J Clin Transl Endocrinol. 2024 Mar 30;36:100342. doi: 10.1016/j.jcte.2024.100342. eCollection 2024 Jun. J Clin Transl Endocrinol. 2024. PMID: 38585386 Free PMC article. Review.
-
Acute Fasting Modulates Food-Seeking Behavior and Neural Signaling in the Piriform Cortex.Nutrients. 2022 Oct 6;14(19):4156. doi: 10.3390/nu14194156. Nutrients. 2022. PMID: 36235808 Free PMC article.
-
Post-oral sensing of fat increases food intake and attenuates body weight defense.Cell Rep. 2021 Oct 19;37(3):109845. doi: 10.1016/j.celrep.2021.109845. Cell Rep. 2021. PMID: 34686319 Free PMC article.
-
A systematic review of the biological mediators of fat taste and smell.Physiol Rev. 2023 Jan 1;103(1):855-918. doi: 10.1152/physrev.00061.2021. Epub 2022 Sep 15. Physiol Rev. 2023. PMID: 36409650 Free PMC article.
References
-
- Aimé P, Duchamp-Viret P, Chaput MA, Savigner A, Mahfouz M, and Julliard AK (2007). Fasting increases and satiation decreases olfactory detection for a neutral odor in rats. Behav. Brain Res. 179, 258–264. - PubMed
-
- Alberts JR, and Friedman MI (1972). Olfactory bulb removal but not anosmia increases emotionality and mouse killing. Nature 238, 454–455. - PubMed
-
- Albrecht J, Schreder T, Kleemann AM, Schöpf V, Kopietz R, Anzinger A, Demmel M, Linn J, Kettenmann B, and Wiesmann M (2009). Olfactory detection thresholds and pleasantness of a food-related and a non-food odour in hunger and satiety. Rhinology 47, 160–165. - PubMed
Publication types
MeSH terms
Grants and funding
LinkOut - more resources
Full Text Sources
Other Literature Sources
Medical
Research Materials
