. 2021 Feb 16;34(7):108752.
doi: 10.1016/j.celrep.2021.108752.

An mTORC1-dependent switch orchestrates the transition between mouse spermatogonial stem cells and clones of progenitor spermatogonia

Affiliations

An mTORC1-dependent switch orchestrates the transition between mouse spermatogonial stem cells and clones of progenitor spermatogonia

Shinnosuke Suzuki et al. Cell Rep. .

Abstract

Spermatogonial stem cells (SSCs) sustain spermatogenesis by balancing self-renewal and initiation of differentiation to produce progenitor spermatogonia committed to forming sperm. To define the regulatory logic among SSCs and progenitors, we performed single-cell RNA velocity analyses and validated results in vivo. A predominant quiescent SSC population spawns a small subset of cell-cycle-activated SSCs via mitogen-activated protein kinase (MAPK)/AKT signaling. Activated SSCs form early progenitors and mTORC1 inhibition drives activated SSC accumulation consistent with blockade to progenitor formation. Mechanistically, mTORC1 inhibition suppresses transcription among spermatogonia and specifically alters expression of insulin growth factor (IGF) signaling in early progenitors. Tex14-/- testes lacking intercellular bridges do not accumulate activated SSCs following mTORC1 inhibition, indicating that steady-state mTORC1 signaling drives activated SSCs to produce progenitor clones. These results are consistent with a model of SSC self-renewal dependent on interconversion between activated and quiescent SSCs, and mTORC1-dependent initiation of differentiation from SSCs to progenitor clones.

Keywords: RNA velocity; cell fate; single cell; spermatogenesis; subpopulations; testis; undifferentiated spermatogonia.


Conflict of interest statement

Declaration of interests The authors declare no competing interests.

Figures
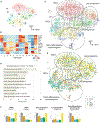
Figure 1.
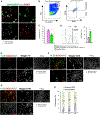
Figure 1.. RNA velocity analysis predicts heterogeneous cell-cycle states and fate among adult SSCs and progenitors
(A) RNA velocity clustering of individual adult ID4-EGFPBright spermatogonia projected onto a t-distributed stochastic neighbor embedding (tSNE) plot. Clusters are color coded and numbered. (B) Heatmap of marker gene expression collapsed from each cluster, with mRNA levels according to the Z score scale. (C) RNA velocity vector fields indicate the observed (dots) and extrapolated future (arrows) states of adult ID4-EGFPBright spermatogonia. Cell types are noted with dashed ovals and labels. (D) GO analysis of differentially expressed genes (DEGs) (Table S1) in SSCs from cluster 7 versus cluster 1. (E) Cell-cycle phase analysis of adult ID4-EGFPBright spermatogonia. (F) Proportion of cells in each cell-cycle phase grouping for clusters 1, 7, 5, 2/6, and 3/9/11.
Figure 2.
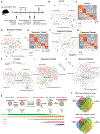
Figure 2.. Cell-cycle-activated and quiescent SSCs are present throughout the cycle of the seminiferous epithelium in vivo
(A) Whole-mount immunofluorescence (WM-IIF) of SOX3 (white) and Ki67 (red), together with ID4-EGFP epifluorescence (green) in seminiferous tubules from adult Id4-Egfp mice. Scale bar, 20 μm. Arrowhead, quiescent SSCs (ID4-EGFPBright/SOX3−/Ki67−); asterisk, late progenitors (ID4-EGFPDim/SOX3+/Ki67−). (B) Flow cytometry analysis of adult Id4-Egfp mouse seminiferous tubule cells sequentially gated for SSC-enriched CD9Bright/ID4-EGFPBright spermatogonia (left) and SOX3 and RARγ staining (right). Figure S3H shows negative controls. (C) Quadrant statistics from the right panel of (B). Data are mean ± SEM (n = 3 adult Id4-Egfp mice). (D) Quantification of Ki67 staining intensity in cells from (B) grouped by ID4-EGFPBright/SOX3low/RARγlow (SSCs) or ID4-EGFPBright/SOX3high/RARγlow (early progenitors). Data are mean ± SEM. Two-tailed Student’s t test (**p < 0.01). (E–G) WM-IIF of PLZF (green), SOX3 (red), Ki67 (white), and peanut agglutinin (PNA) in adult C57BL/6 mice (n = 4). Scale bar, 20 μm. Arrowhead, quiescent SSCs (PLZF+/SOX3−/Ki67−); arrow, activated SSCs (PLZF+/SOX3−/Ki67+). (H) Proportion of quiescent SSCs and activated SSCs in each stage from (E) and (F). Data are mean ± SEM. The proportion of Ki67+ SSCs was not significantly different according to ANOVA (p = 0.093).
Figure 3.
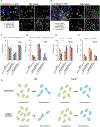
Figure 3.. Signaling pathways that regulate transitions in cell state among mouse SSCs and progenitors
(A–C) Phosphorylated MAPK (phospho-MAPK) (A), phosphorylated AKT (phospho-AKT) (B), and p-RPS6 (C) levels in isolated seminiferous tubule cells from adult Id4-Egfp mice gated for quiescent SSCs (ID4-EGFPBright/SOX3low/Ki67low, orange), activated SSCs (ID4-EGFPBright/SOX3low/Ki67high, green), and early progenitors (ID4-EGFPBright/SOX3high, red) compared with unstained negative control cells (gray). Gating controls are in Figure S3H. (D) Quantification of flow cytometry from (A)–(C) (n = 3 adult Id4-Egfp mice). Dot size, proportion of undifferentiated spermatogonia; color, percentage that are marker positive. (E) WM-IIF of PLZF (green, spermatogonia), p-RPS6 (red, mTORC1 activity), SOX3 (white, early/late progenitors), and Ki67 (blue, proliferation) in adult C57BL/6 mice. Arrowhead, quiescent SSCs (PLZF+/SOX3−/Ki67−); circle, early progenitors (PLZF+/SOX3+/Ki67+). Scale bar, 20 μm. (F) Quantification of p-RPS6 levels in quiescent SSCs (ID4-EGFPBright/SOX3low/Ki67low), activated SSCs (ID4-EGFPBright/SOX3low/Ki67high), and early progenitors (ID4-EGFPBright/SOX3high) in untreated and rapamycin-treated adult Id4-Egfp mice (n = 3 adult Id4-Egfp mice). Dot size, proportion of undifferentiated spermatogonia; color, percentage marker positive. (G) Proportion of SSCs (KIT−/PLZFlow/SOX3low/RARγlow), early progenitors (KIT−/PLZFlow/SOX3high/RARγlow), and late progenitors (KIT−/PLZFhigh/SOX3high/RARγhigh) in untreated and rapamycin-treated adult C57BL/6 mice (see controls in Figure S3J). Data are mean ± SEM. Two-tailed Student’s t test (*p < 0.05, **p < 0.01, and ***p < 0.001). (H) Quantification of flow cytometry analysis of Ki67 levels in untreated (n = 3) and rapamycin-treated (n = 3) adult C57BL/6 mice gated for SSCs (KIT−/PLZFlow/SOX3low/RARγlow), early progenitors (KIT−/PLZFlow/SOX3high/RARγlow), and late progenitors (KIT−/PLZFhigh/SOX3high/RARγhigh). Gating controls are in Figure S3J. Data are mean ± SEM. Two-tailed Student’s t test (*p < 0.05 and **p < 0.01).
Figure 4.
Figure 4.. mTORC1 signaling regulates the balance between SSC self-renewal and commitment to spermatogonial differentiation
(A) Experimental design cartoon. Blue arrowheads indicate rapamycin treatments, and black arrows indicate analysis points. (B–G) RNA velocity clustering of adult ID4-EGFPBright spermatogonia from (B) untreated control mice, (D) day 2 rapamycin-treated mice, or (F) day 3 rapamycin-release mice (1 day washout of rapamycin). Clusters are color coded and numbered. Dotted ovals denote quiescent SSCs, activated SSC, early progenitors, late progenitors, and differentiating spermatogonia. (C, E, and G) Heatmaps depict cell-type-specific DEGs defined in Figure S1I. (C) Untreated control mice. (E) Day 2 rapamycin-treated mice. (G) Day 3 rapamycin-release mice. See Figure S5. (H–J) RNA velocity vector fields indicate the observed (dots) and extrapolated future states (arrows) in spermatogonia from (H) control, (I) rapamycin-treated, or (J) rapamycin-release testes. (K) Model showing MAPK/AKT signaling activation associated with the interconversion between quiescent SSCs and activated SSCs, and an mTORC1-dependent switch promoting a reversible transition from activated SSCs to SOX3high/RARγlow early progenitors. Retinoic acid (RA) enhances the proliferation of early progenitors, and acquisition of a SOX3high/RARγhigh late progenitor phenotype coincides with exit from the cell cycle. RA stimulates late progenitors to produce KIT-positive differentiating spermatogonia. (L) Venn diagram depicting the overlap of downregulated genes (above) and upregulated genes (below) in rapamycin-treated spermatogonial populations. *, DEGs downregulated in all rapamycin-treated spermatogonia; ‡, unique DEGs downregulated in rapamycin-treated quiescent SSCs; †, unique DEGs downregulated in rapamycin-treated activated SSCs; @, unique DEGs downregulated in rapamycin-treated early progenitors; #, unique DEGs downregulated in rapamycin-treated late progenitors.
Figure 5.
Figure 5.. mTORC1 inhibition fails to drive activated SSC accumulation and early progenitor depletion in the absence of intercellular bridges
(A and B) WM-IIF of PLZF (green, spermatogonia), RARγ (red, late progenitors), SOX3 (white, early/late progenitors) or KIT (white, differentiating spermatogonia), and Ki67 (blue, proliferation) in seminiferous tubules from P36 Tex14−/− mice. Arrowhead, quiescent SSCs (PLZF+/SOX3−/RARγ/Ki67−) or early progenitors (PLZF+/KIT−/RARγ−/Ki67−); arrow, activated SSCs (PLZF+/SOX3−/RARγ−/Ki67+) or early progenitors (PLZF+/KIT−/RARγ−/Ki67+); circle, early progenitors (PLZF+/SOX3+/RARγ−/Ki67+); asterisk, late progenitors (PLZF+/SOX3+ or KIT−/RARγ+/Ki67−). Scale bar, 20 μm. (C) Proportion of SSCs (KIT−/PLZFlow/SOX3low/RARγlow), early progenitors (KIT−/PLZFlow/SOX3high/RARγlow), and late progenitors (KIT−/PLZFhigh/SOX3high/RARγhigh) in seminiferous tubule cells from control (n = 3) and rapamycin-treated (n = 3) Tex14−/− mice at P36 (see controls in Figure S3J). Data are mean ± SEM. (D) Ki67 staining intensity in SSCs (KIT−/PLZFlow/SOX3low/RARγlow), early progenitors (KIT−/PLZFlow/SOX3high/RARγlow), and late progenitors (KIT−/PLZFhigh/SOX3high/RARγhigh) in seminiferous tubule cells from Tex14+/−, Tex14−/−, and rapamycin-treated Tex14−/− mice (n = 3 each) at P36 (see controls in Figure S3J). Data are mean ± SEM. Two-tailed Student’s t test (***p < 0.001). (E) Proportion of SSCs (KIT−/PLZFlow/SOX3low/RARγlow), early progenitors (KIT−/PLZFlow/SOX3high/RARγlow), and late progenitors (KIT−/PLZFhigh/SOX3high/RARγhigh) in seminiferous tubule cells from adult control (n = 3) and rapamycin-treated (n = 3) Tex14−/− mice (see controls in Figure S3J). Data are mean ± SEM. Two-tailed Student’s t test (***p < 0.001). (F) Ki67 staining intensity in SSCs (KIT−/PLZFlow/SOX3low/RARγlow), early progenitors (KIT−/PLZFlow/SOX3high/RARγlow), and late progenitors (KIT−/PLZFhigh/SOX3high/RARγhigh) in seminiferous tubule cells from adult (>60 days) control (n = 3) and rapamycin-treated (n = 3) Tex14−/− mice (see controls in Figure S3J. Data are mean ± SEM. Two-tailed Student’s t test (***p < 0.001). (G) Model positing that the transition between activated SSCs and clones of early progenitors is dependent upon mTORC1 activity.

References

    1. Allard JB, and Duan C (2018). IGF-Binding Proteins: Why Do They Exist and Why Are There So Many? Front. Endocrinol. (Lausanne) 9, 117. - PMC - PubMed
    1. Bergen V, Lange M, Peidli S, Wolf FA, and Theis FJ (2020). Generalizing RNA velocity to transient cell states through dynamical modeling. Nat. Biotechnol 38, 1408–1414. 10.1038/s41587-020-0591-3. - DOI - PubMed
    1. Busada JT, Chappell VA, Niedenberger BA, Kaye EP, Keiper BD, Hogarth CA, and Geyer CB (2015a). Retinoic acid regulates Kit translation during spermatogonial differentiation in the mouse. Dev. Biol 397, 140–149. - PMC - PubMed
    1. Busada JT, Niedenberger BA, Velte EK, Keiper BD, and Geyer CB (2015b). Mammalian target of rapamycin complex 1 (mTORC1) Is required for mouse spermatogonial differentiation in vivo. Dev. Biol 407, 90–102. - PMC - PubMed
    1. Chan F, Oatley MJ, Kaucher AV, Yang QE, Bieberich CJ, Shashikant CS, and Oatley JM (2014). Functional and molecular features of the Id4+ germline stem cell population in mouse testes. Genes Dev. 28, 1351–1362. - PMC - PubMed

Publication types

Substances