

Synthetic dual-energy CT for MRI-only based proton therapy treatment planning using label-GAN
- PMID: 33596558
- PMCID: PMC11738296
- DOI: 10.1088/1361-6560/abe736
Synthetic dual-energy CT for MRI-only based proton therapy treatment planning using label-GAN
Abstract
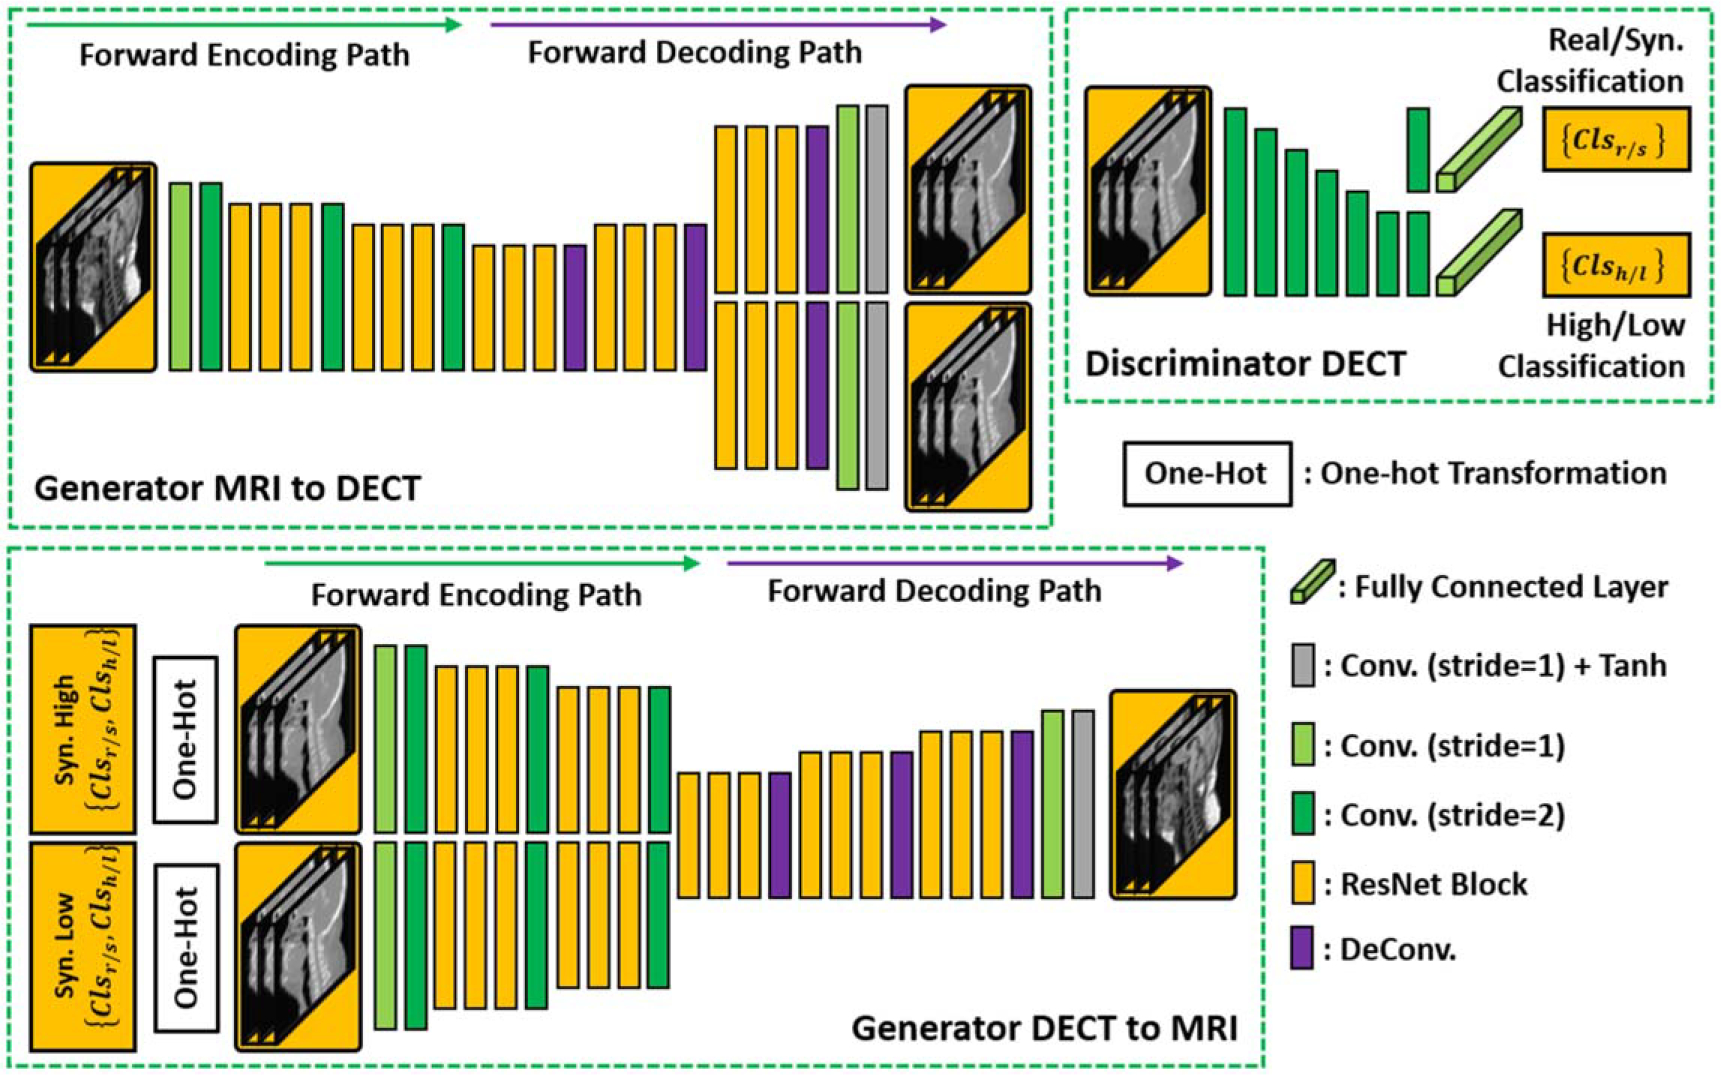
MRI-only treatment planning is highly desirable in the current proton radiation therapy workflow due to its appealing advantages such as bypassing MR-CT co-registration, avoiding x-ray CT exposure dose and reduced medical cost. However, MRI alone cannot provide stopping power ratio (SPR) information for dose calculations. Given that dual energy CT (DECT) can estimate SPR with higher accuracy than conventional single energy CT, we propose a deep learning-based method in this study to generate synthetic DECT (sDECT) from MRI to calculate SPR. Since the contrast difference between high-energy and low-energy CT (LECT) is important, and in order to accurately model this difference, we propose a novel label generative adversarial network-based model which can not only discriminate the realism of sDECT but also differentiate high-energy CT (HECT) and LECT from DECT. A cohort of 57 head-and-neck cancer patients with DECT and MRI pairs were used to validate the performance of the proposed framework. The results of sDECT and its derived SPR maps were compared with clinical DECT and the corresponding SPR, respectively. The mean absolute error for synthetic LECT and HECT were 79.98 ± 18.11 HU and 80.15 ± 16.27 HU, respectively. The corresponding SPR maps generated from sDECT showed a normalized mean absolute error as 5.22% ± 1.23%. By comparing with the traditional Cycle GANs, our proposed method significantly improves the accuracy of sDECT. The results indicate that on our dataset, the sDECT image form MRI is close to planning DECT, and thus shows promising potential for generating SPR maps for proton therapy.
Conflict of interest statement
Disclosures
The authors declare no conflicts of interest.
Figures


Similar articles
-
Learning-based synthetic dual energy CT imaging from single energy CT for stopping power ratio calculation in proton radiation therapy.Br J Radiol. 2022 Jan 1;95(1129):20210644. doi: 10.1259/bjr.20210644. Epub 2021 Oct 28. Br J Radiol. 2022. PMID: 34709948 Free PMC article.
-
Dosimetric comparison of stopping power calibration with dual-energy CT and single-energy CT in proton therapy treatment planning.Med Phys. 2016 Jun;43(6):2845-2854. doi: 10.1118/1.4948683. Med Phys. 2016. PMID: 27277033
-
MRI-only based material mass density and relative stopping power estimation via deep learning for proton therapy: a preliminary study.Sci Rep. 2024 May 15;14(1):11166. doi: 10.1038/s41598-024-61869-8. Sci Rep. 2024. PMID: 38750148 Free PMC article.
-
Comparison of proton therapy treatment planning for head tumors with a pencil beam algorithm on dual and single energy CT images.Med Phys. 2016 Jan;43(1):495. doi: 10.1118/1.4939106. Med Phys. 2016. PMID: 26745942
-
MRI-based treatment planning for proton radiotherapy: dosimetric validation of a deep learning-based liver synthetic CT generation method.Phys Med Biol. 2019 Jul 16;64(14):145015. doi: 10.1088/1361-6560/ab25bc. Phys Med Biol. 2019. PMID: 31146267 Free PMC article.
Cited by
-
Deep learning in MRI-guided radiation therapy: A systematic review.J Appl Clin Med Phys. 2024 Feb;25(2):e14155. doi: 10.1002/acm2.14155. Epub 2023 Sep 15. J Appl Clin Med Phys. 2024. PMID: 37712893 Free PMC article.
-
A review of deep learning based methods for medical image multi-organ segmentation.Phys Med. 2021 May;85:107-122. doi: 10.1016/j.ejmp.2021.05.003. Epub 2021 May 13. Phys Med. 2021. PMID: 33992856 Free PMC article. Review.
-
Deep Learning in MRI-guided Radiation Therapy: A Systematic Review.ArXiv [Preprint]. 2023 Mar 30:arXiv:2303.11378v2. ArXiv. 2023. Update in: J Appl Clin Med Phys. 2024 Feb;25(2):e14155. doi: 10.1002/acm2.14155. PMID: 36994167 Free PMC article. Updated. Preprint.
-
Evaluation of magnetic resonance imaging derived synthetic computed tomography for proton therapy planning in prostate cancer.Phys Imaging Radiat Oncol. 2024 Aug 12;31:100625. doi: 10.1016/j.phro.2024.100625. eCollection 2024 Jul. Phys Imaging Radiat Oncol. 2024. PMID: 39253731 Free PMC article.
-
Deep learning-based synthetic dose-weighted LET map generation for intensity modulated proton therapy.Phys Med Biol. 2024 Jan 5;69(2):025004. doi: 10.1088/1361-6560/ad154b. Phys Med Biol. 2024. PMID: 38091613 Free PMC article.
References
-
- Andreo P 2009. On the clinical spatial resolution achievable with protons and heavier charged particle radiotherapy beams Phys. Med. Biol. 54 N205–15 - PubMed
-
- Bär E, Lalonde A, Royle G, Lu H-M and Bouchard H 2017. The potential of dual-energy CT to reduce proton beam range uncertainties Med. Phys. 44 2332–44 - PubMed
-
- Bazalova M, Carrier JF, Beaulieu L and Verhaegen F 2008. Dual-energy CT-based material extraction for tissue segmentation in Monte Carlo dose calculations Phys. Med. Biol. 53 2439–56 - PubMed
-
- Boas FE and Fleischmann D 2012. CT artifacts: causes and reduction techniques Imaging Med. 4 229–40
-
- Bourque AE, Carrier JF and Bouchard H 2014. A stoichiometric calibration method for dual energy computed tomography Phys. Med. Biol. 59 2059–88 - PubMed
Publication types
MeSH terms
Substances
Grants and funding
LinkOut - more resources
Full Text Sources
Other Literature Sources
Medical