. 2021 Dec 16;73(12):2228-2239.
doi: 10.1093/cid/ciab147.

Plasma Metabolomic Profiling of Patients Recovered From Coronavirus Disease 2019 (COVID-19) With Pulmonary Sequelae 3 Months After Discharge

Affiliations

Plasma Metabolomic Profiling of Patients Recovered From Coronavirus Disease 2019 (COVID-19) With Pulmonary Sequelae 3 Months After Discharge

Juanjuan Xu et al. Clin Infect Dis. .

Abstract

Background: Elucidation of the molecular mechanisms involved in the pathogenesis of coronavirus disease 2019 (COVID-19) may help to discover therapeutic targets.

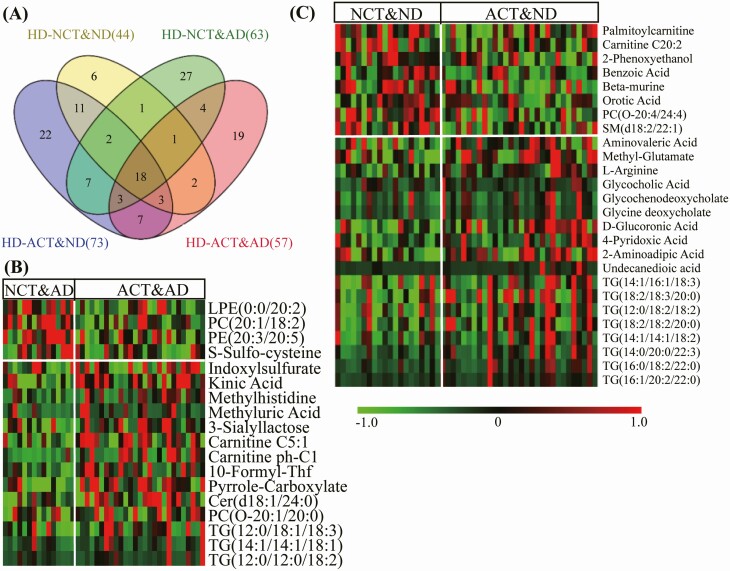
Methods: To determine the metabolomic profile of circulating plasma from COVID-19 survivors with pulmonary sequelae 3 months after discharge, a random, outcome-stratified case-control sample was analyzed. We enrolled 103 recovered COVID-19 patients as well as 27 healthy donors, and performed pulmonary function tests, computerized tomography (CT) scans, laboratory examinations, and liquid chromatography-mass spectrometry.

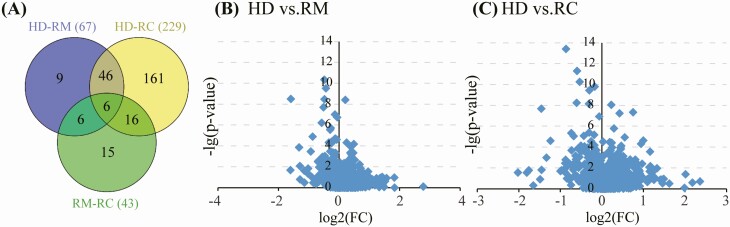
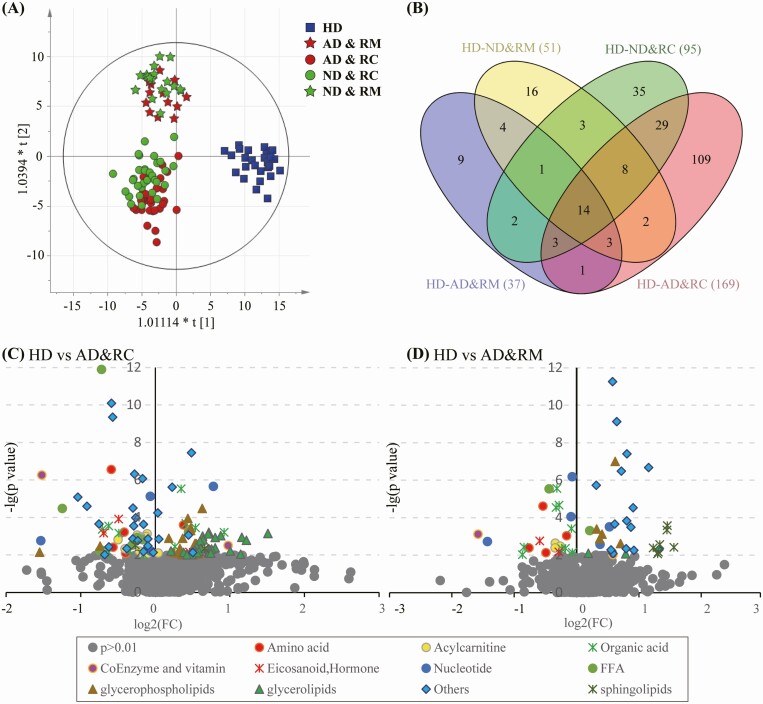
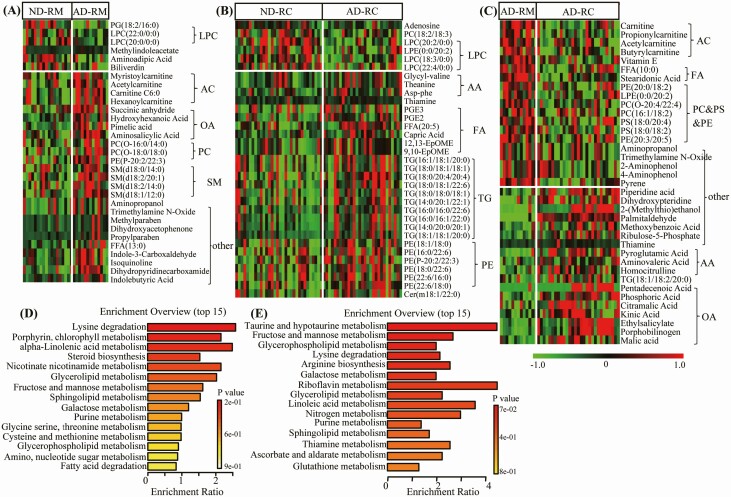
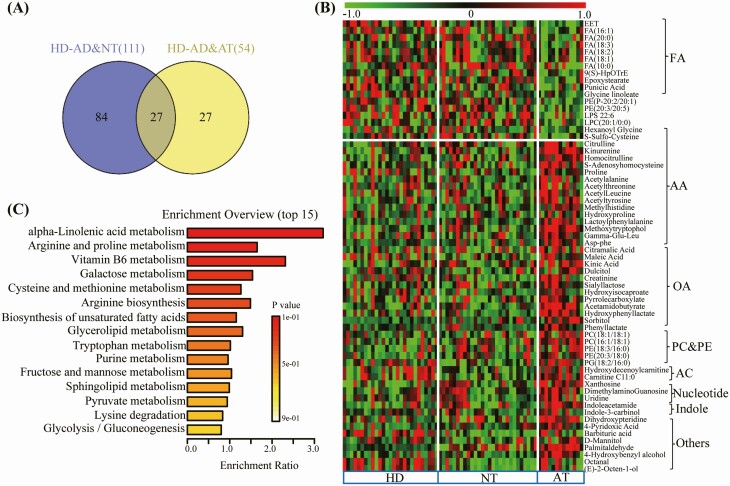
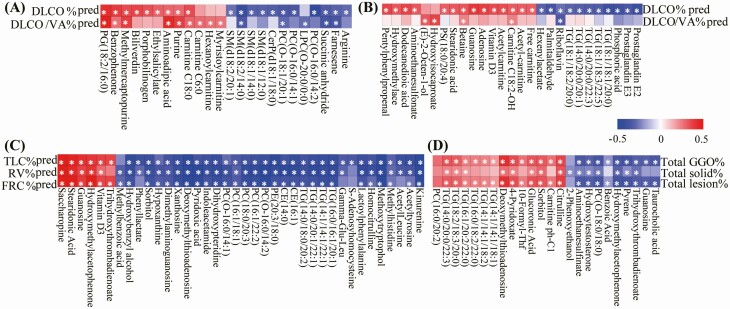
Results: Plasma metabolite profiles of COVID-19 survivors with abnormal pulmonary function were different from those of healthy donors or subjects with normal pulmonary function. These alterations were associated with disease severity and mainly involved amino acid and glycerophospholipid metabolic pathways. Furthermore, increased levels of triacylglycerols, phosphatidylcholines, prostaglandin E2, arginine, and decreased levels of betain and adenosine were associated with pulmonary CO diffusing capacity and total lung capacity. The global plasma metabolomic profile differed between subjects with abnormal and normal pulmonary function.

Conclusions: Further metabolite-based analysis may help to identify the mechanisms underlying pulmonary dysfunction in COVID-19 survivors, and provide potential therapeutic targets in the future.

Keywords: COVID-19; lipidomics; metabolomics; pulmonary function.


Figures

Figure 1.
Figure 1.
Venn diagram of the number of differential metabolites. (A) Between the comparisons of HD with RM and RC, respectively. (B) and (C) Volcano plots of altered metabolites found in RM and RC compared with HDs, respectively. The X-axis represents the log2 value (FC), FC indicates the ratio of mean level of the metabolite in the RM or RC to the mean value of HDs; the Y-axis denotes the –log(p-value). Abbreviations: HD, healthy donors; RC, severe/critical patients; RM, mild/moderate patients.
Figure 2.
Figure 2.
Characterization of metabolic profiles of recovered COVID-19 patients who presented abnormal pulmonary diffusion capacity at 3 months after discharge from the hospital. Recovered (A) score plots of OPLS-DA based on the detected 1124 features (included metabolites and lipids) in the groups of healthy donors, normal or abnormal pulmonary diffusion capacity presented in the recovered mild and severe COVID-19 patients (ND&RM, AD&RM, and ND&RC, AD&RC). (B) Venn diagram displays the number of differential features in the ND&RM, AD&RM, ND&RC, and AD&RC when compared with those in HD. (C) and (D) Volcano plots of altered metabolites found in AD&RC and AD&RM compared with HDs. The X-axis represents the log2(FC) value; FC indicates the ratio of mean level of the metabolite in the AD&RC or AD&RM to the mean value of HDs; the Y-axis denotes –log(p-value). The gray dots represent the metabolites with P > .01. Abbreviations: AD&RC, recovered severe/critical patients with abnormal DLCO%pred; AD&RM, recovered mild/moderate patients with abnormal DLCO%pred; COVID-19, coronavirus disease 2019; HD, healthy donors; ND&RC, recovered severe/critical patients with normal DLCO%pred; ND&RM, recovered mild/moderate patients with normal DLCO%pred; OPLS-DA, orthogonal partial least square-discriminate analysis.
Figure 3.
Figure 3.
Significantly altered metabolites in COVID-19 survivors presented abnormal pulmonary diffusion capacity at 3 months after their hospital discharge compared to survivors with normal pulmonary diffusion capacity. Heat map of significantly changed lipids and metabolites (P < .05 with FC > 1.2 or <0.83) between normal and abnormal pulmonary diffusion capacity survivors of mild (A) or severe (B) type (ND&RM vs. AD&RM, and ND&RC vs. AD&RC), or between recovered mild and severe COVID-19 survivors with abnormal pulmonary diffusion capacity (C) type (AD&RM vs AD&RC) (red, green, and black, denote relative higher, lower and mean level, respectively). (D) (E) Related disturbed pathways of differential metabolites in the AD&RM and AD&RCs, respectively. Abbreviations: COVID-19, coronavirus disease, 2019.
Figure 4.
Figure 4.
Significantly altered metabolites in COVID-19 survivors who presented abnormal total lung capacity at 3 months after their hospital discharge compared to survivors with normal total lung capacity. (A) Venn diagram showing the number of differential metabolites between the comparisons of HD with NT and AT, respectively. (B) Heat map of differential features (P < .05 with FC > 1.2 or <0.83) discovered in the AT group when compared with NT group (red, green, and black denote relatively higher, lower, and mean levels, respectively). (C) Related disturbed pathways of differential lipids and metabolites in the AT group. Abbreviations: AT, abnormal total lung capacity; COVID-19, coronavirus disease 2019; HD, healthy donors; NT, normal total lung capacity.
Figure 5.
Figure 5.
Significantly altered metabolites in COVID-19 survivors who presented abnormal CT results at 3 months after their hospital discharge. (A) Venn diagram showing the number of differential metabolites between the comparisons of HD and ND&NCT, ND&ACT, AD&NCT, and AD&ACT,AT. Heat map of differential features discovered in the ACT groups when compared with NCT groups with abnormal (B) and normal (C) pulmonary diffusion capacity. Red, green, and black denote relatively higher, lower, and mean levels, respectively. Abbreviations: AD&RC, recovered severe/critical patients with abnormal DLCO%pred; AD&RM, recovered mild/moderate patients with abnormal DLCO%pred; HD, healthy donors; ND&RC, recovered severe/critical patients with normal DLCO%pred; ND&RM, recovered mild/moderate patients with normal DLCO%pred.
Figure 6.
Figure 6.
Correlation analysis between clinical parameters and differential metabolites. Heat map of coefficients of Spearman correlation analysis between levels of differential metabolites and pulmonary diffusion capacity parameters in the recovered mild (A) and severe (B) COVID-19 patients. Heat map of coefficients of Spearman correlation analysis between levels of differential metabolites and clinical parameters of abnormal total lung capacity (C) or CT (D). Red, blue, and white denote relatively higher, lower, and mean levels, respectively. Correlations with P < .05 are marked with stars(*). Abbreviations: COVID-19, coronavirus disease-2019; CT, computed tomography.

References

    1. Hui DS, Joynt GM, Wong KT. Impact of severe acute respiratory syndrome (SARS) on pulmonary function, functional capacity and quality of life in a cohort of survivors. Thorax 2015; 60:401–9. - PMC - PubMed
    1. Antonio GE, Wong KT, Hui DS, et al. . Thin-section CT in patients with severe acute respiratory syndrome following hospital discharge: preliminary experience. Radiology 2003; 228:810–5. - PubMed
    1. You J, Zhang L, Ni-Jia-Ti MY, et al. . Anormal pulmonary function and residual CT abnormalities in rehabilitating COVID-19 patients after discharge. J Infect 2020; 81:e150–2. - PMC - PubMed
    1. Yu M, Liu Y, Xu D, Zhang R, Lan L, Xu H. Prediction of the development of pulmonary fibrosis using serial thin-section CT and clinical features in patients discharged after treatment for COVID-19 pneumonia. Korean J Radiol 2020; 21:746–55. - PMC - PubMed
    1. Wang Y, Dong C, Hu Y, et al. . Temporal changes of CT findings in 90 patients with COVID-19 pneumonia: a longitudinal study. Radiology 2020; 296:E55–64. - PMC - PubMed

Publication types