

doi: 10.1161/CIRCRESAHA.120.318155.
Epub 2021 Feb 18.
Restructuring the Gut Microbiota by Intermittent Fasting Lowers Blood Pressure
Affiliations
- PMID: 33596669
- PMCID: PMC8085162
- DOI: 10.1161/CIRCRESAHA.120.318155
Item in Clipboard
Restructuring the Gut Microbiota by Intermittent Fasting Lowers Blood Pressure
Circ Res.
.
Erratum in
-
Correction to: Restructuring the Gut Microbiota by Intermittent Fasting Lowers Blood Pressure.Circ Res. 2022 Mar 4;130(5):e18. doi: 10.1161/RES.0000000000000533. Epub 2022 Mar 3. Circ Res. 2022. PMID: 35239407 No abstract available.
Abstract
[Figure: see text].
Keywords: bile acids; dysbiosis; fasting; metabolomics; microbiota.
Conflict of interest statement
Figures
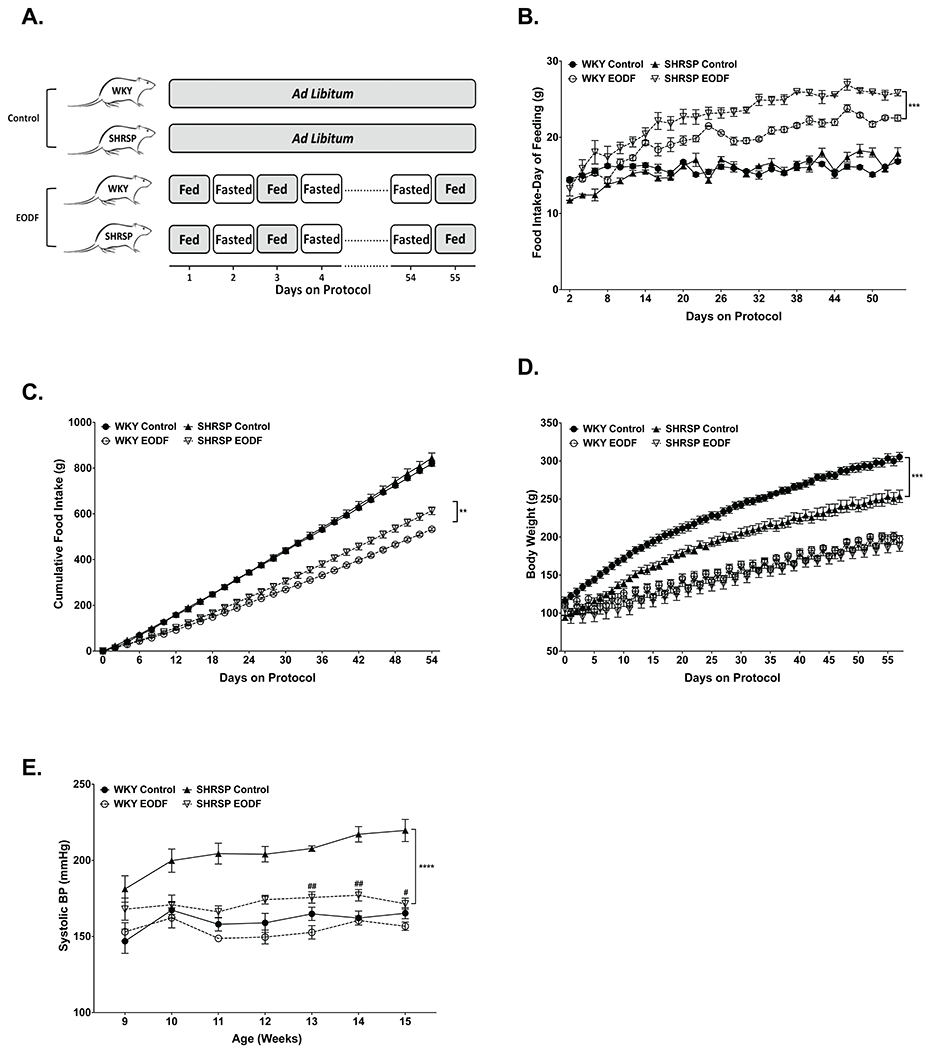
(a) Diagram depicting feeding schedule for control and EODF groups.
(b)Daily and (c) cumulative food intake. (d) Body weights were measured daily
over the course of the study. (e) Weekly SBP of WKY and SHRSP fed ad libitum or
EODF. Data presented as mean ± SEM. Three-way ANOVA with Tukey’s
multiple comparisons test. Main effects of strain, feeding group, age, age x
strain, age x diet, age x strain x feeding group p≤0.05 for all (b-d).
n=6-8, **p≤0.01, ***p≤0.0005, ****p≤0.0001,
#p≤0.05 vs SHRSP Control, ##p≤0.005 vs SHRSP
Control
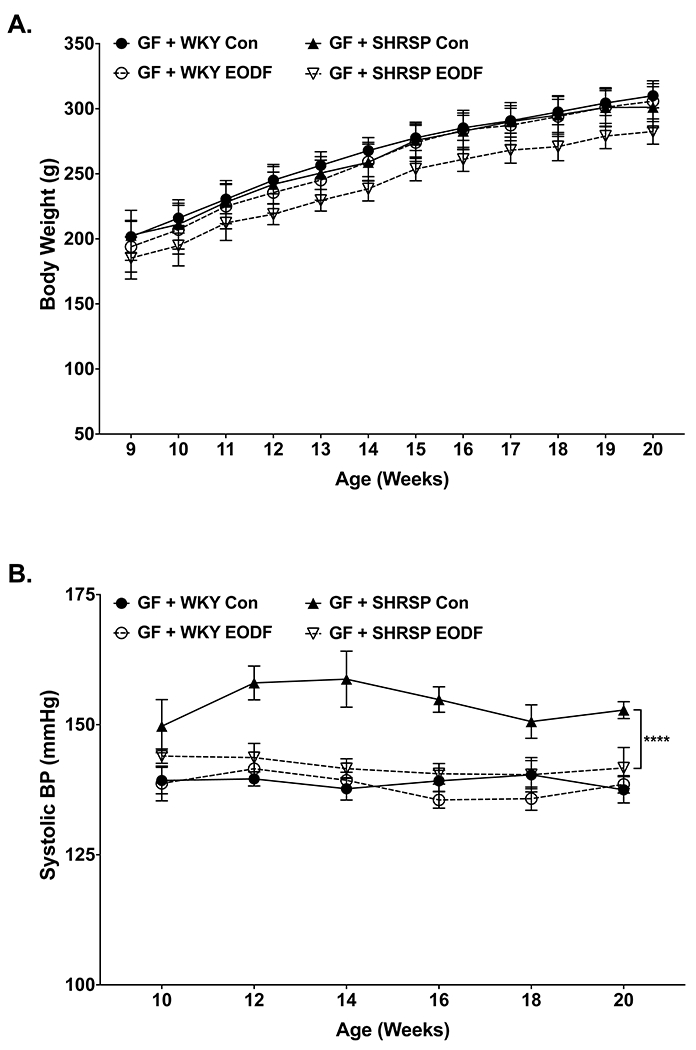
Weekly (a) body weight and (b) SBP of germ-free rats transplanted with
microbiota from WKY and SHRSP controls or EODF. Data presented as mean ±
SEM. Three-way ANOVA with Tukey’s multiple comparisons test. Main effects
of strain, feeding group, strain x feeding group p≤0.0001 for (b). n=6-8,
****p≤0.0001
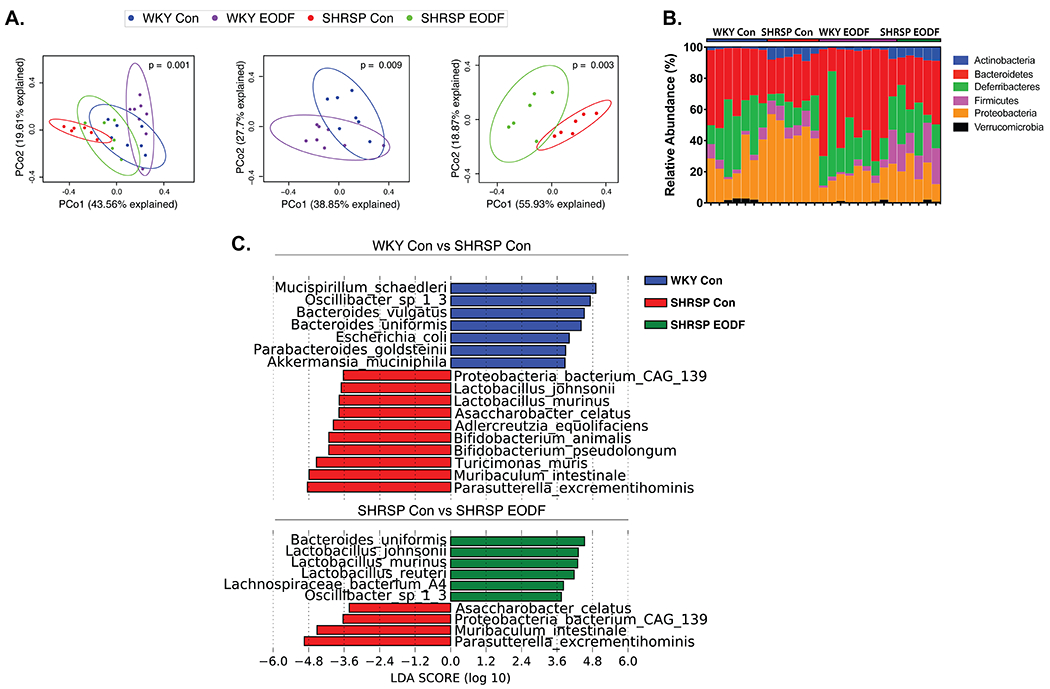
(a) Principal Coordinate Analysis plots of Bray-Curtis dissimilarity of
four groups (left), WKY (middle), and SHRSP (right). (b) Relative abundance of
taxa at phyla level for individual samples. (c) LEfSe plots to identify species
that characterize control groups (top) and effects of EODF on SHRSP (bottom).
n=6-8
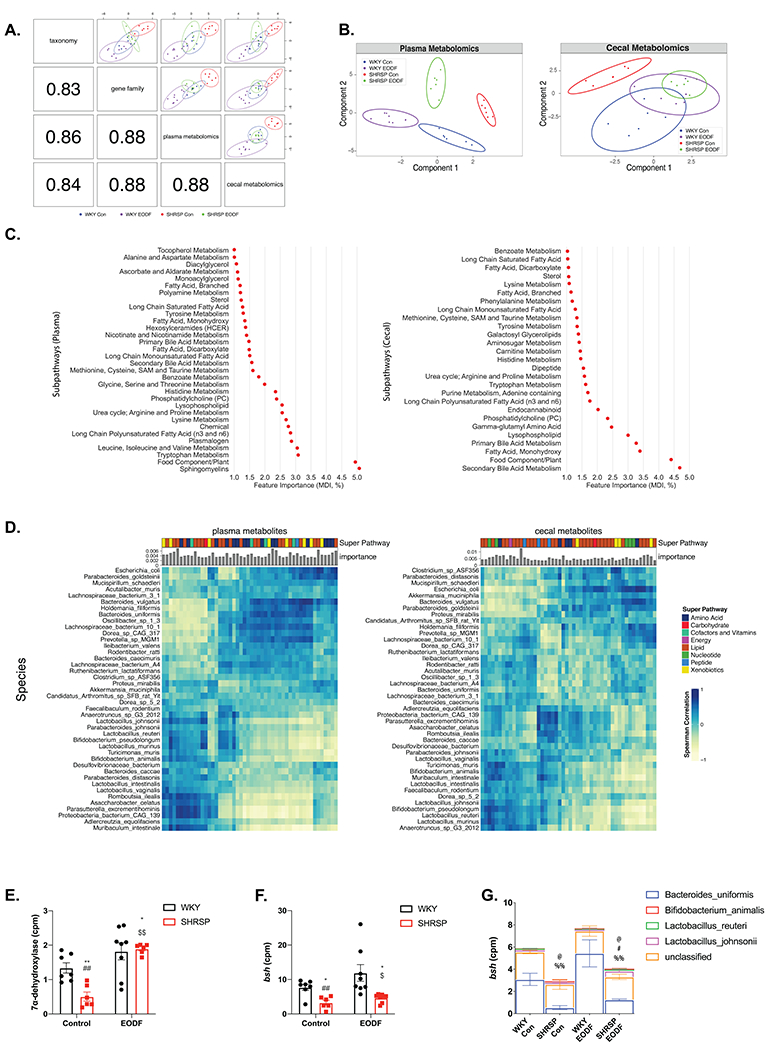
(a) Pearson correlation between component one of each dataset
(bottom-left) and Sparse partial least squares discriminant analysis (sPLS-DA)
of two omics (top-right). (b) Sparse partial least squares discriminant analysis
(sPLS-DA) of plasma (left) and cecal (right) metabolites in four groups. (c)
Plasma (left) and cecal (right) metabolite sub pathways identified by random
forest classification as important for four group separation (Gini index as
feature importance). (d) Spearman correlation between the top 50 most important
metabolites (left:plasma, right:cecal) and species. Bar graphs indicate
metabolite importance, and color blocks indicate super pathways. Comparison of
total counts per millions of (e) 7α-dehydroxylase and (f) bile salt
hydrolase (bsh). (g) Species stratified counts per million
(cpm) of bsh gene. Two-way ANOVA with robust estimator followed
by Mann-Whitney U test with Benjamin-Hochberg post hoc
correction. Main effects of treatment p<0.0001. and interaction p= 0.0267
for (e). Main effects of genotype p=0.0267 for (f). Main effect of genotype for
B.uniformis p=0.0083. Main effect of interaction for
L.reuteri p=0.0345. Main effect of genotype p=0.0134 and
interaction p=0.0334 for L.johnsonii. n=6-8. * p<0.05 vs
WKY Con; ** p<0.01 vs WKY Con; ## p<0.01 vs WKY EODF; $
p<0.05 vs SHRSP Con; $$ p<0.01 vs SHRSP Con; @
p<0.05 vs WKY Con (B.uniformis); # p<0.05 vs
SHRSP Con (B.uniformis); %% p<0.01 vs WKY EODF
(B.uniformis)
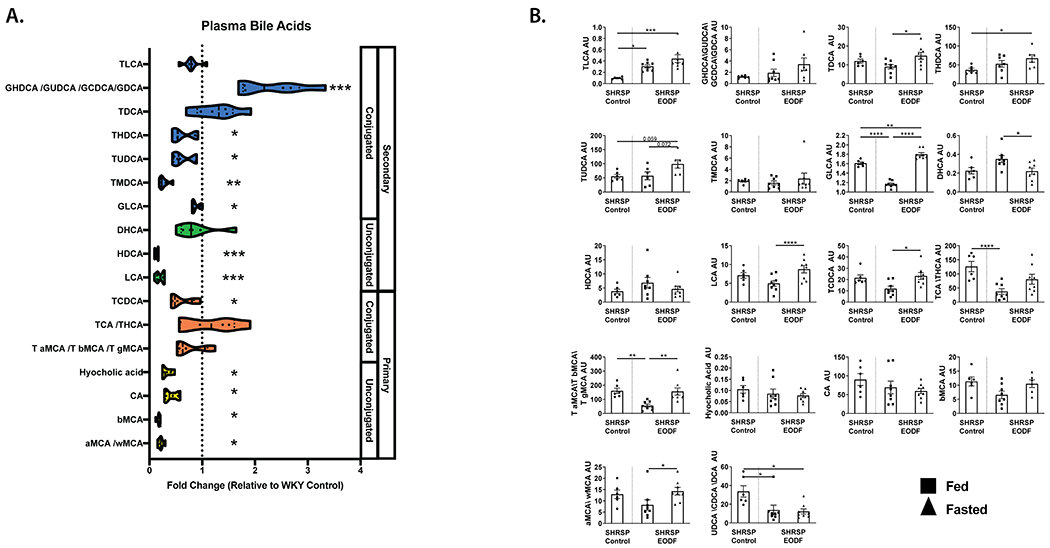
(a) SHRSP control plasma bile acid measurements relative to WKY
controls. (b) SHRSP EODF plasma bile acids during fed and fasted states compared
to SHRSP control levels. Mann-Whitney test with FDR correction (a), one-way
ANOVA with Tukey’s multiple comparisons test or Kruskal-Wallis with
Dunn’s multiple comparisons test (b). *p≤0.05 vs WKY Con,
**p≤0.01 vs WKY Con ***p≤0.005 vs WKY Con, ****p≤0.001.
n=6-8
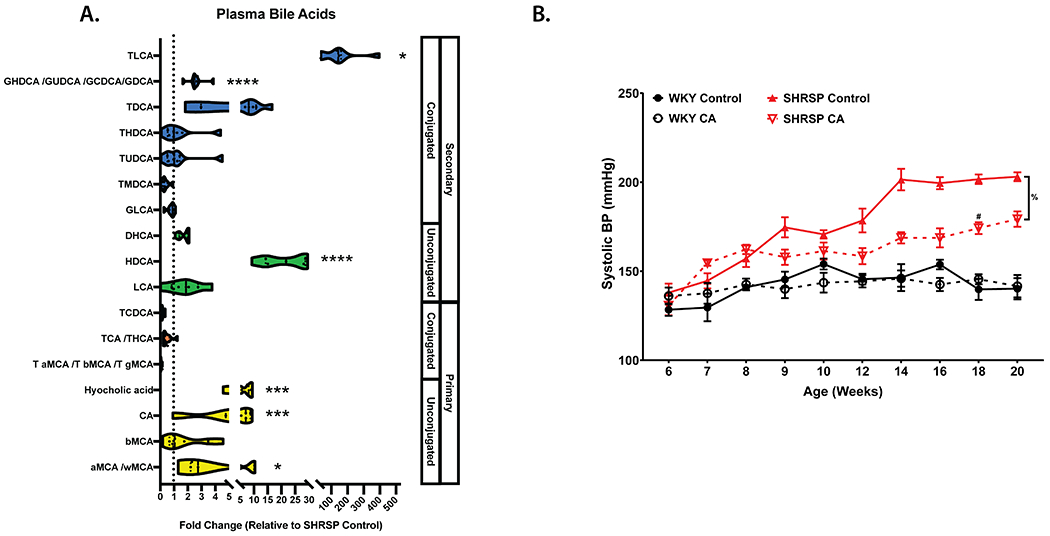
(a) SHRSP CA plasma bile acid measurements relative to SHRSP controls.
(b) Weekly SBP measurements in WKY or SHRSP on control or 0.5% CA supplemented
diet. Data presented as mean ± SEM. Mann-Whitney test with FDR correction
(a), Three-way ANOVA with Tukey’s multiple comparisons test (b). Main
effects of strain (p≤0.0001), diet (p=0.0014), age (p≤0.0001), age
x strain (p≤0.0001), age x diet (p≤0.0001), strain x diet
(p=0.0024),diet x strain x feeding group (p=0.0084). *p≤0.05,
***p≤0.005, ****p≤0.0001, %p=0.0003,
#p≤0.05 vs SHRSP Control. n=6-8
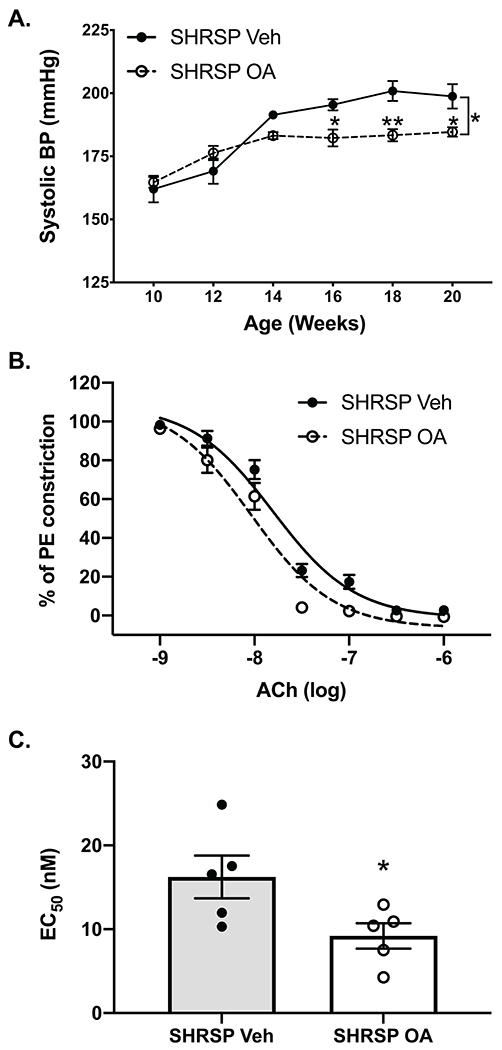
(a) SBP measurements in SHRSP injected daily with vehicle or the TGR5
agonist OA. (b) Acetylcholine (Ach_induced vasodilation of mesenteric arteries
isolated from vehicle- or OA-treated SHRSPs. (c) Calculated EC50
values for acetylcholine induced vasodilation of mesenteric arteries isolated
from vehicle or OA treated SHRSPs. Data presented as mean ± SEM. (a)
Two-way ANOVA main effects of age (p<0.0001), treatment (p=0.0317), and
age x treatment (p=0.0023). (b) Two-way ANOVA main effects of Ach dose
p<0.0001, treatment p=0.0262, dose x treatment p=0.0125. (c) unpaired
t-test. *p≤0.05 vs SHRSP vehicle, **p≤0.01 vs SHRSP vehicle,
n=5-6
Comment in
-
Modulating the gut microbiota with dietary interventions to protect against cardiometabolic disease.Nat Rev Cardiol. 2021 May;18(5):305. doi: 10.1038/s41569-021-00537-0. Nat Rev Cardiol. 2021. PMID: 33658636 No abstract available.
-
Gut Dysbiosis-Induced Hypertension Is Ameliorated by Intermittent Fasting.Circ Res. 2021 Apr 30;128(9):1255-1257. doi: 10.1161/CIRCRESAHA.121.319147. Epub 2021 Apr 29. Circ Res. 2021. PMID: 33914600 No abstract available.
References
-
- Raizada MK, Joe B, Bryan NS, Chang EB, Dewhirst FE, Borisy GG, Galis ZS, Henderson W, Jose PA, Ketchum CJ, et al. Report of the national heart, lung, and blood institute working group on the role of microbiota in blood pressure regulation: current status and future directions. Hypertension. 2017; - PMC - PubMed
-
- Toral M, Robles-Vera I, de la Visitación N, Romero M, Sánchez M, Gómez-Guzmán M, Rodriguez-Nogales A, Yang T, Jiménez R, Algieri F, Gálvez J, et al. Role of the immune system in vascular function and blood pressure control induced by fecal microbiota transplantation in rats. Acta Physiol (Oxf). 2019;e13285. - PubMed
Publication types
MeSH terms
Substances
Grants and funding
LinkOut - more resources
Full Text Sources
Other Literature Sources
Medical
