. 2021 Jan-Dec;13(1):1-15.
doi: 10.1080/19490976.2021.1882926.

Ethnic variability associating gut and oral microbiome with obesity in children

Affiliations

Ethnic variability associating gut and oral microbiome with obesity in children

Baskar Balakrishnan et al. Gut Microbes. 2021 Jan-Dec.

Abstract

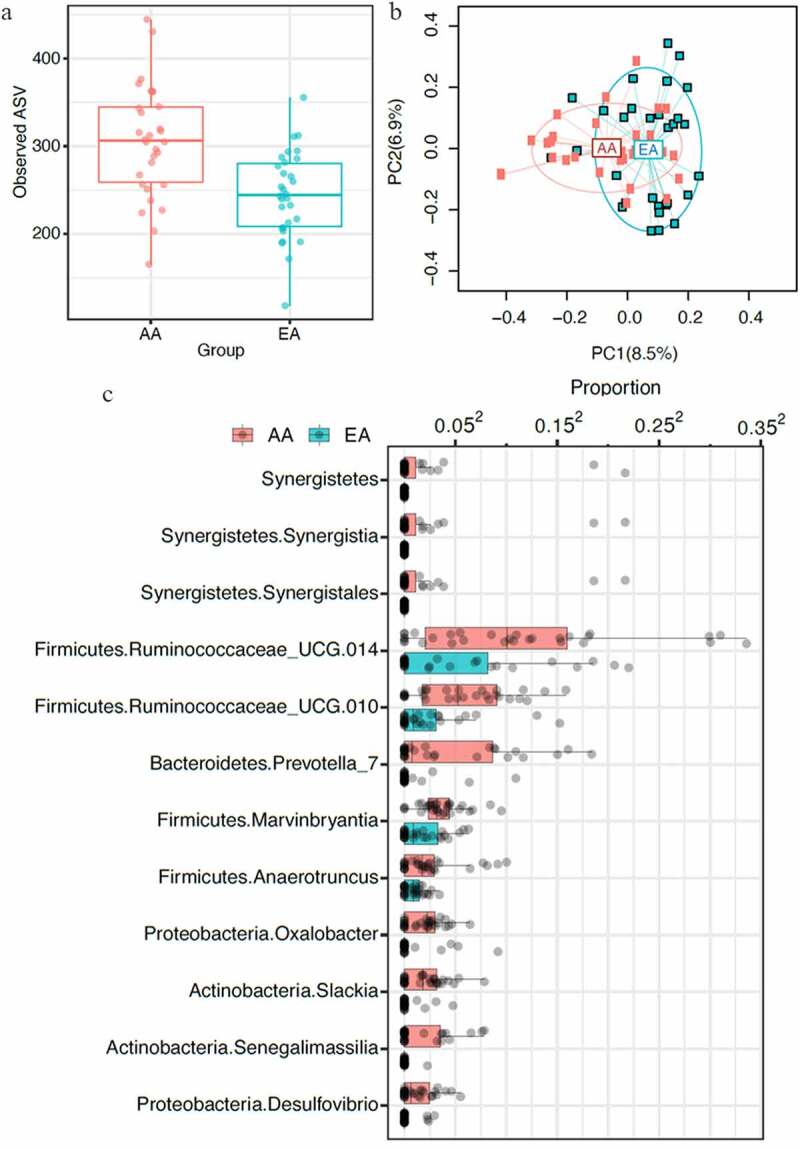
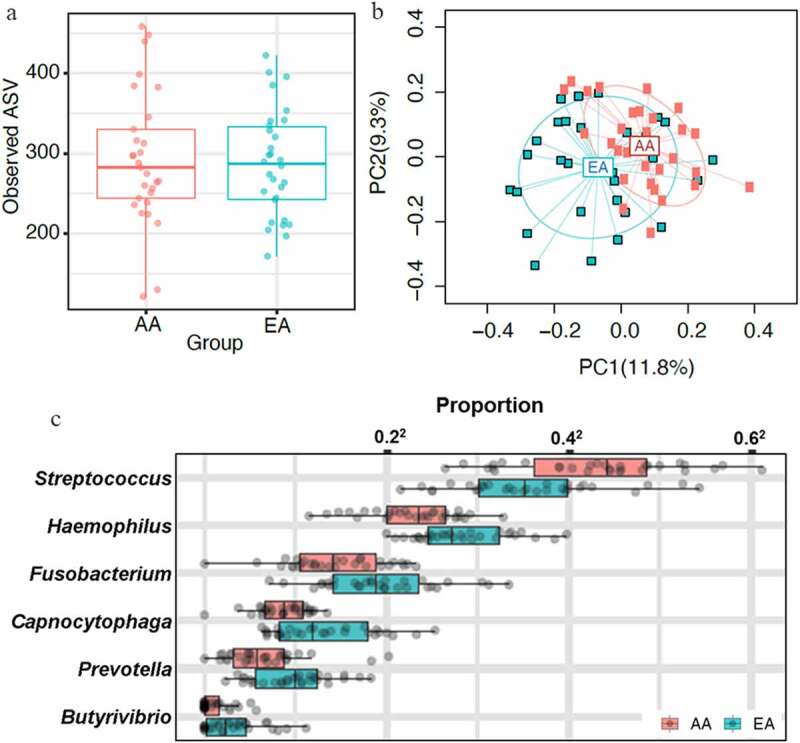
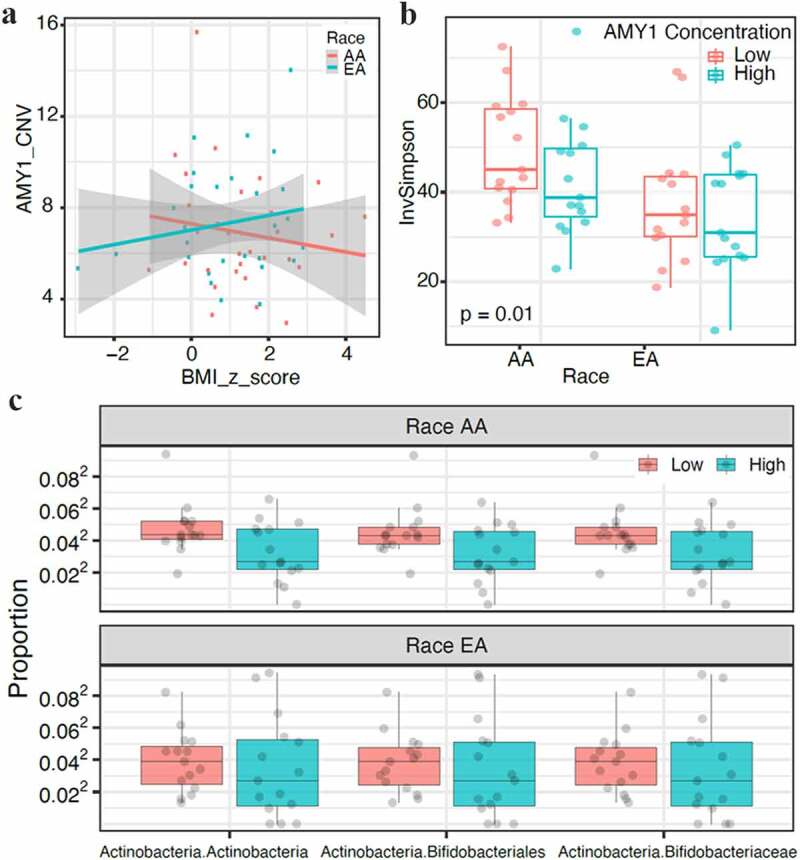
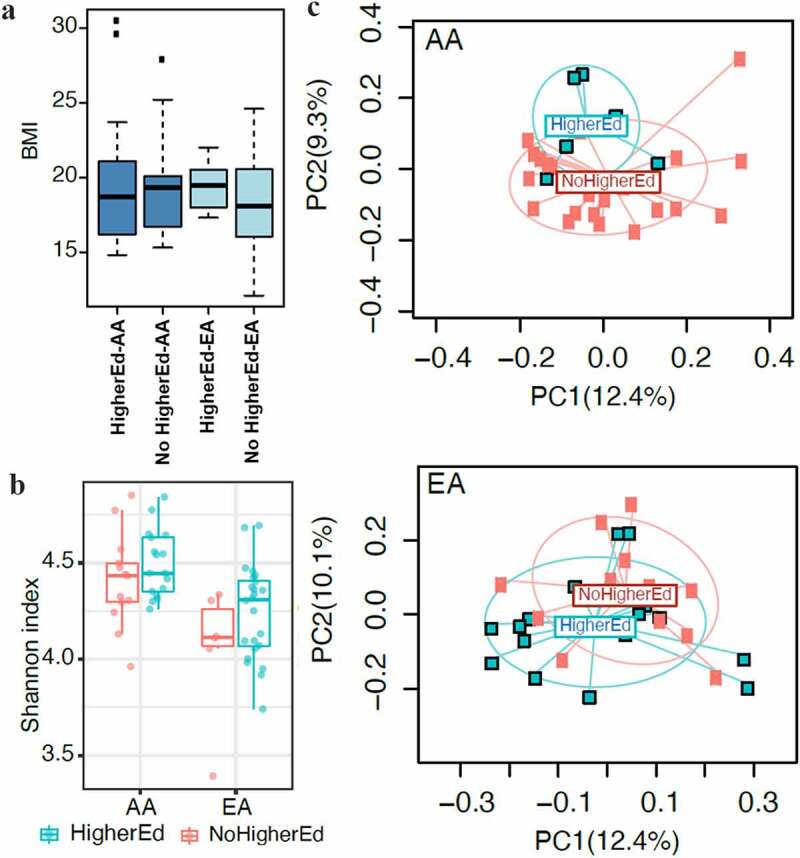
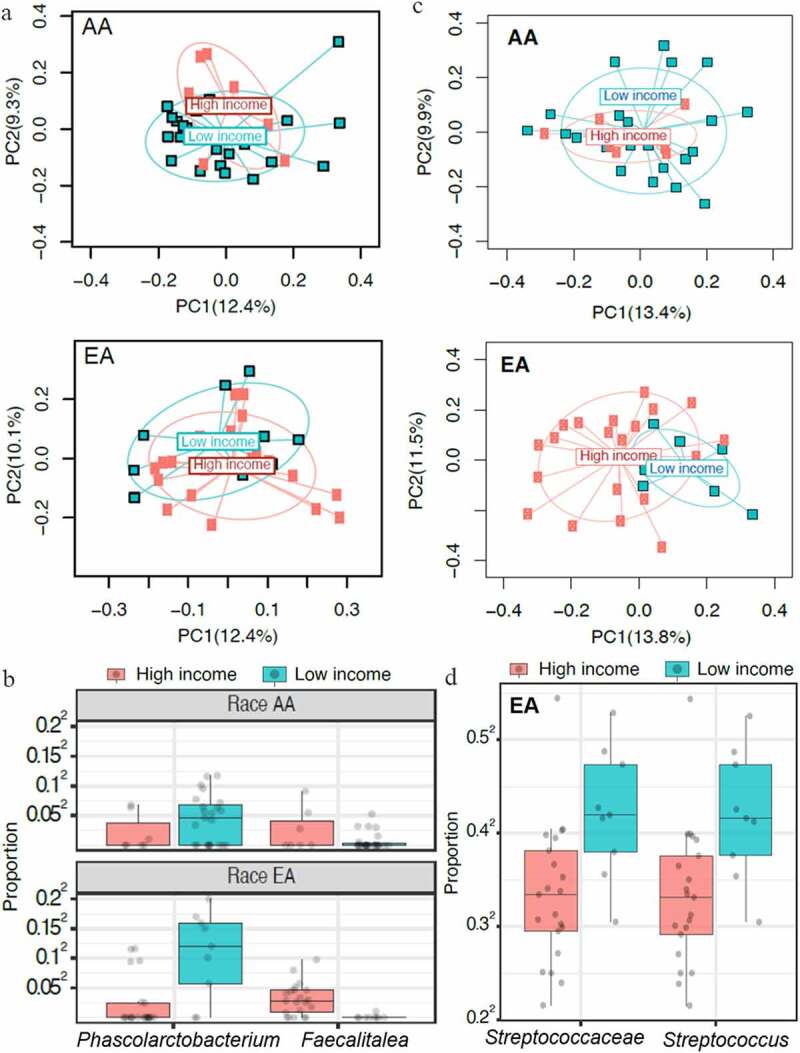
Obesity is a growing worldwide problem that generally starts in the early years of life and affects minorities more often than Whites. Thus, there is an urgency to determine factors that can be used as targets as indicators of obesity. In this study, we attempt to generate a profile of gut and oral microbial clades predictive of disease status in African American (AA) and European American (EA) children. 16S rDNA sequencing of the gut and saliva microbial profiles were correlated with salivary amylase, socioeconomic factors (e.g., education and family income), and obesity in both ethnic populations. Gut and oral microbial diversity between AA and EA children showed significant differences in alpha-, beta-, and taxa-level diversity. While gut microbial diversity between obese and non-obese was not evident in EA children, the abundance of gut Klebsiella and Magasphaera was associated with obesity in AA children. In contrast, an abundance of oral Aggregatibacter and Eikenella in obese EA children was observed. These observations suggest an ethnicity-specific association with gut and oral microbial profiles. Socioeconomic factors influenced microbiota in obesity, which were ethnicity dependent, suggesting that specific approaches to confront obesity are required for both populations.

Keywords: Microbiome; disparity; minorities; obesity; socioeconomic factors.


Figures

Figure 1.
Figure 1.
Gut microbiota variability, defined by 16S rDNA sequencing, between children of African American (AA) and European American (EA) ethnic populations (n = 60) showed significant differences between the 2 populations. A, Comparison of species richness, alpha diversity, defined by observed amplicon sequence variants (ASV) of AA and EA populations showed significant differences (p ≤ .05). B, Principal coordinate analysis (PCoA) plot based on the bray-curtis distance matrix constructed using ASVs. The percentage of variability explained by the corresponding coordinate is indicated on the axes. Each point represents a sample – red symbols indicate aa population and blue symbols indicate ea population. The lines indicate vectors representing the relationships between ASVs and each sample category. The ellipses serve a visual guide to group differences. Comparison of beta diversity between aa and ea populations showed significant differences in community structure (p ≤ .05). C, Differential abundance of taxa in AA and EA populations at 10% false discovery rate. Each dot represents a participant. The relative abundances were plotted on the square-root scale to better visualize the low abundance taxa
Figure 2.
Figure 2.
Oral microbiota comparison between AA and EA populations (n = 60) showed similar alpha diversity with considerable difference in beta diversity with ethnicity-specific taxa. Oral microbiota was sequenced using saliva samples. A, Alpha diversity was analyzed by observed ASVs. No significant difference in alpha diversity of oral microbiota was observed between AA and EA groups. B,Bray-curtis distance matrix for beta diversity between AA and EA populations was analyzed using permanova. Comparison between AA and EA groups showed a significant difference in beta diversity (p ≤ .05). C, Genus-level differentially abundant taxa in AA and EA groups at 10% false discovery rate were presented. The relative abundances were plotted on the square-root scale to better visualize the low abundance taxa. Streptococcus was present with an increased abundance in AA children compared to EA children, and 5 genera, butyrivibrio, capnocytophaga, fusobacterium, haemophilus, and prevotella, were abundant in EA but no in AA groups
Figure 3.
Figure 3.
Microbiota differences between obese and non-obese children showed ethnicity-dependent associations. Oral microbial diversity was associated with obesity in EA children and gut microbial diversity in aa children. A-C, Gut microbiota differences in stool samples between obese and non-obese AA children. A, Alpha diversity measured by observed ASVs showed increased diversity in obese children compared to non-obese children. B, Beta diversity (bray-curtis distance) showed significant differences in gut microbiota between obese and non-obese AA children (p ≤ .05). C, Differentially abundant taxa in obese and non-obese AA children (n = 30). Children from the EA group did not show major differences in gut microbiota alpha and beta diversity as well as differences in taxa abundance between obese and non-obese participants (not shown). D-E, Oral microbial diversity was associated with obesity in EA children only (n = 30). D, Salivary microbial alpha-diversity comparison between obese and non-obese EA children showed obesity was associated with increased diversity. E, Genera Aggregatibacter and Eikenella abundance was increased in obese compared to non-obese EA children. Children from the AA group did not show significant differences in alpha, beta, and taxa diversity in salivary microbiota (not shown)
Figure 4.
Figure 4.
Correlation of AMY1 copy numbers (CNVs) with body mass index (BMI) and gut microbiome. AMY1 is not associated with BMI. A, AMY1 and BMI z-score did not show any correlation in EA and AA populations (n = 60). B, Alpha diversity measured by inverse simpson index (inv simpson) showed a significant difference in gut microbial diversity between low and high levels of AMY1 in AA children (p = .01) but not EA children. C, AMY1 levels reflected taxa diversity in the gut microbiome with low abundance of Bifidobacteriaceae representing Actinobacteria in AMY1-high children when compared to amy1-low children in both populations (p ≤ .05)
Figure 5.
Figure 5.
Educational status of parents did not impact BMI but did influence gut microbial diversity. Families with 1 parent with college degree were categorized as higher education. A, Correlation between educational status of parents and BMI z-score of children was not significant in either populations. B, Education levels of parents correlated with a nonsignificant but an increased trend of gut microbiota alpha diversity. C, Beta diversity in children of both groups showed significant differences associated with their parent’s educational status (P = .02). However, no abundance of specific taxa in gut microbiota was observed based on the educational status of the parents in both populations. No significant associations between educational status and oral microbiota were observed between populations (not shown)
Figure 6.
Figure 6.
Family income strongly influences gut and oral microbiota based on ethnicity. A cutoff of $50,000 per family was used as low annual income. A, In both AA and EA children belonging to higher income families, an increased beta diversity in gut microbiota was shown (P = .03). No correlation between income and gut microbial alpha diversity was observed in both groups. B, Both groups had increased abundance of gut Phascolarcobacteria, with a decrease in Faecalitalea (both belonging to the phylum Firmicutes) in families with low income (P ≤ .05). Oral microbial diversity differed based on the income of the EA and AA families. C, Beta diversity as determined by Bray-Curtis distance was associated with income in both groups (P = .001). D, Differentially abundant taxa analysis of oral microbiota showed increased abundance of Streptococcus in EA children from low-income families. No differentially abundant taxa were associated with income in AA children (not shown)

Similar articles

Cited by

References

    1. Ng M, Fleming T, Robinson M, Thomson B, Graetz N, Margono C, Mullany EC, Biryukov S, Abbafati C, Abera SF, et al. Global, regional, and national prevalence of overweight and obesity in children and adults during 1980-2013: A systematic analysis for the global burden of disease study 2013. Lancet. 2014;384(9945):766–15. doi:10.1016/S0140-6736(14)60460-8. - DOI - PMC - PubMed
    1. Ogden CL, Carroll MD, Kit BK, Flegal KM.. Prevalence of childhood and adult obesity in the united states, 2011-2012. Jama-Journal of the American Medical Association. 2014;311(8):806–814. doi:10.1001/jama.2014.732. - DOI - PMC - PubMed
    1. Smith KB, Smith MS. Obesity statistics. Prim Care. 2016;43(1):121. doi:10.1016/j.pop.2015.10.001. - DOI - PubMed
    1. Huang Y, Lu Y, Huang YM, Wang M, Ling W, Sui Y, Zhao HL. Obesity in patients with covid-19: A systematic review and meta-analysis. Metabolism. 2020;113:154378. doi:10.1016/j.metabol.2020.154378. - DOI - PMC - PubMed
    1. Wardle J, Carnell S, Haworth CM, Plomin R. Evidence for a strong genetic influence on childhood adiposity despite the force of the obesogenic environment. Am J Clin Nutr. 2008;87(2):398–404. doi:10.1093/ajcn/87.2.398. - DOI - PubMed

Publication types

Substances

LinkOut - more resources