

A theoretical derivation of response to selection with and without controlled mating in honeybees
- PMID: 33596819
- PMCID: PMC7891173
- DOI: 10.1186/s12711-021-00606-5
A theoretical derivation of response to selection with and without controlled mating in honeybees
Erratum in
-
Correction to: A theoretical derivation of response to selection with and without controlled mating in honeybees.Genet Sel Evol. 2021 Feb 24;53(1):18. doi: 10.1186/s12711-021-00617-2. Genet Sel Evol. 2021. PMID: 33627061 Free PMC article. No abstract available.
Abstract
Background: In recent years, the breeding of honeybees has gained significant scientific interest, and numerous theoretical and practical improvements have been made regarding the collection and processing of their performance data. It is now known that the selection of high-quality drone material is crucial for mid to long-term breeding success. However, there has been no conclusive mathematical theory to explain these findings.
Methods: We derived mathematical formulas to describe the response to selection of a breeding population and an unselected passive population of honeybees that benefits indirectly from genetic improvement in the breeding population via migration. This was done under the assumption of either controlled or uncontrolled mating of queens in the breeding population.
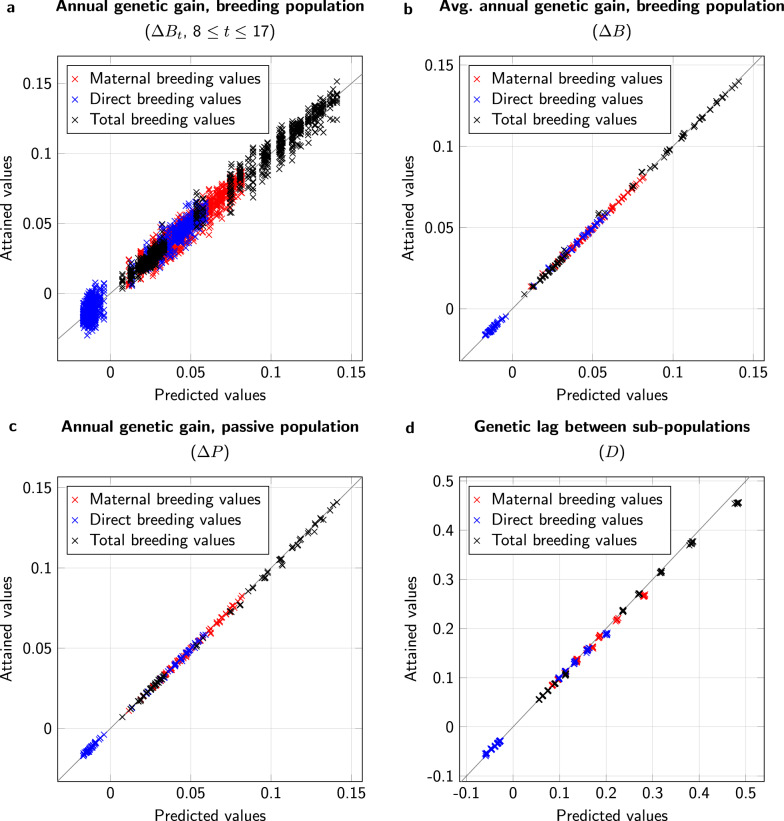
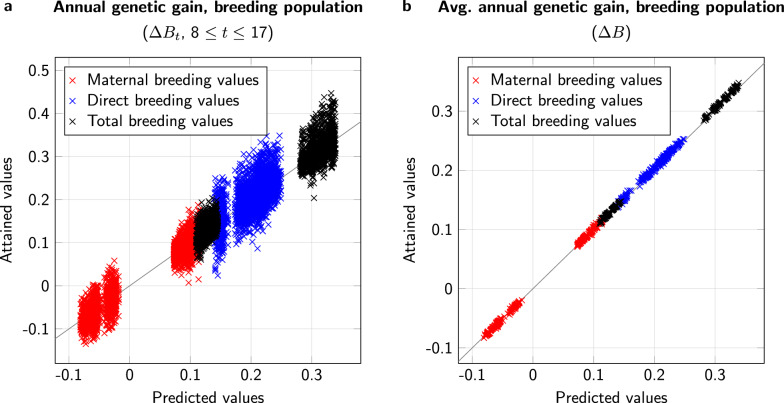
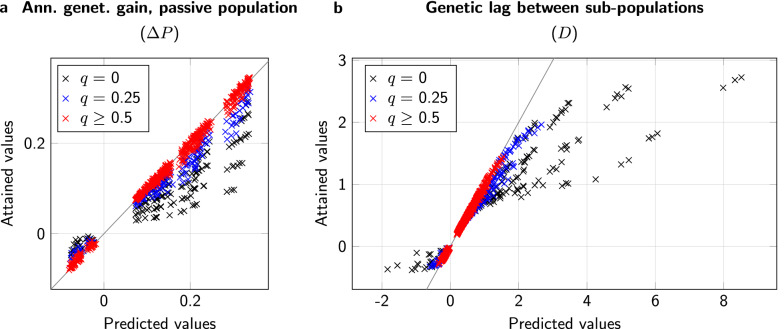
Results: Our model equations confirm what has been observed in simulation studies. In particular, we have proven that the breeding population and the passive population will show parallel genetic gain after some years and we were able to assess the responses to selection for different breeding strategies. Thus, we confirmed the crucial importance of controlled mating for successful honeybee breeding. When compared with data from simulation studies, the derived formulas showed high coefficients of determination [Formula: see text] in cases where many passive queens had dams from the breeding population. For self-sufficient passive populations, the coefficients of determination were lower ([Formula: see text]) if the breeding population was under controlled mating. This can be explained by the limited simulated time-frame and lower convergence rates.
Conclusion: The presented theoretical derivations allow extrapolation of honeybee-specific simulation results for breeding programs to a wide range of population parameters. Furthermore, they provide general insights into the genetic dynamics of interdependent populations, not only for honeybees but also in a broader context.
Conflict of interest statement
The authors declare that they have no competing interests.
Figures


Similar articles
-
The importance of controlled mating in honeybee breeding.Genet Sel Evol. 2019 Dec 12;51(1):74. doi: 10.1186/s12711-019-0518-y. Genet Sel Evol. 2019. PMID: 31830903 Free PMC article.
-
Short-term effects of controlled mating and selection on the genetic variance of honeybee populations.Heredity (Edinb). 2021 May;126(5):733-747. doi: 10.1038/s41437-021-00411-2. Epub 2021 Mar 30. Heredity (Edinb). 2021. PMID: 33785894 Free PMC article.
-
A simulation study of a honeybee breeding scheme accounting for polyandry, direct and maternal effects on colony performance.Genet Sel Evol. 2021 Sep 8;53(1):71. doi: 10.1186/s12711-021-00665-8. Genet Sel Evol. 2021. PMID: 34496761 Free PMC article.
-
Natural selection, selective breeding, and the evolution of resistance of honeybees (Apis mellifera) against Varroa.Zoological Lett. 2020 May 18;6:6. doi: 10.1186/s40851-020-00158-4. eCollection 2020. Zoological Lett. 2020. PMID: 32467772 Free PMC article. Review.
-
The neuroethology of olfactory sex communication in the honeybee Apis mellifera L.Cell Tissue Res. 2021 Jan;383(1):177-194. doi: 10.1007/s00441-020-03401-8. Epub 2021 Jan 15. Cell Tissue Res. 2021. PMID: 33447877 Review.
Cited by
-
The Potential of Instrumental Insemination for Sustainable Honeybee Breeding.Genes (Basel). 2023 Sep 14;14(9):1799. doi: 10.3390/genes14091799. Genes (Basel). 2023. PMID: 37761939 Free PMC article.
-
The number of drones to inseminate a queen with has little potential for optimization of honeybee breeding programs.Hereditas. 2024 Aug 27;161(1):28. doi: 10.1186/s41065-024-00332-0. Hereditas. 2024. PMID: 39192380 Free PMC article.
-
Correction to: A theoretical derivation of response to selection with and without controlled mating in honeybees.Genet Sel Evol. 2021 Feb 24;53(1):18. doi: 10.1186/s12711-021-00617-2. Genet Sel Evol. 2021. PMID: 33627061 Free PMC article. No abstract available.
-
Influence of model selection and data structure on the estimation of genetic parameters in honeybee populations.G3 (Bethesda). 2022 Feb 4;12(2):jkab450. doi: 10.1093/g3journal/jkab450. G3 (Bethesda). 2022. PMID: 35100384 Free PMC article.
References
-
- Gates BN. Honey bees in relation to horticulture. Trans Mass Hortic Soc. 1917;1:71–88.
-
- McGregor SE. Insect pollination of cultivated crop plants. Washington DC. 1976. https://static1.squarespace.com/static/5a849d4c8dd041c9c07a8e4c/t/5a9f12.... Accessed 12 Jan 2021.
-
- Uzunov A, Büchler R, Bienefeld K. Performance testing protocol. A guide for European honey bee breeders. Kirchhain; 2015. http://www.smartbeesfp7.eu/resources/Publications/2016/ENG_SMARTBEES-Pro.... Accessed 12 Jan 2021.
MeSH terms
Grants and funding
LinkOut - more resources
Full Text Sources
Other Literature Sources
