

PartSeg: a tool for quantitative feature extraction from 3D microscopy images for dummies
- PMID: 33596823
- PMCID: PMC7890960
- DOI: 10.1186/s12859-021-03984-1
PartSeg: a tool for quantitative feature extraction from 3D microscopy images for dummies
Abstract
Background: Bioimaging techniques offer a robust tool for studying molecular pathways and morphological phenotypes of cell populations subjected to various conditions. As modern high-resolution 3D microscopy provides access to an ever-increasing amount of high-quality images, there arises a need for their analysis in an automated, unbiased, and simple way. Segmentation of structures within the cell nucleus, which is the focus of this paper, presents a new layer of complexity in the form of dense packing and significant signal overlap. At the same time, the available segmentation tools provide a steep learning curve for new users with a limited technical background. This is especially apparent in the bulk processing of image sets, which requires the use of some form of programming notation.
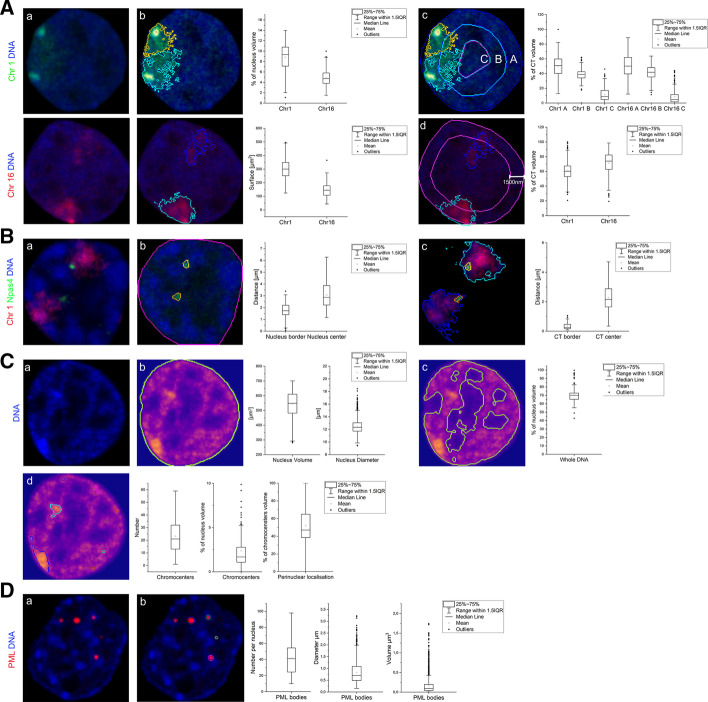
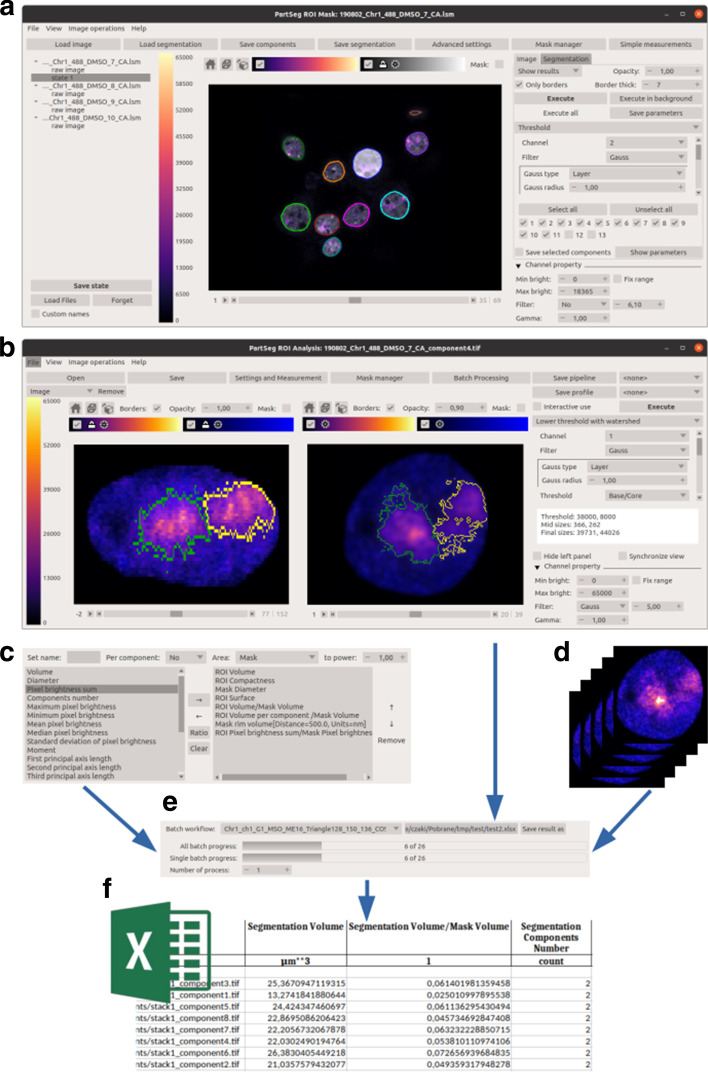
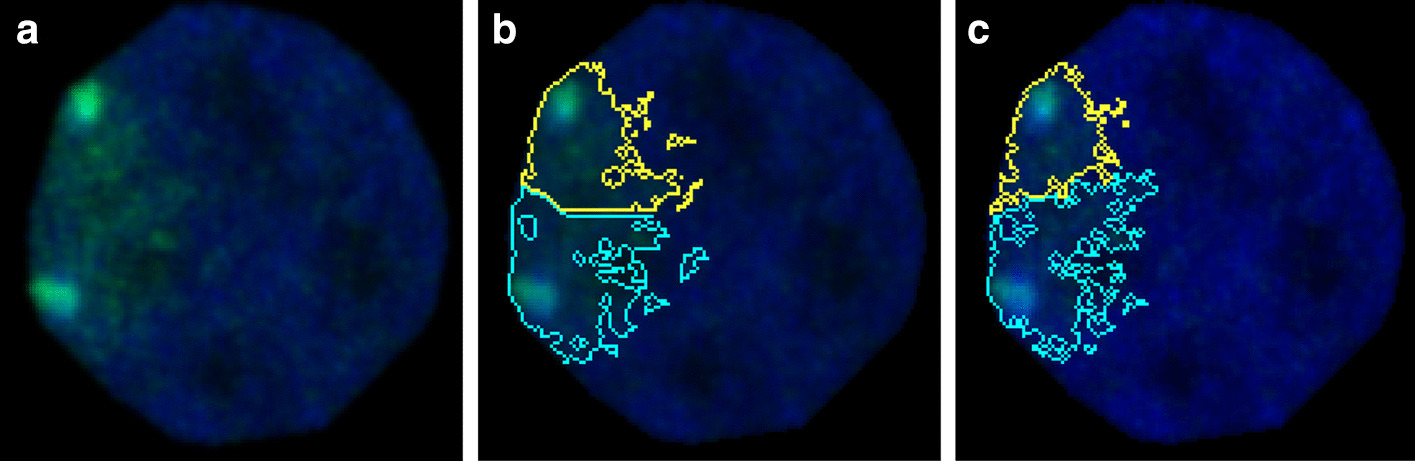
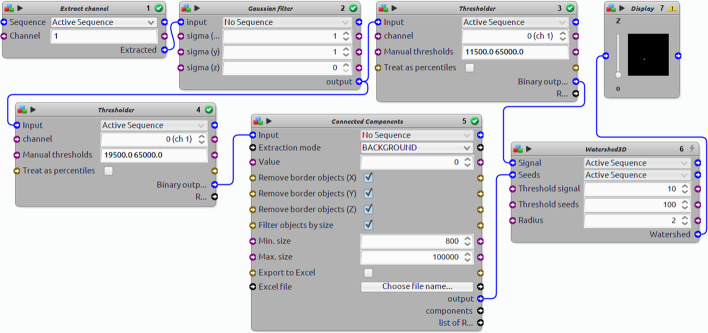
Results: In this paper, we present PartSeg, a tool for segmentation and reconstruction of 3D microscopy images, optimised for the study of the cell nucleus. PartSeg integrates refined versions of several state-of-the-art algorithms, including a new multi-scale approach for segmentation and quantitative analysis of 3D microscopy images. The features and user-friendly interface of PartSeg were carefully planned with biologists in mind, based on analysis of multiple use cases and difficulties encountered with other tools, to offer an ergonomic interface with a minimal entry barrier. Bulk processing in an ad-hoc manner is possible without the need for programmer support. As the size of datasets of interest grows, such bulk processing solutions become essential for proper statistical analysis of results. Advanced users can use PartSeg components as a library within Python data processing and visualisation pipelines, for example within Jupyter notebooks. The tool is extensible so that new functionality and algorithms can be added by the use of plugins. For biologists, the utility of PartSeg is presented in several scenarios, showing the quantitative analysis of nuclear structures.
Conclusions: In this paper, we have presented PartSeg which is a tool for precise and verifiable segmentation and reconstruction of 3D microscopy images. PartSeg is optimised for cell nucleus analysis and offers multi-scale segmentation algorithms best-suited for this task. PartSeg can also be used for the bulk processing of multiple images and its components can be reused in other systems or computational experiments.
Keywords: 3D FISH; 3D reconstruction; Batch processing; Bioimaging; Chromatin; Electron microscopy; Nucleus; Segmentation; Super-resolution microscopy.
Conflict of interest statement
Dariusz Plewczyński is Associate Editor of BMC Bioinformatics Journal. The other authors declare that they have no competing interests.
Figures
Similar articles
-
Fast segmentation of stained nuclei in terabyte-scale, time resolved 3D microscopy image stacks.PLoS One. 2014 Feb 27;9(2):e90036. doi: 10.1371/journal.pone.0090036. eCollection 2014. PLoS One. 2014. PMID: 24587204 Free PMC article.
-
Automatic three-dimensional segmentation of mouse embryonic stem cell nuclei by utilising multiple channels of confocal fluorescence images.J Microsc. 2021 Jan;281(1):57-75. doi: 10.1111/jmi.12949. Epub 2020 Aug 8. J Microsc. 2021. PMID: 32720710
-
CellECT: cell evolution capturing tool.BMC Bioinformatics. 2016 Feb 17;17:88. doi: 10.1186/s12859-016-0927-7. BMC Bioinformatics. 2016. PMID: 26887436 Free PMC article.
-
Benchmarking of deep learning algorithms for 3D instance segmentation of confocal image datasets.PLoS Comput Biol. 2022 Apr 14;18(4):e1009879. doi: 10.1371/journal.pcbi.1009879. eCollection 2022 Apr. PLoS Comput Biol. 2022. PMID: 35421081 Free PMC article. Review.
-
Deep learning -- promises for 3D nuclear imaging: a guide for biologists.J Cell Sci. 2022 Apr 1;135(7):jcs258986. doi: 10.1242/jcs.258986. Epub 2022 Apr 14. J Cell Sci. 2022. PMID: 35420128 Free PMC article. Review.
Cited by
-
Cecelia: a multifunctional image analysis toolbox for decoding spatial cellular interactions and behaviour.Nat Commun. 2025 Feb 24;16(1):1931. doi: 10.1038/s41467-025-57193-y. Nat Commun. 2025. PMID: 39994207 Free PMC article.
-
A multiparametric analysis including single-cell and subcellular feature assessment reveals differential behavior of spheroid cultures on distinct ultra-low attachment plate types.Front Bioeng Biotechnol. 2024 Aug 2;12:1422235. doi: 10.3389/fbioe.2024.1422235. eCollection 2024. Front Bioeng Biotechnol. 2024. PMID: 39157442 Free PMC article.
-
Promoter-pervasive transcription causes RNA polymerase II pausing to boost DOG1 expression in response to salt.EMBO J. 2023 Mar 1;42(5):e112443. doi: 10.15252/embj.2022112443. Epub 2023 Jan 27. EMBO J. 2023. PMID: 36705062 Free PMC article.
-
Secretomes of M1 and M2 macrophages decrease the release of neutrophil extracellular traps.Sci Rep. 2023 Sep 20;13(1):15633. doi: 10.1038/s41598-023-42167-1. Sci Rep. 2023. PMID: 37730741 Free PMC article.
-
The interplay of seizures-induced axonal sprouting and transcription-dependent Bdnf repositioning in the model of temporal lobe epilepsy.PLoS One. 2021 Jun 4;16(6):e0239111. doi: 10.1371/journal.pone.0239111. eCollection 2021. PLoS One. 2021. PMID: 34086671 Free PMC article.
References
-
- Dix A, Finlay J, Abowd GD, Beale R. Human computer interaction. 3. Harlow, England: Pearson Prentice Hall; 2003.
MeSH terms
Grants and funding
- TEAM to D.P./Fundacja na rzecz Nauki Polskiej
- 2014/15/B/ST6/05082/Narodowe Centrum Nauki
- 2019/35/O/ST6/02484/Narodowe Centrum Nauki
- 2020/37/B/NZ2/03757/Narodowe Centrum Nauki
- UMO-2014/15/N/NZ2/00379/Narodowe Centrum Nauki
- UMO-2015/18/E/NZ3/00730/Narodowe Centrum Nauki
- Enhpathy/H2020 Marie Sklodowska-Curie Actions
- 1U54DK107967-01/NH/NIH HHS/United States
- CSIR-HRDG, BT/PR16356/BID/7/596/2016/Goverment of India
- Research was funded by (POB Cybersecurity and data analysis) of Warsaw University of Technology within the Excellence Initiative: Research University (IDUB) programme/Politechnika Warszawska
LinkOut - more resources
Full Text Sources
Other Literature Sources
Research Materials
