. 2021 Feb 17;20(1):15.
doi: 10.1186/s12944-021-01437-5.

Identification of lipidomic profiles associated with drug-resistant prostate cancer cells

Affiliations

Identification of lipidomic profiles associated with drug-resistant prostate cancer cells

Lishann M Ingram et al. Lipids Health Dis. .

Abstract

Background: The association of circulating lipids with clinical outcomes of drug-resistant castration-resistant prostate cancer (DR-CRPC) is not fully understood. While it is known that increases in select lipids correlate to decreased survival, neither the mechanisms mediating these alterations nor the correlation of resistance to drug treatments is well characterized.

Methods: This gap-in-knowledge was addressed using in vitro models of non-cancerous, hormone-sensitive, CRPC and drug-resistant cell lines combined with quantitative LC-ESI-Orbitrap-MS (LC-ESI-MS/MS) lipidomic analysis and subsequent analysis such as Metaboanalyst and Lipid Pathway Enrichment Analysis (LIPEA).

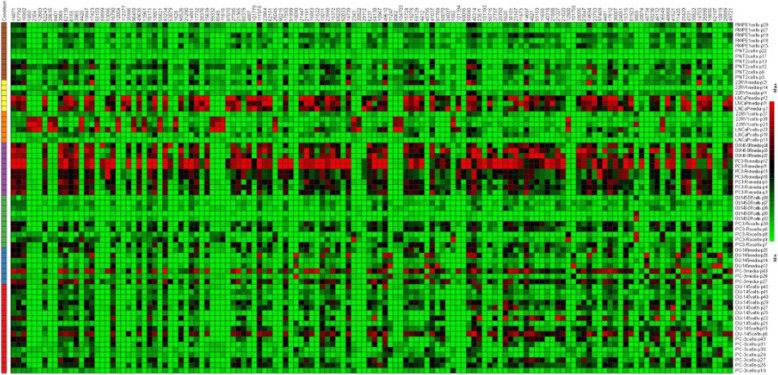
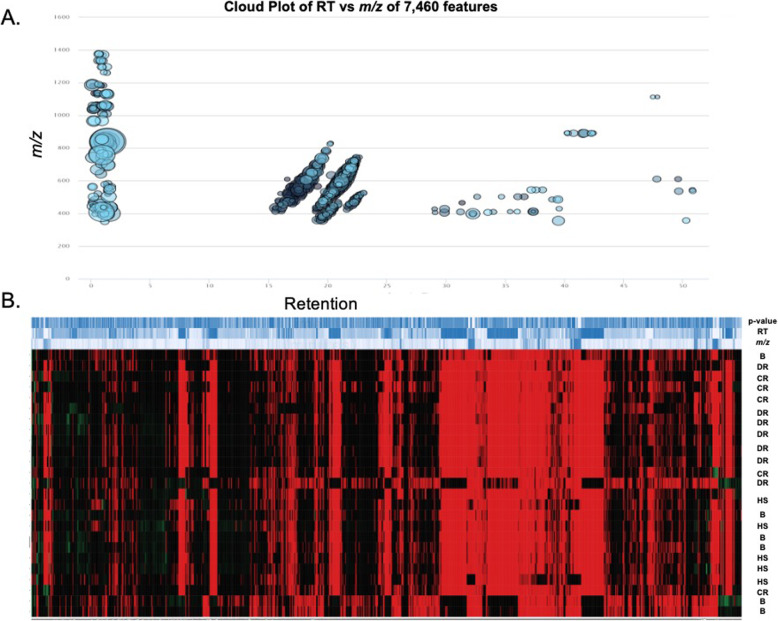
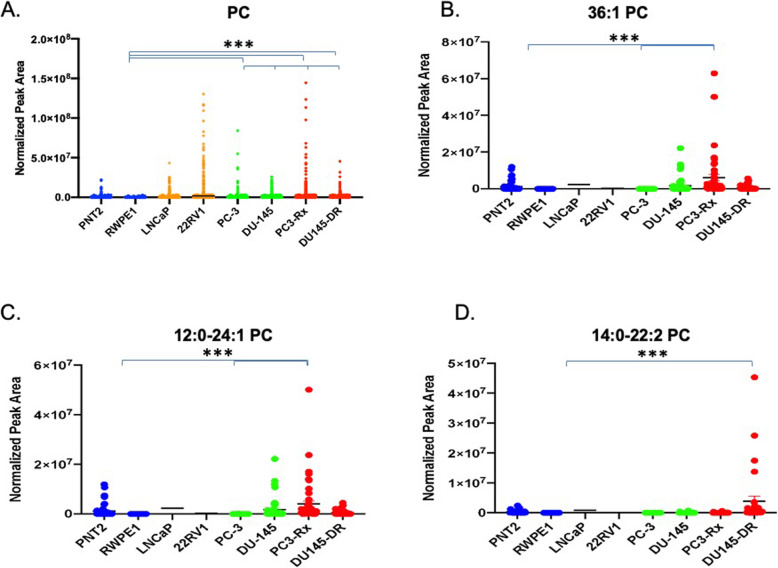
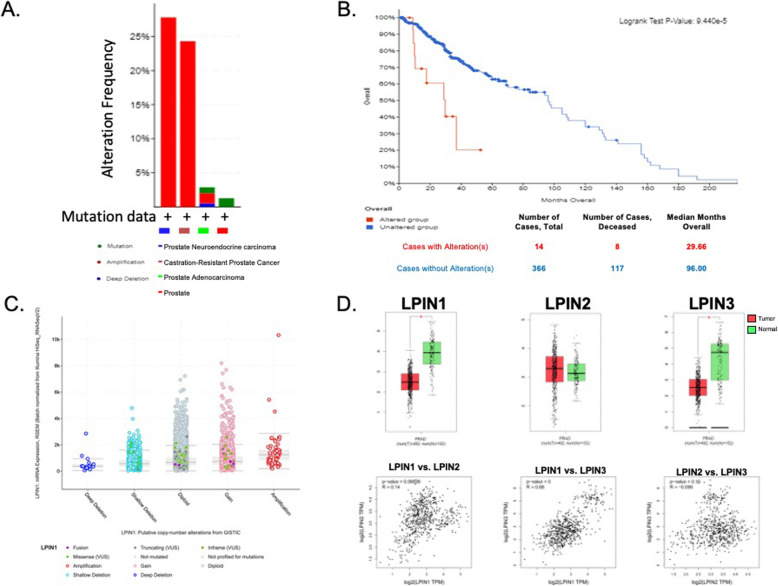
Results: Several lipid regulatory pathways were identified that are associated with Docetaxel resistance in prostate cancer (PCa). These included those controlling glycerophospholipid metabolism, sphingolipid signaling and ferroptosis. In total, 7460 features were identified as being dysregulated between the cell lines studied, and 21 lipid species were significantly altered in drug-resistant cell lines as compared to nonresistant cell lines. Docetaxel resistance cells (PC3-Rx and DU145-DR) had higher levels of phosphatidylcholine (PC), oxidized lipid species, phosphatidylethanolamine (PE), and sphingomyelin (SM) as compared to parent control cells (PC-3 and DU-145). Alterations were also identified in the levels of phosphatidic acid (PA) and diacylglyceride (DAG), whose levels are regulated by Lipin (LPIN), a phosphatidic acid phosphatase that converts PA to DAG. Data derived from cBioPortal demonstrated a population of PCa patients expressing mutations aligning with amplification of LPIN1, LPIN2 and LPIN3 genes. Lipin amplification in these genes correlated to decreased survival in these patients. Lipin-1 mRNA expression also showed a similar trend in PCa patient data. Lipin-1, but not Lipin-2 or - 3, was detected in several prostate cancer cells, and was increased in 22RV1 and PC-3 cell lines. The increased expression of Lipin-1 in these cells correlated with the level of PA.

Conclusion: These data identify lipids whose levels may correlate to Docetaxel sensitivity and progression of PCa. The data also suggest a correlation between the expression of Lipin-1 in cells and patients with regards to prostate cancer cell aggressiveness and patient survivability. Ultimately, these data may be useful for identifying markers of lethal and/or metastatic prostate cancer.

Keywords: Drug resistance; Lipid metabolism; Lipid species; Lipidomics; Lipids; Mass spectrometry; Metastasis; Prostate; Prostate Cancer.


Conflict of interest statement

The authors declare no conflict of interest.

Figures

Fig. 1
Fig. 1
Heat map of differentially altered metabolites associated with non-cancerous (PNT2 and RWPE1), hormone-sensitive (LNCaP and 22RV1), castration-resistant (PC-3 and DU-145) and Docetaxel resistant (PC3-Rx and DU145-DR) prostate cell lines and media as determined by LC-ESI-MS/MS. Data were derived from a minimum of 3 extractions from 3 different passages per cell line
Fig. 2
Fig. 2
LIPEA pathway analysis. Identification of lipids pathways enriched in prostate cancer cells (LNCaP, 22RV1, PC-3, DU-145, PC3-Rx and DU145-DR) as compared to non-cancerous cells (PNT2 and RWPE1). Data were derived from a minimum of 3 extractions from 3 different passages, where increases in lipids were mapped to genes identified in the KEGG database
Fig. 3
Fig. 3
Alterations of phospholipid and acyl glycerol classes were observed in non-cancerous prostate cells (blue), hormone-sensitive (dark red), castration-resistant (CR) (green), and Docetaxel resistant (DR) (red) prostate cancer cells. LC-ESI-MS/MS analysis of these classes in comparison to the Kennedy Pathway demonstrates alterations of the lipid abundance within progressing prostate cancer cells. The enzymes mediating the remodeling are shown in blue along the arrows. CHPT1 Cholinephosphotransferase 1, CEPT1 Choline/ethanolaminephosphotransferase 1, DAG diacylglycerol, DGAT diacylglycerol acyltransferase, PA phosphatidic acid, PAP phosphatidic acid phosphatase, PC phosphatidylcholine, PLD Phospholipase D, PE phosphatidylethanolamine, PEMT Phosphatidylethanolamine-N-methyltransferase, PG phosphatidylglycerol, PGP phosphatidylglycerol phosphatase, PS phosphatidylserine, PSS1/ PSS2 phosphatidylserine synthase, PISD Phosphatidylserine decarboxylases, TAG triacylglycerol
Fig. 4
Fig. 4
a Differential cloud plot demonstrating dysregulated features between hormone-sensitive, castration-resistant, Docetaxel resistant cells and non-cancerous cells (PNT2 and RWPE1) as determined by LC-ESI-MS/MS (P-value < 0.05 threshold, fold change > 1.5 threshold). b Differential expression of lipid features in non-cancerous prostate cells (b) as compared to hormone-sensitive (HS), castration-resistant (CR) and Docetaxel resistant (DR) prostate cancer cells. Only those features whose levels vary significantly (P < 0.05) are projected on the heat map. Each row represents a metabolite feature and each column represents a sample
Fig. 5
Fig. 5
Comparison of phosphatidylcholine (PC) in non-cancerous (PNT2 and RWPE1) and hormone-sensitive (LNCaP and 22RV1), castration-resistant (PC-3 and DU-145) and Docetaxel resistant (PC3-Rx and DU145-DR) prostate cell lines. Data are indicative of 6 samples (6 distinct passages) per group and are expressed as mean ± the SEM (*q < 0.05 **q < 0.01*** q < 0.001). Each symbol represents an individual lipid feature as identified by MS/MS. Normalized peak areas between all cells are shown for a phosphatidylcholine (PC), b 36:1 PC c 12:0–24:1 PC and d 14:0-22:2 PC
Fig. 6
Fig. 6
Comparison of a 38:4 and b 18:0–22:6 PC levels in non-cancerous (PNT2 and RWPE1), hormone-sensitive (LNCaP and 22RV1), castration-resistant (PC-3 and DU-145) and Docetaxel resistant (PC3-Rx and DU145-DR) prostate cell lines. Data are indicative of 6 samples (6 distinct passages) per group and are expressed as mean ± the SEM (*q < 0.05 **q < 0.01*** q < 0.001). Each symbol represents an individual lipid feature as identified by MS/MS
Fig. 7
Fig. 7
Comparison of a lysophosphocholine (LPC), b LPC and c 20:4 LPC levels in non-cancerous (PNT2 and RWPE1), hormone-sensitive (LNCaP and 22RV1), castration-resistant (PC-3 and DU-145) and Docetaxel resistant (PC3-Rx and DU145-DR) prostate cell lines. Data are indicative of 6 samples (6 distinct passages) per group and are expressed as mean ± the SEM (*q < 0.05 **q < 0.01*** q < 0.001). Each symbol represents an individual lipid feature as identified by MS/MS
Fig. 8
Fig. 8
Comparison of oxidized phosphatidylcholines (OxPC) levels in non-cancerous (PNT2 and RWPE1), hormone-sensitive (LNCaP and 22RV1), castration-resistant (PC-3 and DU-145) and Docetaxel resistant (PC3-Rx and DU145-DR) prostate cell lines and media. Data are indicative of 6 samples (6 distinct passages) per group and are expressed as mean ± the SEM (*q < 0.05 **q < 0.01*** q < 0.001). Each symbol represents an individual lipid feature as identified by MS/MS. Normalized peak areas between all cells are shown for a oxidized phosphatidylcholine (OxPC), b oxidized lysophosphatidylcholine (OxLPC)
Fig. 9
Fig. 9
Comparison of phosphatidylethanolamine (PE) levels in non-cancerous (PNT2 and RWPE1), hormone-sensitive (LNCaP and 22RV1), castration-resistant (PC-3 and DU-145) and Docetaxel resistant (PC3-Rx and DU145-DR) prostate cell lines and media. Data are indicative of 6 samples (6 distinct passages) per group and are expressed as mean ± the SEM (*q < 0.05 **q < 0.01*** q < 0.001). Each symbol represents an individual lipid feature as identified by MS/MS. Normalized peak areas between all cells are shown for phosphatidylethanolamine (PE), b OxPE
Fig. 10
Fig. 10
Comparison of sphingomyelin (SM) levels in non-cancerous (PNT2 and RWPE1), hormone-sensitive (LNCaP and 22RV1), castration-resistant (PC-3 and DU-145) and Docetaxel resistant (PC3-Rx and DU145-DR) prostate cell lines and media. Data are indicative of 6 samples (6 distinct passages) per group and are expressed as mean ± the SEM (*q < 0.05 **q < 0.01*** q < 0.001). Each symbol represents an individual lipid feature as identified by MS/MS. Normalized peak areas between all cells are shown for a sphingomyelin (SM) and b 34:1 + H SM
Fig. 11
Fig. 11
a Alterations in lipin genes LPIN1, LPIN2 and LPIN3 within four types of prostate cancer from sixteen studies. Amplification is the major alteration in all types, excluding general prostate cancer. b Overall survivability in prostate cancer patients with (red) or without (blue) lipin gene alteration. There are 28 samples with alterations in LPIN1, 37 samples from 30 patients with alterations in LPIN2 and 27 samples out of 26 patients with LPIN3 alterations. c mRNA expression, accurate transcript quantification from RNA-Seq data (RSEM) as a function of putative copy-number alterations in mutation type. There are 10,712 samples from 32 studies on the horizontal axis, 6961 samples from 16 studies on the vertical axis and 6909 samples from 16 studies at the intersection of the two axes. The figures were generated from cBioPortal for Cancer Genomics. d Variation in expression levels of lipin genes were observed in patients with (red) and without (green) prostate cancer. The method for differential analysis was a one-way ANOVA, using disease state (Tumor or Normal) as variable for calculating differential expression. Pair-wise gene expression correlations, using the Pearson method, of the lipin genes were analyzed based on TCGA and GTEx databases. The non-log scale for calculation and use the log-scale axis for visualization. The figures were generated from GEPIA 2. PRAD prostate adenocarcinoma, T tumor, N normal, TPM transcripts per million
Fig. 12
Fig. 12
a Western blot for Lipin-1 (~ 125 kDa) and GAPDH expression (~ 36 kDa) in non-cancerous prostate cells (PNT2 and RWPE-1), hormone-sensitive (LNCaP and 22RV1), castration-resistant (CR) (PC-3 and DU-145), Docetaxel resistant (DR) (PC3-RX and DU145-DR) prostate cells and hepatocellular carcinoma (HepG2) cells (positive control). Immunoblots are representative of at least 3 (n = 3) separate experiments using 3 separate passages. b Densitometry of Lipin-1 protein normalized to GAPDH within non-cancerous prostate cells (blue), hormone-sensitive (orange), castration-resistant (CR) (green), Docetaxel resistant (DR) (red) prostate, and hepatocellular carcinoma (black) cell lines

Similar articles

Cited by

References

    1. Chandrasekar T, et al. Mechanisms of resistance in castration-resistant prostate cancer (CRPC) Transl Androl Urol. 2015;4(3):365–380. - PMC - PubMed
    1. George DJ, Kantoff PW, Lin DW. New and emerging treatments for advanced prostate cancer. Clin Adv Hematol Oncol. 2011;9(6 Suppl 12):1–15. - PubMed
    1. Hultsch S, et al. Association of tamoxifen resistance and lipid reprogramming in breast cancer. BMC Cancer. 2018;18(1):850. doi: 10.1186/s12885-018-4757-z. - DOI - PMC - PubMed
    1. Cheng C, et al. Glucose-mediated N-glycosylation of SCAP is essential for SREBP-1 activation and tumor growth. Cancer Cell. 2015;28(5):569–581. doi: 10.1016/j.ccell.2015.09.021. - DOI - PMC - PubMed
    1. Guo, D., et al., EGFR signaling through an Akt-SREBP-1–dependent, rapamycin-resistant pathway sensitizes glioblastomas to antilipogenic therapy. Sci. Signal., 2009. 2(101): p. ra82-ra82. - PMC - PubMed

MeSH terms

LinkOut - more resources