. 2021 Feb 17;23(1):25.
doi: 10.1186/s13058-021-01404-z.

Multi-modal imaging of high-risk ductal carcinoma in situ of the breast using C2Am: a targeted cell death imaging agent

Affiliations

Multi-modal imaging of high-risk ductal carcinoma in situ of the breast using C2Am: a targeted cell death imaging agent

Zoltan Szucs et al. Breast Cancer Res. .

Erratum in

Abstract

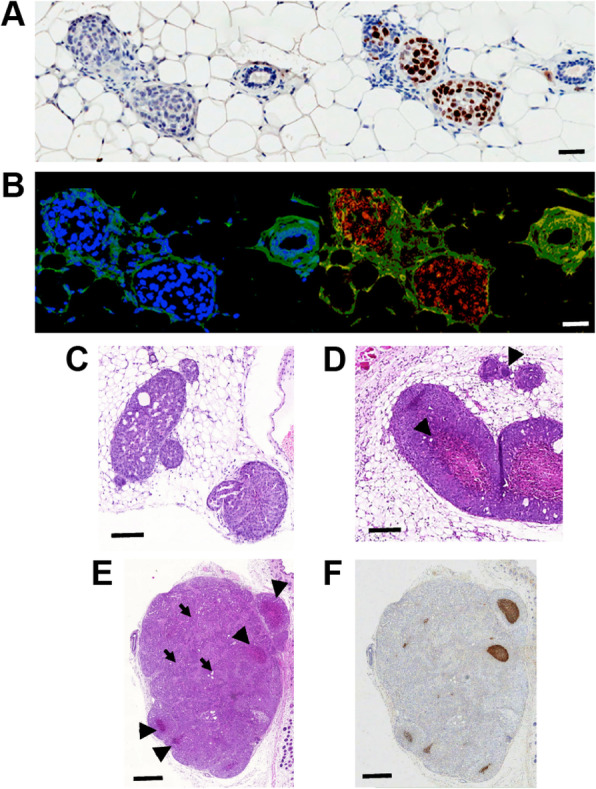
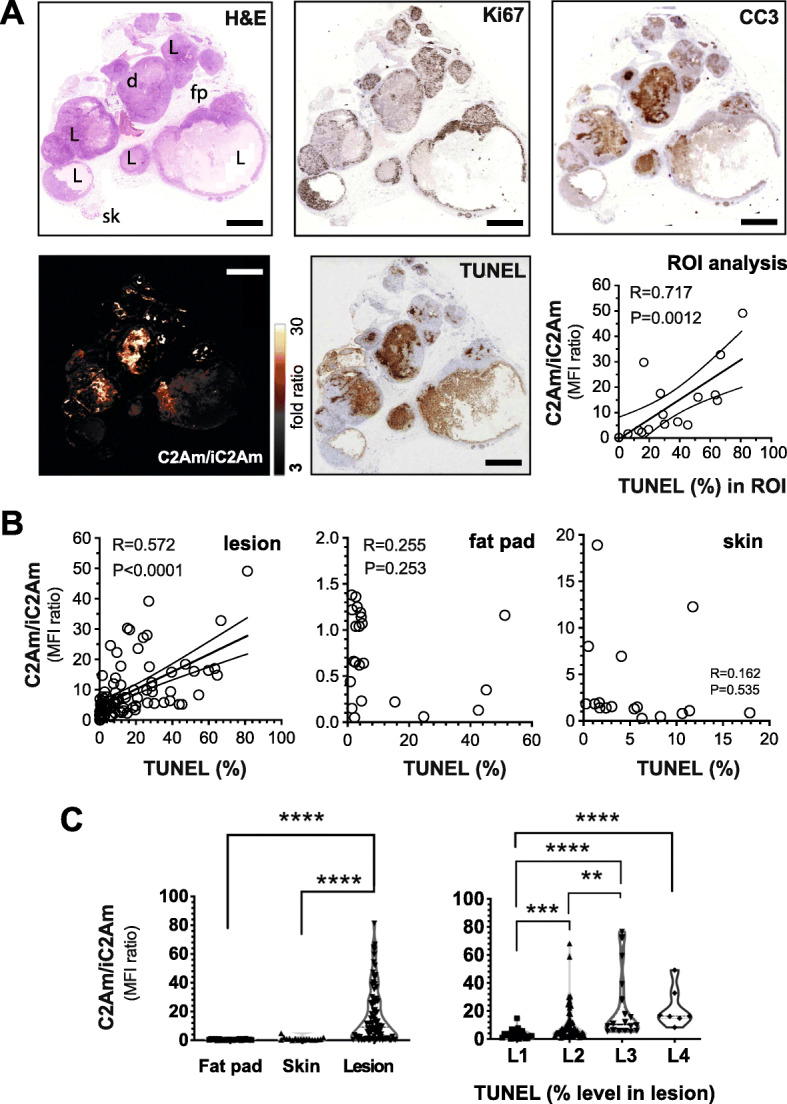
Background: Ductal carcinoma in situ (DCIS) is a non-invasive form of early breast cancer, with a poorly understood natural history of invasive transformation. Necrosis is a well-recognized adverse prognostic feature of DCIS, and non-invasive detection of its presence and spatial extent could provide information not obtainable by biopsy. We describe here imaging of the distribution and extent of comedo-type necrosis in a model of human DCIS using C2Am, an imaging agent that binds to the phosphatidylserine exposed by necrotic cells.

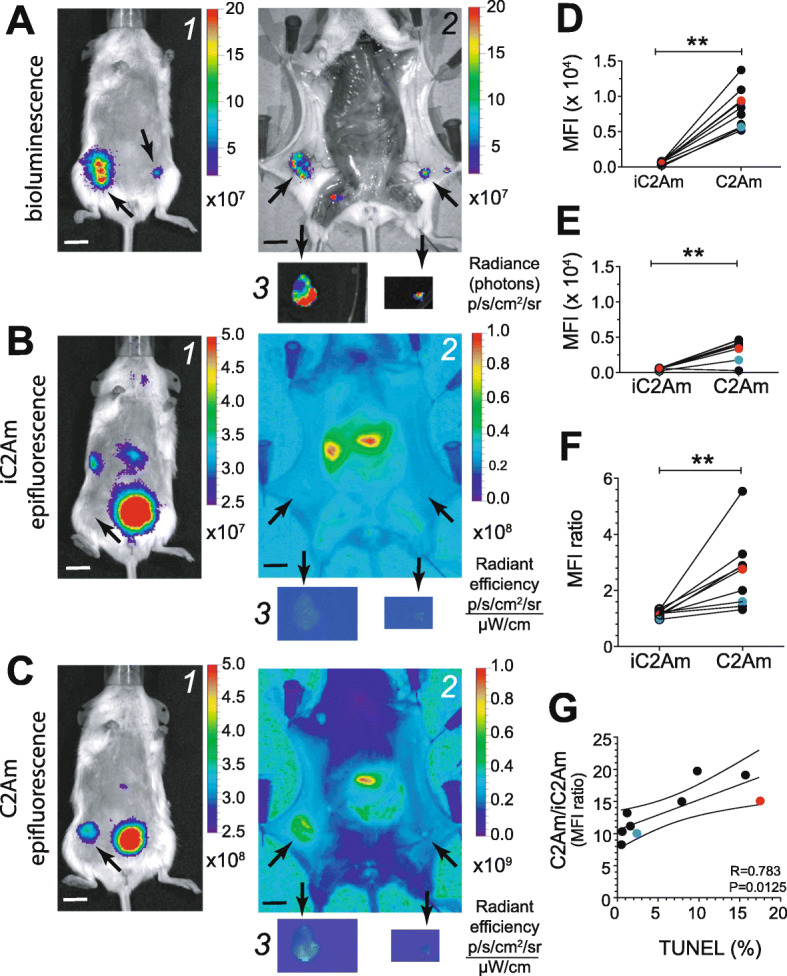
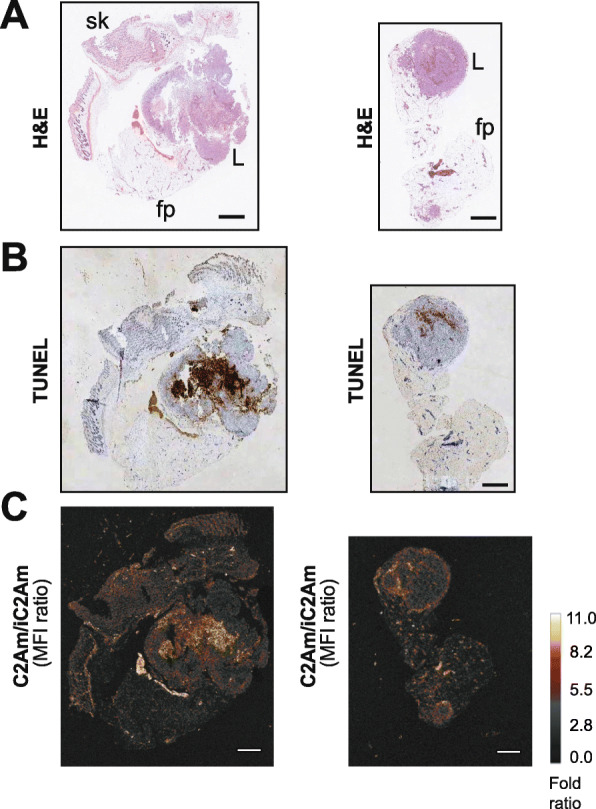
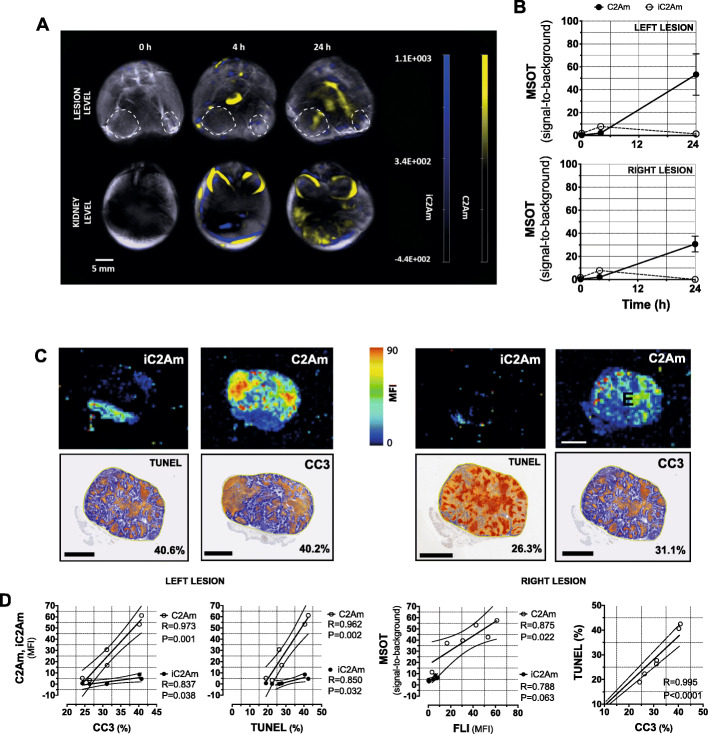
Methods: We used an established xenograft model of human DCIS that mimics the histopathological features of the disease. Planar near-infrared and optoacoustic imaging, using fluorescently labeled C2Am, were used to image non-invasively the presence and extent of lesion necrosis.

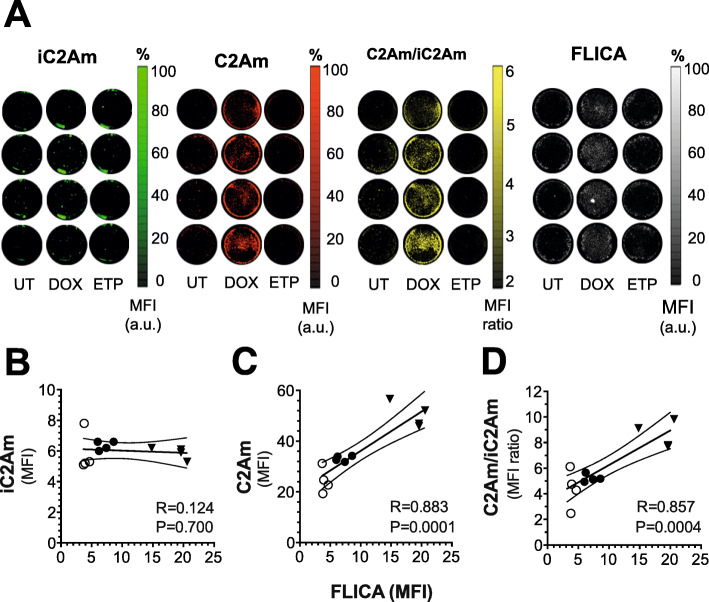
Results: C2Am showed specific and sensitive binding to necrotic areas in DCIS tissue, detectable both in vivo and ex vivo. The imaging signal generated in vivo using near-infrared (NIR) fluorescence imaging was up to 6-fold higher in DCIS lesions than in surrounding fat pad or skin tissue. There was a correlation between the C2Am NIR fluorescence (Pearson R = 0.783, P = 0.0125) and optoacoustic signals (R > 0.875, P < 0.022) in the DCIS lesions in vivo and the corresponding levels of cell death detected histologically.

Conclusions: C2Am is a targeted multi-modal imaging agent that could complement current anatomical imaging methods for detecting DCIS. Imaging the presence and spatial extent of necrosis may give better prognostic information than that obtained by biopsy alone.

Keywords: DCIS; Early detection; Multi-modal imaging; Necrosis; Optoacoustic.


Conflict of interest statement

C2Am is under a licensing agreement with Cambridge Enterprise and has been patented (US2011/0038798). Some of the authors of this study (AAN and KMB) are co-inventors on this patent. No other potential conflict of interest relevant to this article was reported.

Figures

Fig. 1
Fig. 1
Histopathological evaluation of an intraductally transplanted model of DCIS (MCF10ADCIS). Two weeks post-implantation (a, b), solid-type intraductal growth of MCF10ADCIS cells showed no staining with an antibody targeted at mouse Ki-67 but positive staining with an antibody targeted at the human protein (a, brown stain). DAPI staining (a, b, blue) identified both human and mouse epithelial cells whereas a FISH probe for human centromeres (b, red) identified cells of human origin on an autofluorescent (green) tissue background. Histopathology of DCIS lesions 8 weeks post-implantation (c, d); cribriform architecture of a MCF10ADCIS xenograft (c); comedo-type necrosis in a MCF10ADCIS xenograft lesion (d, arrowheads), with central necrotic areas. Comedo-necrosis type features of MCF10ADCIS xenografts 8 weeks post-implantation (e, f); comedo-type DCIS-like (e, arrowheads) and invasive (e, arrows) structures on H&E; corresponding TUNEL staining (f), showing viable (gray) and necrotic (brown) regions of tissue. Scale bars = 200 μm (a, b); 350 μm (c, d); 800 μm (e, f)
Fig. 2
Fig. 2
Detection of MCF10ADCIS cell death in vitro using C2Am. Cells were treated with chemotherapeutic drugs (doxorubicin or etoposide) and incubated with either an equimolar mixture of C2Am|iC2Am or with a fluorescent inhibitor of effector caspases (FLICA) as a reference gold standard. Plates (a) were scanned at different excitation/emission wavelengths: iC2Am (650/680 nm), C2Am (780/800 nm), and FLICA (450/480 nm). Correlations of iC2Am staining (b), C2Am staining (c), and the ratio C2Am/iC2Am (d) with FLICA staining. UT-untreated (open circles), DOX-doxorubicin (inverted triangles), and ETP-etoposide-treated (filled circles) cells. C2Am and iC2Am were labeled with DyLigh-750 and AlexaFluor-650, respectively (see Supplementary Figure S1 and Methods). FLICA-fluorescent inhibitor of effector caspases. n = 4 technical replicates per experimental condition, 2 independent experiments
Fig. 3
Fig. 3
Fluorescence imaging of native cell death in the MCF10ADCIS model of human DCIS. Bioluminescence (BLI, A) and epifluorescence images (FLI; B, C) of a representative mouse implanted intraductally with MCF10ADCIS cells. Four to 8 weeks post-implantation, lesions (black arrows) were visible in vivo by BLI (A) and the larger lesion by FLI of C2Am in vivo (C1, arrow) and both lesions ex vivo (C2, arrows), but neither were visible by FLI of iC2Am in vivo (B1, arrow) or easily distinguishable ex vivo (B2, arrows). Lesion (D), fat pad (E), and lesion/fat pad ratios (F) of mean fluorescence intensity (MFI) were calculated for C2Am and iC2Am. The C2Am/iC2Am MFI ratio was also calculated for lesions and correlated with the levels of cell death, quantified by TUNEL staining of excised lesion sections (G). The images ex vivo (AC: 2, 3) show the two lesions in situ in the mouse (A2, B2, C2, arrows) and the same lesions post-resection (A3, B3, C3) on a plate. Wilcoxon matched-pair analysis, red and blue dots (DG) correspond to imaging data shown in (AC), for left-side (red) and right-side (blue) lesions. **P < 0.005 (DF). n = 5 mice, 9 lesions
Fig. 4
Fig. 4
Immunohistochemistry of MCF10ADCIS lesions. Representative sections from the two lesions (left and right side, respectively) resected from the mice shown in Fig. 3a-c, H&E (a); TUNEL (b), and C2Am/iC2Am ratiometric fluorescence image (c). L, lesion; fp, fat pad; sk, skin. Scale bars = 1.0 mm
Fig. 5
Fig. 5
Immunohistochemistry of MCF10ADCIS lesions. Serial histological sections (a) of one representative MCF10ADCIS lesion resected 8 weeks post-intraductal cell implantation. H&E, Ki-67, CC3, TUNEL, and C2Am/iC2Am ratiometric fluorescence signals are shown. Chart (a), correlation of the C2Am/iC2Am ratiometric signal with the percentage of cell death, determined by TUNEL assay, for regions of interest (ROI) of the lesion shown in a. L, lesion; fp, fat pad; sk, skin. Correlation of C2Am/iC2Am ratiometric signal (b) from multiple lesions, fat pad, and skins from several mice with the corresponding levels of TUNEL staining. C2Am/iC2Am ratiometric signal (c) in multiple fat pad, skin, and lesions. L1: < 10% TUNEL positivity, L2: 10–25%, L3: 25–50%, L4: > 50%. b, c, n = 10 mice, 89 lesions, 22 fat pad, 17 skin samples. c Two-tailed, t test, unequal variance. **P < 0.005, ***P < 0.001, ****P < 0.0001. Scale bars (a) = 2 mm
Fig. 6
Fig. 6
Multi-modal imaging of native cell death in the MCF10ADCIS model of human DCIS. Two lesions were implanted in the lower mammary glands of three mice. Time series of axial optoacoustic images of C2Am and iC2Am, at the level of the lesion (a, top), and kidneys (a, bottom) in a representative animal. Time courses of optoacoustic (MSOT) signal in the two lesions are shown (b). Fluorescence imaging (FLI) ex vivo (c, top) of histological sections of the lesions shown in a. Histological sections (c, bottom) of lesions in a stained for CC3 and TUNEL; areas of staining (orange/brown) are highlighted against background signal (blue); level of cell death in the lesion is shown (lower right, %). Pearson correlation analyses (d) of C2Am and iC2Am optoacoustic signals with CC3 and TUNEL staining, of C2Am and iC2Am optoacoustic signals with the corresponding fluorescence signals, and of TUNEL staining with CC3 staining. Open circles (C2Am); closed circles (iC2Am). n = 3 mice, 6 lesions. Scale bars (a, b) = 10 mm, (c, d) = 4 mm. Dashed lines (a, top) indicate lesion location

Similar articles

Cited by

References

    1. Siegel RL, Miller KD, Jemal A. Cancer statistics, 2019. CA Cancer J Clin. 2019;69:7. doi: 10.3322/caac.21551. - DOI - PubMed
    1. Morris E, Feig SA, Drexler M, Lehman C. Implications of overdiagnosis: impact on screening mammography practices. Popul Health Manag. 2015;18(Suppl 1):S3. doi: 10.1089/pop.2015.29023.mor. - DOI - PMC - PubMed
    1. Lauby-Secretan B, Scoccianti C, Loomis D, Benbrahim-Tallaa L, Bouvard V, Bianchini F, et al. Breast-cancer screening--viewpoint of the IARC Working Group. N Engl J Med. 2015;372:2353. doi: 10.1056/NEJMsr1504363. - DOI - PubMed
    1. Shah C, Wobb J, Manyam B, Kundu N, Arthur D, Wazer D, et al. Management of ductal carcinoma in situ of the breast: a review. JAMA Oncol. 2016;2:1083. doi: 10.1001/jamaoncol.2016.0525. - DOI - PubMed
    1. Thomas J, Hanby A, Pinder SE, Ball G, Lawrence G, Maxwell A, et al. Adverse surgical outcomes in screen-detected ductal carcinoma in situ of the breast. Eur J Cancer. 2014;50:1880. doi: 10.1016/j.ejca.2014.02.023. - DOI - PubMed

Publication types

MeSH terms