. 2021 Feb 17;40(1):69.
doi: 10.1186/s13046-021-01862-5.

The FAM3C locus that encodes interleukin-like EMT inducer (ILEI) is frequently co-amplified in MET-amplified cancers and contributes to invasiveness

Affiliations

The FAM3C locus that encodes interleukin-like EMT inducer (ILEI) is frequently co-amplified in MET-amplified cancers and contributes to invasiveness

Ulrike Schmidt et al. J Exp Clin Cancer Res. .

Abstract

Background: Gene amplification of MET, which encodes for the receptor tyrosine kinase c-MET, occurs in a variety of human cancers. High c-MET levels often correlate with poor cancer prognosis. Interleukin-like EMT inducer (ILEI) is also overexpressed in many cancers and is associated with metastasis and poor survival. The gene for ILEI, FAM3C, is located close to MET on chromosome 7q31 in an amplification "hotspot", but it is unclear whether FAMC3 amplification contributes to elevated ILEI expression in cancer. In this study we have investigated FAMC3 copy number gain in different cancers and its potential connection to MET amplifications.

Methods: FAMC3 and MET copy numbers were investigated in various cancer samples and 200 cancer cell lines. Copy numbers of the two genes were correlated with mRNA levels, with relapse-free survival in lung cancer patient samples as well as with clinicopathological parameters in primary samples from 49 advanced stage colorectal cancer patients. ILEI knock-down and c-MET inhibition effects on proliferation and invasiveness of five cancer cell lines and growth of xenograft tumors in mice were then investigated.

Results: FAMC3 was amplified in strict association with MET amplification in several human cancers and cancer cell lines. Increased FAM3C and MET copy numbers were tightly linked and correlated with increased gene expression and poor survival in human lung cancer and with extramural invasion in colorectal carcinoma. Stable ILEI shRNA knock-down did not influence proliferation or sensitivity towards c-MET-inhibitor induced proliferation arrest in cancer cells, but impaired both c-MET-independent and -dependent cancer cell invasion. c-MET inhibition reduced ILEI secretion, and shRNA mediated ILEI knock-down prevented c-MET-signaling induced elevated expression and secretion of matrix metalloproteinase (MMP)-2 and MMP-9. Combination of ILEI knock-down and c-MET-inhibition significantly reduced the invasive outgrowth of NCI-H441 and NCI-H1993 lung tumor xenografts by inhibiting proliferation, MMP expression and E-cadherin membrane localization.

Conclusions: These novel findings suggest MET amplifications are often in reality MET-FAM3C co-amplifications with tight functional cooperation. Therefore, the clinical relevance of this frequent cancer amplification hotspot, so far dedicated purely to c-MET function, should be re-evaluated to include ILEI as a target in the therapy of c-MET-amplified human carcinomas.

Keywords: C-MET; Cancer; FAM3C; Gene amplification; Interleukin-like EMT inducer (ILEI); Invasion; Matrix metalloproteinase (MMP).


Conflict of interest statement

The authors declare that they have no competing interests.

Figures

Fig. 1
Fig. 1
FAM3C and MET CNs are tightly linked, correlate with gene expression and survival in lung cancer. a, d Summary of MET, FAM3C, EGFR and FGFR1 copy number calls extracted from lung squamous cell carcinoma (LUSC, a) and lung adenocarcinoma (LUAD, d) TCGA datasets. Genomic localization is marked above the genes. GISTIC 2.0 values were obtained from the cBio database (http://www.cbioportal.org/): − 2, deep deletion (DD); − 1, shallow deletion (SD); 0, diploid (Dipl); 1, gain; 2, amplification (Amp). Numbers within the boxes refer to the number of tumors within a group. Orange connection lines indicate tumor samples with FAM3C gain or amplification. Correlation was calculated using Kendall’s tau-b test. b, e mRNA expression levels of MET and FAM3C copy number calls defined in A and D. Statistical significance was determined by one-way analysis of variance (ANOVA) followed by Dunn’s multiple comparison adjustment and marked with asterisks (*p < 0.05; **p < 0.01; ***p < 0.001; ****p < 0.0001). c, f Kaplan-Meier plot on relapse-free survival of LUSCC (c) and LUAD (f) patients without (DD_SD-Dipl_Gain) and with (Amp) FAM3C and MET amplification
Fig. 2
Fig. 2
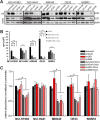
Increased FAM3C and MET CNs are frequently combined and present in human cancer cell lines. a Percentage of cell lines bearing increased FAM3C and/or MET gene CNs (amplification cut-off was set CN ≥ 3) determined by GeneChip® Mapping Assay in a panel of 200 cancer cell lines of diverse tissue origin. Left panel (#), percentage of cell lines with increased FAM3C and/or MET CNs; right panel (##), percentage of combined FAM3C and MET CN increase within the FAM3C- and/or MET-amplified cell lines. Number of analyzed cell lines for each tumor entity are listed on the right side. Correlation, marked for LUNG, BREAST, COLON and TOTAL, was calculated using Kendall’s tau-b test. WBC; white blood cell. b Short-list of five selected human tumor cell lines from panel A with increased FAM3C and MET CNs and different sensitivity to the MET inhibitor PHA665752. MET CNs in brackets and % viability after PHA665752 treatment are taken from [19]. c Western blot analysis of ILEI secretion into conditioned media (CM) and expression within the cells and MET and Erk expression and activity in above five selected cell lines. MCF-7 and MDA-MB-231 human breast cancer cell lines were used as normal FAM3C CN controls with low and high ILEI expression
Fig. 3
Fig. 3
ILEI KD does not influence proliferation and sensitivity towards c-MET-inhibiton-induced arrest in FAM3C-MET-amplified cancer cells. a Western blot analysis of ILEI secretion into conditioned media (CM) and expression in the five selected cell lines (parental) and their non-targeting (shCont) and ILEI (sh261 and sh506) shRNA KD derivatives. The two independent ILEI KD lines sh261 and sh506 are named based on the starting position of the shRNA targeting site in the ILEI mRNA. b Proliferation behavior of the five tumor cell lines in the presence of increasing concentrations of crizotinib determined by thymidine incorporation assay. Error bars represent SEM of three independent replicates. c in vitro proliferation capacity of the five selected human tumor cell lines and their control and ILEI shRNA KD derivatives after 24 h vehicle or crizotinib (500 nM) treatment determined by MTT assay. Each cell line is normalized to its own parental vehicle-treated control. Error bars represent SEM of three to six independent assays. Statistical significance was determined by one-way ANOVA and marked with asterisks (*p < 0.05; **p < 0.01; ***p < 0.001)
Fig. 4
Fig. 4
ILEI KD impairs both c-MET-independent and c-MET-dependent invasion of cancer cells with FAM3C-MET amplification. a, b Invasion capacity of the five selected tumor cell lines (parental) and of their non-targeting (shCont) and ILEI (sh261 and sh506) shRNA KD derivatives upon 24 h vehicle or crizotinib (500 nM) treatment determined by trans-well invasion assay using (a) conditioned medium of NIH3T3 cells or (b) human recombinant HGF (40 ng/ml) as chemoattractant. Each cell line is normalized to its own parental vehicle-treated control. Error bars represent SEM of three independent assays. Statistical significance was determined by one-way ANOVA and marked with asterisks (*p < 0.05; **p < 0.01; ***p < 0.001; ****p < 0.0001)
Fig. 5
Fig. 5
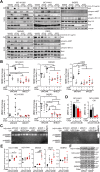
HGF-induced expression and secretion of MMPs requires ILEI, efficient ILEI secretion requires c-MET signaling. a Western blot analysis of ILEI secretion and expression, and c-MET and Erk activity and expression in the five selected cell lines (parental) and their control (shCont) and ILEI KD (sh261 and sh506) derivatives after crizotinib (500 nM) treatment for 24 h. b qPCR analysis of MMP-9 (for NCI-H441, MKN45 and OE33) and MMP-2 (for NCI-H1993 and SKBR3) mRNA expression in control (shCont) and ILEI KD (shILEI) cells after 24 h of HGF treatment (40 ng/ml) in the absence or presence of crizotinib (500 nM). Data are normalized as fold change to untreated control cells. Error bars represent SEM of three independent experiments. Statistical significance was determined by one-way ANOVA. c Secretion of MMP-9 and MMP-2 by control (shCont) and ILEI KD (shILEI) NCI-H441 and NCI-H1993 cells treated with HGF (40 ng/ml) for 24 h in the absence or presence of crizotinib (500 nM) determined by gelatin zymography from harvested conditioned medium. The three lanes of each treatment group represent samples of three independent assays. Recombinant pro-MMP-9 was used as assay control. d Quantification of the gelatin zymography gels shown in C. Relative differences in secreted MMP-9 and MMP-2 levels were determined by ImageJ analysis and normalized to HGF treatment-induced control cells. Error bars represent SEM of three independent experiments. Statistical significance was determined by Student’s t-test. e qPCR analysis of E-cadherin mRNA expression (CDH1) in NCI-H1993, NCI-H441, MKN45, OE33 and SKBR3 control (shCont) and ILEI KD (shILEI) cells treated or non-treated with crizotinib (500 nM) for 24 h. Data are normalized as fold change to untreated control cells. Error bars represent SEM of three independent experiments. Statistical significance was determined by one-way ANOVA and marked with asterisks (*p < 0.05; **p < 0.01). f Representative Western blot analysis of E-cadherin expression in the control (shCont) and ILEI KD (shILEI) derivatives of the five selected cell lines after crizotinib (500 nM) treatment for 24 h
Fig. 6
Fig. 6
Combined ILEI KD and crizotinib treatment reduces tumor growth by inhibiting proliferation and MMP expression. a, j Fold growth ± SEM of NCI-H441 (a) and NCI-H1993 (j) control (shCont) and ILEI KD (shILEI) tumors upon vehicle or crizotinib (Crizo) treatment normalized to size at treatment start. Crizotinib-treated NCI-H1993 tumors were allowed to grow for an additional 11 days after treatment termination. b, k Tumor masses ± SEM of NCI-H441 (b) and of NCI-H1993 (k) shCont and shILEI tumors of vehicle or Crizo-treated mice. c, l Percentage of Ki67 positive tumor cells ± SEM of NCI-H441 (c) and NCI-H1993 (l) shCont and shILEI tumors of vehicle or Crizo-treated mice. d, m Percentage of activated caspase 3 (actCasp3) positive tumor cells ± SEM of NCI-H441 (d) and NCI-H1993 (m) shCont and shILEI tumors of vehicle or crizotinib-treated mice. e, n Gelatin zymography of protein extracts of NCI-H441 (e) and NCI-H1993 (n) shCont and shILEI tumors of vehicle- or crizotinib-treated mice (n = 3 pro group). Recombinant pro-MMP9, assay control. f, o Quantification of gels of panel e (f) and n (o). Pro- (filled color) and activated (patterned color) MMP-9 and MMP-2 levels ± SEM were normalized to respective total MMP levels of vehicle-treated control tumors. Statistics compares total MMP-9 and MMP-2 levels. g, p mRNA expression levels of MMP9 in NCI-H441 (g) and of MMP2 in NCI-H1993 (p) shCont and shILEI tumors of vehicle- or crizotinib-treated mice (n = 3 pro group). Expression was normalized to GAPDH and shown as fold change ± SEM over vehicle treated control tumors. h Representative images of MMP-9 IHC on NCI-H441 shCont and shILEI tumor sections of vehicle or crizotinib-treated mice. Arrowheads mark intracellular granular MMP-9 localization. Scale bar, 100 μm. i Percentage of MMP-9 positive tumor cells ± SEM in NCI-H441 shCont and shILEI tumors of vehicle or crizotinib-treated mice. Statistical significance was determined by two-way ANOVA (a, j), Student’s t-test (a, j) and one-way ANOVA (b, c, d, f, g, i, k, l, m, o, p) and is marked with asterisks (*p < 0.05; **p < 0.01; ***p < 0.001)
Fig. 7
Fig. 7
Combined ILEI KD and crizotinib treatment increases E-cadherin membrane localization in tumor xenografts. a, f Representative images of E-cadherin IHC on NCI-H441 (a) and NCI-H1993 (e) shCont and shILEI tumor sections of vehicle or crizotinib-treated mice. Scale bar, 100 μm. b, g E-cadherin membrane score of NCI-H441 (b) and NCI-H1993 (f) shCont and shILEI tumors of vehicle- or crizotinib-treated mice. Error bars represent SEM. Statistical significance was determined by one-way ANOVA and marked with asterisks (*p < 0.05; **p < 0.01). c, h qPCR analysis of E-cadherin mRNA expression (CDH1) in NCI-H441 (c) and NCI-H1993 (g) shCont and shILEI tumors of vehicle- or crizotinib-treated mice (n = 3 pro group). Relative expression was normalized to GAPDH and shown as fold change to vehicle treated control tumors. Error bars represent SEM. Statistical significance was determined by one-way ANOVA and marked with asterisks (*p < 0.05). d, i Western blot analysis of E-cadherin protein expression in NCI-H441 (d) and NCI-H1993 (h) shCont and shILEI tumors of vehicle- or crizotinib-treated mice (n = 3 pro group). e, j Quantification of E-cadherin protein expression from the Western blot analyses shown in panels d and i. Expression was normalized to actin loading control and shown as fold expression relative to vehicle treated shCont tumors. Error bars represent SEM. Statistical significance was determined by one-way ANOVA and marked with asterisks (*p < 0.05)
Fig. 8
Fig. 8
Model of ILEI and c-MET signaling interplay on invasive tumor growth. a Molecular interplay of ILEI and c-MET signaling on invasion. b The influence of c-MET and ILEI signaling levels on the net outcome of tumor proliferation, invasion and overall tumor growth

Similar articles

Cited by

References

    1. Hanahan D, Weinberg RA. Hallmarks of cancer: the next generation. Cell. 2011;144(5):646–674. doi: 10.1016/j.cell.2011.02.013. - DOI - PubMed
    1. Hnisz D, Weintraub AS, Day DS, Valton AL, Bak RO, Li CH, et al. Activation of proto-oncogenes by disruption of chromosome neighborhoods. Science. 2016;351(6280):1454–1458. doi: 10.1126/science.aad9024. - DOI - PMC - PubMed
    1. Organ SL, Tsao MS. An overview of the c-MET signaling pathway. Ther Adv Med Oncol. 2011;3(1 Suppl):S7–S19. doi: 10.1177/1758834011422556. - DOI - PMC - PubMed
    1. Blumenschein GR, Jr, Mills GB, Gonzalez-Angulo AM. Targeting the hepatocyte growth factor-cMET axis in cancer therapy. J Clin Oncol. 2012;30(26):3287–3296. doi: 10.1200/JCO.2011.40.3774. - DOI - PMC - PubMed
    1. Hyman E, Kauraniemi P, Hautaniemi S, Wolf M, Mousses S, Rozenblum E, et al. Impact of DNA amplification on gene expression patterns in breast cancer. Cancer Res. 2002;62(21):6240–6245. - PubMed

MeSH terms

LinkOut - more resources