. 2021 Feb 17;12(1):142.
doi: 10.1186/s13287-021-02209-9.

Differential SOD2 and GSTZ1 profiles contribute to contrasting dental pulp stem cell susceptibilities to oxidative damage and premature senescence

Affiliations

Differential SOD2 and GSTZ1 profiles contribute to contrasting dental pulp stem cell susceptibilities to oxidative damage and premature senescence

Nadia Y A Alaidaroos et al. Stem Cell Res Ther. .

Abstract

Background: Dental pulp stem cells (DPSCs) are increasingly being advocated as viable cell sources for regenerative medicine-based therapies. However, significant heterogeneity in DPSC expansion and multi-potency capabilities are well-established, attributed to contrasting telomere profiles and susceptibilities to replicative senescence. As DPSCs possess negligible human telomerase (hTERT) expression, we examined whether intrinsic differences in the susceptibilities of DPSC sub-populations to oxidative stress-induced biomolecular damage and premature senescence further contributed to this heterogeneity, via differential enzymic antioxidant capabilities between DPSCs.

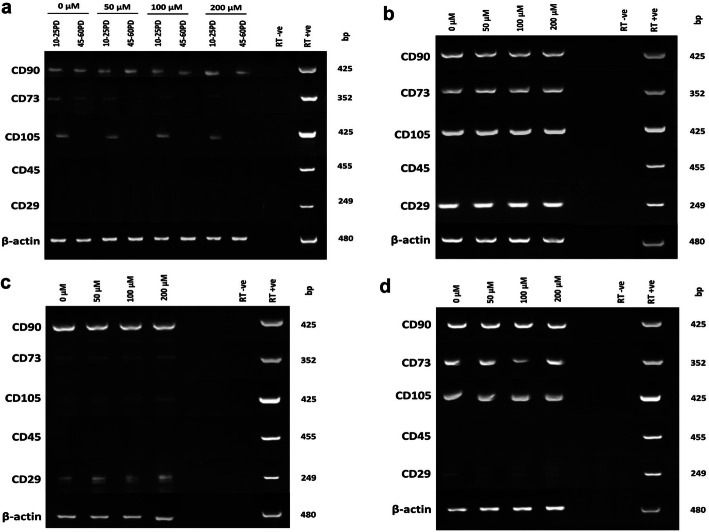
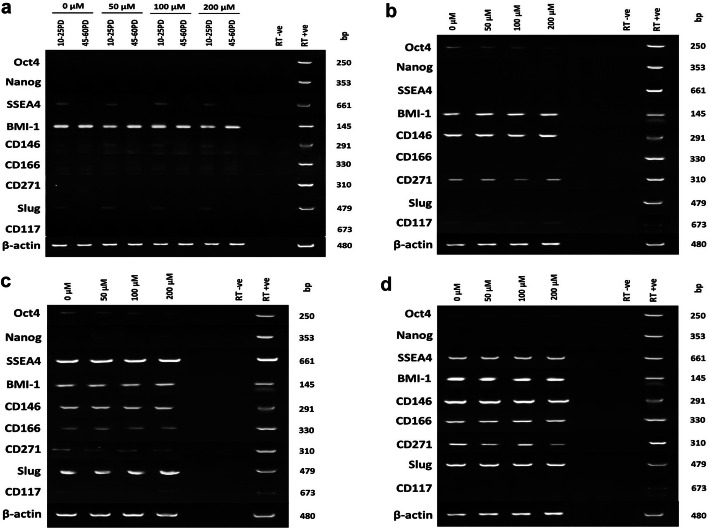
Methods: DPSCs were isolated from human third molars by differential fibronectin adhesion, and positive mesenchymal (CD73/CD90/CD105) and negative hematopoietic (CD45) stem cell marker expression confirmed. Isolated sub-populations were expanded in H2O2 (0-200 μM) and established as high or low proliferative DPSCs, based on population doublings (PDs) and senescence (telomere lengths, SA-β-galactosidase, p53/p16INK4a/p21waf1/hTERT) marker detection. The impact of DPSC expansion on mesenchymal, embryonic, and neural crest marker expression was assessed, as were the susceptibilities of high and low proliferative DPSCs to oxidative DNA and protein damage by immunocytochemistry. Expression profiles for superoxide dismutases (SODs), catalase, and glutathione-related antioxidants were further compared between DPSC sub-populations by qRT-PCR, Western blotting and activity assays.

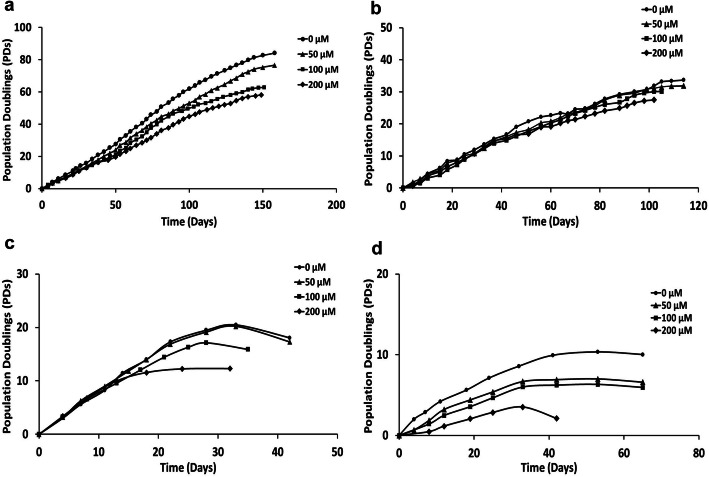
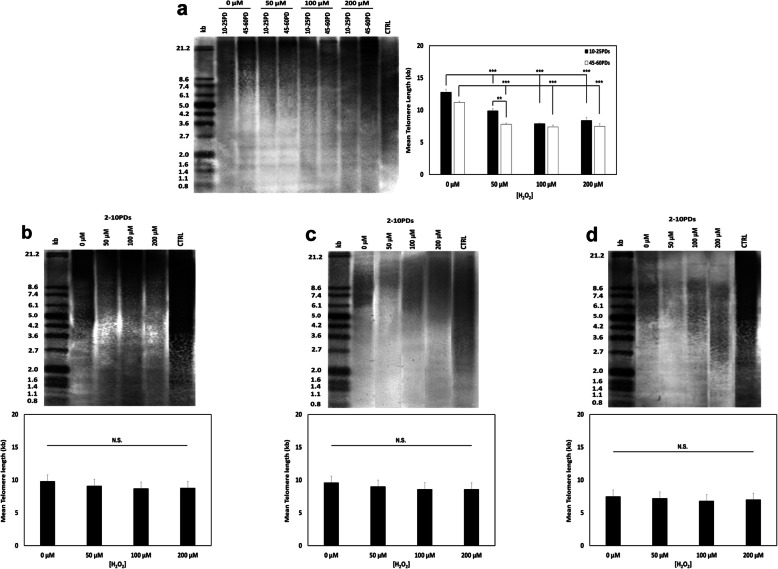
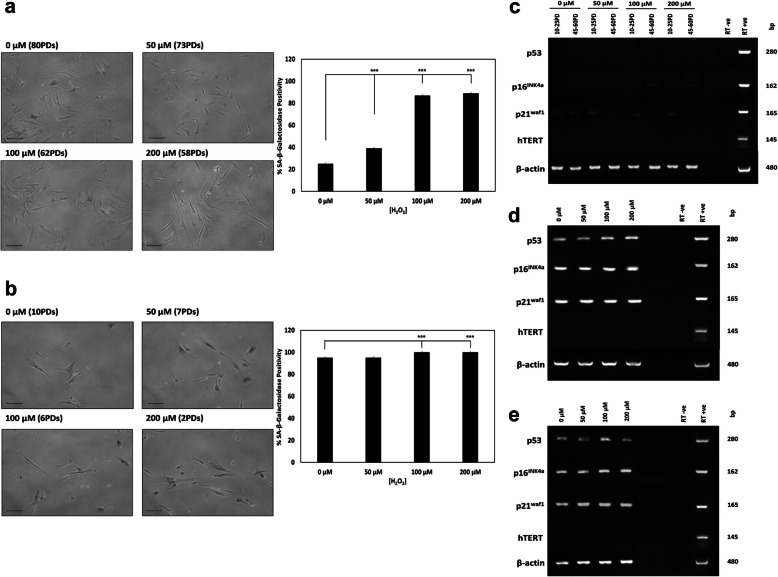
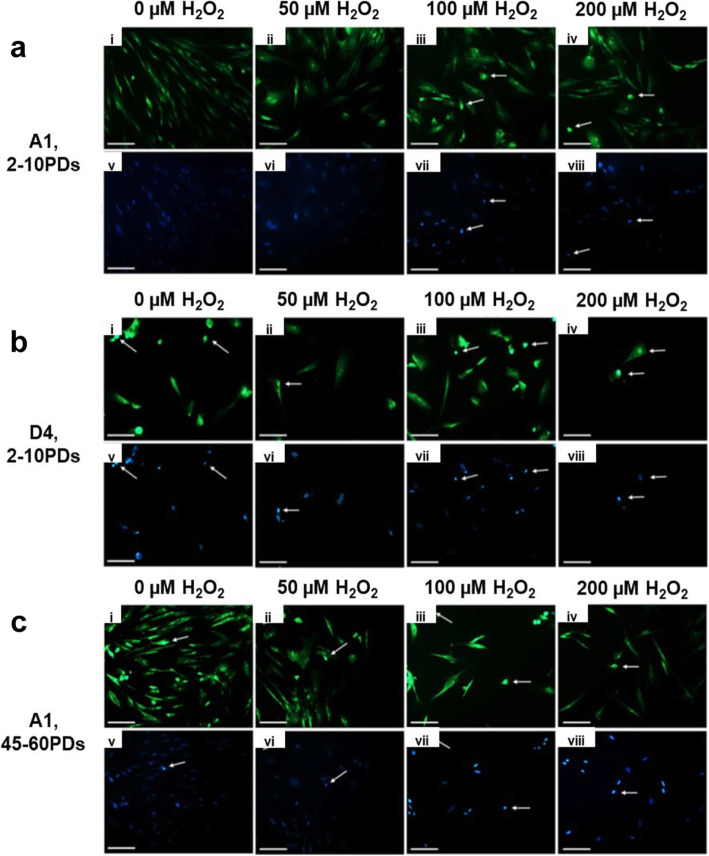
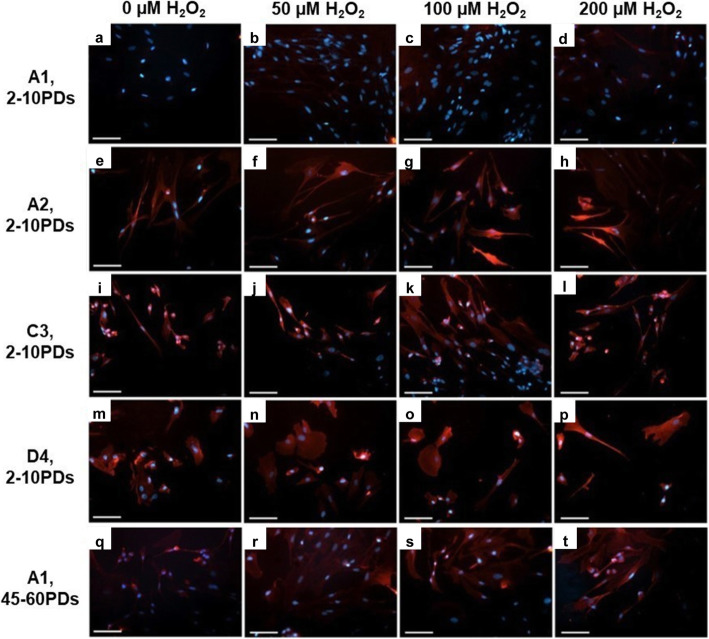
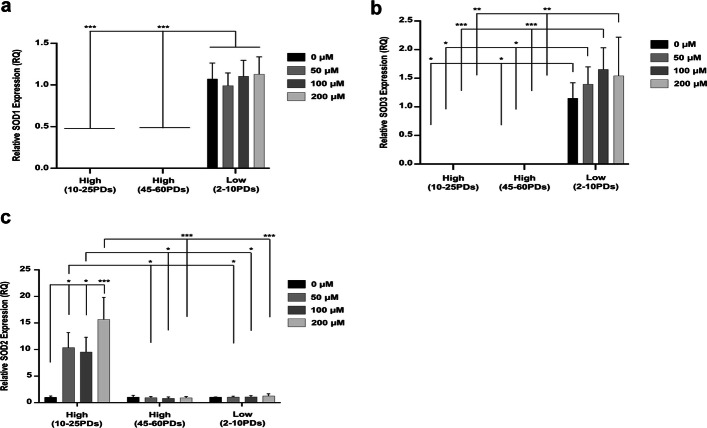
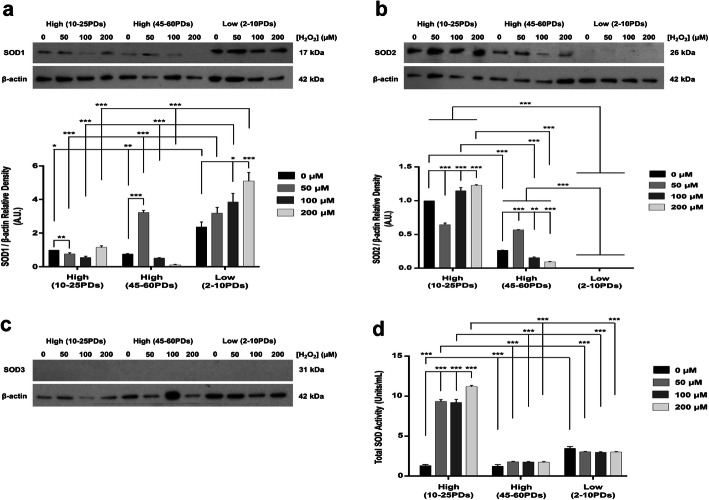
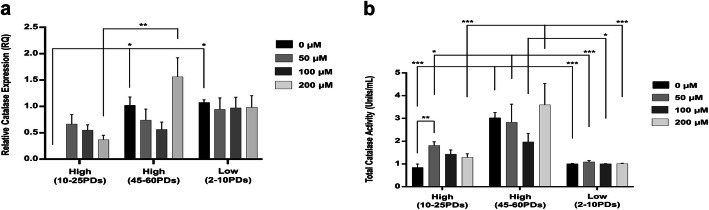
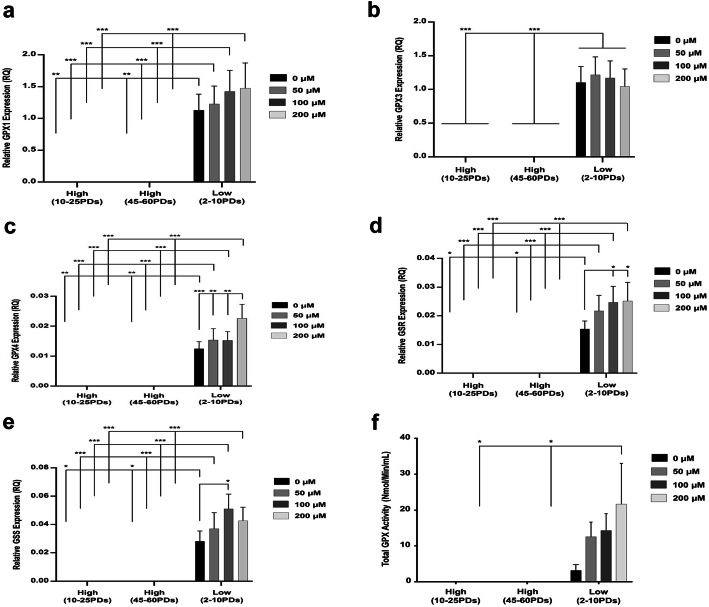
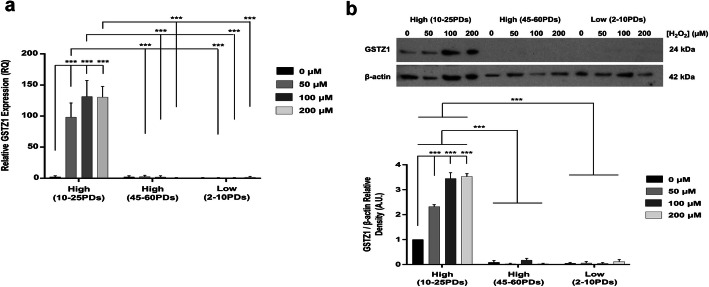
Results: High proliferative DPSCs underwent > 80PDs in culture and resisted H2O2-induced senescence (50-76PDs). In contrast, low proliferative sub-populations exhibited accelerated senescence (4-32PDs), even in untreated controls (11-34PDs). While telomere lengths were largely unaffected, certain stem cell marker expression declined with H2O2 treatment and expansion. Elevated senescence susceptibilities in low proliferative DPSC (2-10PDs) were accompanied by increased oxidative damage, absent in high proliferative DPSCs until 45-60PDs. Increased SOD2/glutathione S-transferase ζ1 (GSTZ1) expression and SOD activities were identified in high proliferative DPSCs (10-25PDs), which declined during expansion. Low proliferative DPSCs (2-10PDs) exhibited inferior SOD, catalase and glutathione-related antioxidant expression/activities.

Conclusions: Significant variations exist in the susceptibilities of DPSC sub-populations to oxidative damage and premature senescence, contributed to by differential SOD2 and GSTZ1 profiles which maintain senescence-resistance/stemness properties in high proliferative DPSCs. Identification of superior antioxidant properties in high proliferative DPSCs enhances our understanding of DPSC biology and senescence, which may be exploited for selective sub-population screening/isolation from dental pulp tissues for regenerative medicine-based applications.

Keywords: Dental pulp stem cells; GSTZ1; Heterogeneity; Oxidative damage; Oxidative stress; Premature senescence; SOD2.


Conflict of interest statement

The authors declare that they have no competing interests.

Figures

Fig. 1
Fig. 1
DPSC population doublings (PDs) during extended culture with or without exogenous H2O2 (50–200 μM) treatment. a High proliferative sub-population, A1 (patient A), exhibited high resistance to oxidative stress-induced premature senescence, achieving 50–76PDs with H2O2 treatment, compared to untreated controls (> 80PDs). b Low proliferative sub-population, A2 (patient A), only achieved 27–32PDs with H2O2 treatment, compared to untreated controls (34PDs). c Low proliferative sub-population, C3 (patient C), only achieved 12–19PDs with H2O2 treatment, compared to untreated controls (20PDs). d Low proliferative sub-population, D4 (patient D), only achieved 4–7PDs with H2O2 treatment, compared to untreated controls (11PDs)
Fig. 2
Fig. 2
DPSC telomere lengths during extended culture with or without exogenous H2O2 (50–200 μM) treatment. Representative images of TRF analysis (determined by Southern blotting) and mean telomere lengths (ImageJ® analysis), determined for a high proliferative sub-population, A1 (10–25PDs and 40–65PDs) and b–d low proliferative sub-populations A2 (2–10PDs), C3 (2–10PDs), and D4 (2–10PDs). Left- and right-hand lanes represent separated DIG-labeled telomere length standards (kb, in Kit). CTRL represent telomere length positive control (in Kit). N = 3, values in graphs represent the mean ± SEM. ***p < 0.001. N.S. = Non-significant
Fig. 3
Fig. 3
Senescence-related marker detection during extended DPSC culture with or without exogenous H2O2 (50–200 μM) treatment. a, b Representative SA-β-galactosidase microscopy images and % positively stained cell calculations, for high proliferative sub-population, A1 (58–80PDs) and low proliferative sub-population, D4 (2–10PDs). Scale bar 100 μm, × 100 magnification. N = 3, values represent the mean ± SEM. ***p < 0.001 versus untreated DPSC controls. Characterization of senescence marker (p53, p16INK4a, p21waf1, hTERT) expression for c high proliferative sub-population, A1 (10–25PDs and 40–65PDs), d, e low proliferative DPSC sub-populations C3 (2–10PDs) and D4 (2–10PDs). β-actin was used as the housekeeping gene. Right-hand lanes represent separate total human RNA-positive controls, water and RT-negative controls. bp = base pairs
Fig. 4
Fig. 4
Mesenchymal and hematopoietic stem cell marker expression during extended DPSC culture with or without exogenous H2O2 (50–200 μM) treatment. a High proliferative sub-population, A1 (10–25PDs and 40–65PDs), and b–d low proliferative sub-populations A2 (2–10PDs), C3 (2–10PDs), and D4 (2–10PDs). β-actin was used as the housekeeping gene. Right-hand lanes represent separate total human RNA-positive controls, water, and RT-negative controls. bp = base pairs. N = 3
Fig. 5
Fig. 5
Mesenchymal, embryonic and neural crest stem cell marker expression during extended DPSC culture with or without exogenous H2O2 (50–200 μM) treatment. a High proliferative sub-population, A1 (10–25PDs and 40–65PDs), and b–d low proliferative sub-populations A2 (2–10PDs), C3 (2–10PDs), and D4 (2–10PDs). β-actin was used as the housekeeping gene. Right-hand lanes represent separate total human RNA-positive controls, water, and RT-negative controls. bp = base pairs. N = 3
Fig. 6
Fig. 6
Oxidative DNA damage detection during extended DPSC culture with or without exogenous H2O2 (50–200 μM) treatment. Representative FITC (green, i–iv) and Hoechst nuclear stain (blue, v-viii) fluorescence microscopy images of 8-OHdG detection by immunocytochemistry, for a high proliferative sub-population, A1 (2–10PDs), b low proliferative sub-population, D4 (2–10PDs), and c high proliferative sub-population, A1 (45–60PDs). N = 3, scale bar 100 μm, × 200 magnification
Fig. 7
Fig. 7
Oxidative protein damage detection during extended DPSC culture with or without exogenous H2O2 (50–200 μM) treatment. Representative merged TRITC (red) and Hoechst nuclear stain (blue) fluorescence microscopy images of protein carbonyl detection by immunocytochemistry, for a–d high proliferative sub-population, A1 (2–10PDs), e–h low proliferative sub-population, A2 (2–10PDs), i–l low proliferative sub-population, C3 (2–10PDs), m–p low proliferative sub-population, D4 (2–10PDs), and q–t high proliferative sub-population, A1 (45–60PDs). N = 3, scale bar 100 μm, × 200 magnification
Fig. 8
Fig. 8
SOD isoform expression during extended DPSC culture with or without exogenous H2O2 (50–200 μM) treatment. a–c qRT-PCR analysis of SOD1, SOD3, and SOD2 gene expression by high proliferative (10–25PDs and 40–65PDs) and low proliferative (2–10PDs) DPSC sub-populations. Relative fold changes in enzymic antioxidant gene expression (RQ) were calculated using the 2–ΔΔCt method, normalized versus an 18S rRNA housekeeping gene. N = 3, values in the graphs represent mean ± SEM, *p < 0.05, **p < 0.01, ***p < 0.001
Fig. 9
Fig. 9
SOD isoform protein levels and total SOD activities during extended DPSC culture with or without exogenous H2O2 (50–200 μM) treatment. a–c Representative Western blot images and corresponding densitometric analysis of SOD1, SOD2, and SOD3 protein levels by high proliferative (10–25PDs and 40–65PDs) and low proliferative (2–10PDs) DPSC sub-populations. For all Western blots, images from one representative experiment of three are shown. Densitometry data was normalized versus β-actin loading controls, with values subsequently normalized versus untreated high proliferative DPSCs at early PDs (10–25PDs). A.U. = Arbitrary units. d Total SOD activities for high proliferative (10–25PDs and 40–65PDs) and low proliferative (2–10PDs) DPSC sub-populations. N = 3, values in the graphs represent mean ± SEM, *p < 0.05, **p < 0.01, ***p < 0.001
Fig. 10
Fig. 10
Catalase expression and activities during extended DPSC culture with or without exogenous H2O2 (50–200 μM) treatment. a qRT-PCR analysis of catalase gene expression by high proliferative (10–25PDs and 40–65PDs) and low proliferative (2–10PDs) DPSC sub-populations. Relative fold changes in enzymic antioxidant gene expression (RQ) were calculated using the 2–ΔΔCt method, normalized versus an 18S rRNA housekeeping gene. b Total catalase activities for high proliferative (at 10–25PDs and 40–65PDs) and low proliferative (at 2–10PDs) DPSC sub-populations, treated as above. N = 3, values in the graphs represent mean ± SEM, *p < 0.05, **p < 0.01, ***p < 0.001
Fig. 11
Fig. 11
Glutathione-related antioxidant gene expression and activities during extended DPSC culture with or without exogenous H2O2 (50–200 μM) treatment. a–c qRT-PCR analysis of a GPX1, b GPX3, c GPX4, d GSR, and e GSS gene expression by high proliferative (10–25PDs and 40–65PDs) and low proliferative (2–10PDs) DPSC sub-populations. Relative fold changes in enzymic antioxidant gene expression (RQ) were calculated using the 2–ΔΔCt method, normalized versus an 18S rRNA housekeeping gene. f Total GPX activities for high proliferative (at 10–25PDs and 40–65PDs) and low proliferative (at 2–10PDs) DPSC sub-populations. N = 3, values in the graphs represent mean ± SEM, *p < 0.05, **p < 0.01, ***p < 0.001
Fig. 12
Fig. 12
GSTZ1 gene expression and protein levels during extended DPSC culture with or without exogenous H2O2 (50–200 μM) treatment. a qRT-PCR analysis of GSTZ1 gene expression by high proliferative (10–25PDs and 40–65PDs) and low proliferative (2–10PDs) DPSC sub-populations. Relative fold changes in enzymic antioxidant gene expression (RQ) were calculated using the 2–ΔΔCt method, normalized versus an 18S rRNA housekeeping gene. b Representative Western blot images and corresponding densitometric analysis of GSTZ1 protein levels by high proliferative (at 10–25PDs and 40–65PDs) and low proliferative (at 2–10PDs) DPSC sub-populations. For all Western blots, images from one representative experiment of three are shown. Densitometry data was normalized versus β-actin loading controls, with values subsequently normalized versus untreated high proliferative DPSCs at early PDs (10–25PDs). A.U. = Arbitrary units. N = 3, values in the graphs represent mean ± SEM, ***p < 0.001

Similar articles

Cited by

References

    1. Ledesma-Martínez E, Mendoza-Núñez VM, Santiago-Osorio E. Mesenchymal stem cells derived from dental pulp: a review. Stem Cells Int. 2016;2016:4709572. doi: 10.1155/2016/4709572. - DOI - PMC - PubMed
    1. Chalisserry EP, Nam SY, Park SH, Anil S. Therapeutic potential of dental stem cells. J Tissue Eng. 2017;8:1–17. doi: 10.1177/2041731417702531. - DOI - PMC - PubMed
    1. Anitua E, Troya M, Zalduendo M. Progress in the use of dental pulp stem cells in regenerative medicine. Cytotherapy. 2018;20(4):479–498. doi: 10.1016/j.jcyt.2017.12.011. - DOI - PubMed
    1. Gronthos S, Mankani M, Brahim J, Robey PG, Shi S. Postnatal human dental pulp stem cells (DPSCs) in vitro and in vivo. Proc Natl Acad Sci U S A. 2000;97(25):13625–13630. doi: 10.1073/pnas.240309797. - DOI - PMC - PubMed
    1. Gronthos S, Brahim J, Li W, Fisher LW, Cherman N, Boyde A, DenBesten P, Robey PG, Shi S. Stem cell properties of human dental pulp stem cells. J Dent Res. 2002;81(8):531–535. doi: 10.1177/154405910208100806. - DOI - PubMed

Publication types