

Iron loading is a prominent feature of activated microglia in Alzheimer's disease patients
- PMID: 33597025
- PMCID: PMC7887813
- DOI: 10.1186/s40478-021-01126-5
Iron loading is a prominent feature of activated microglia in Alzheimer's disease patients
Abstract
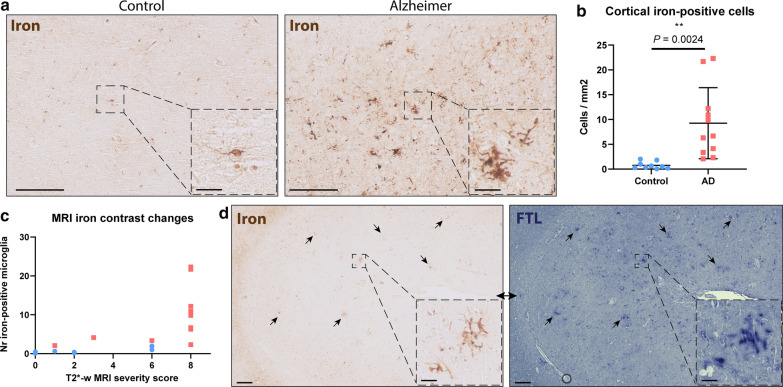
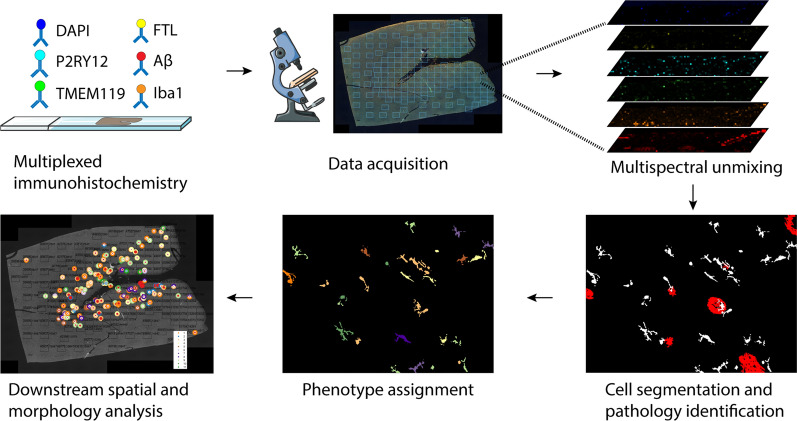
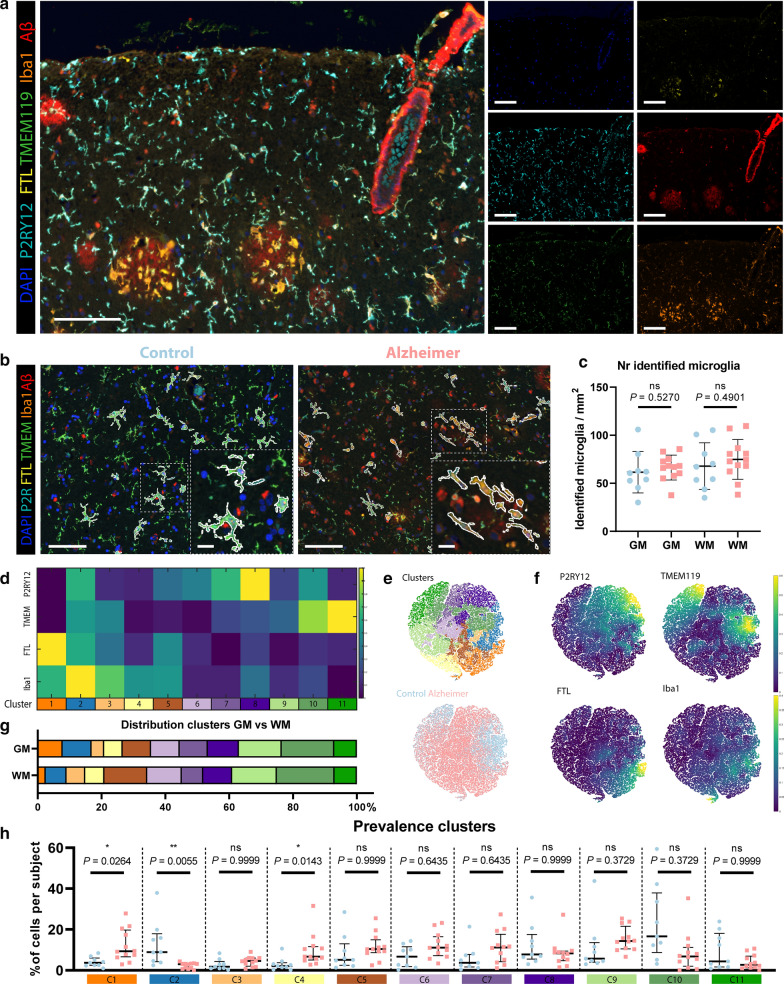
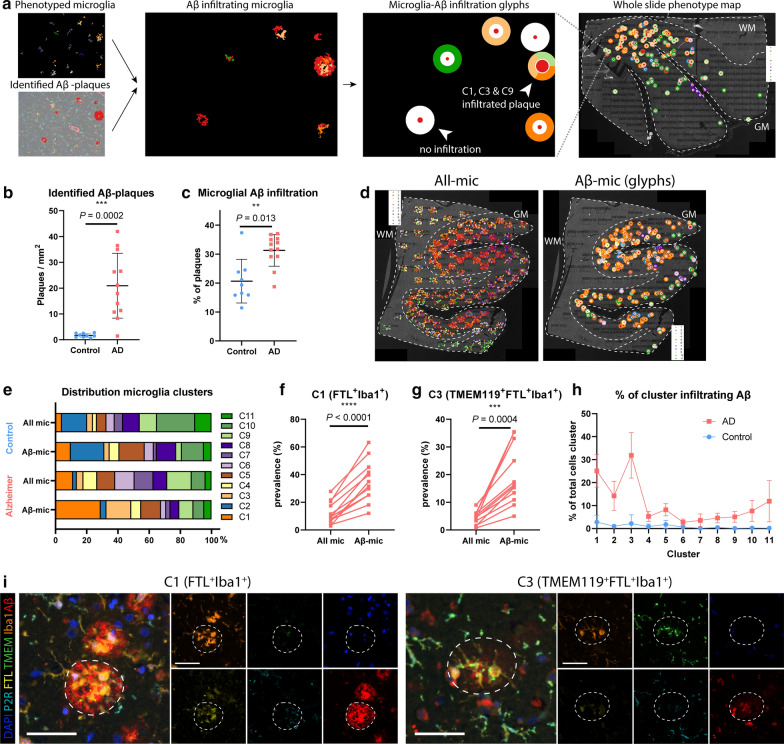
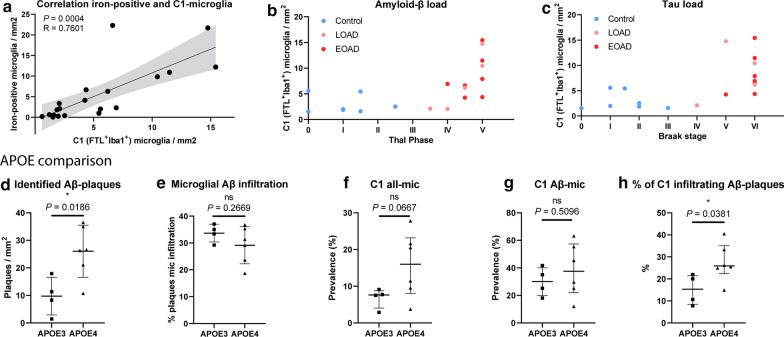
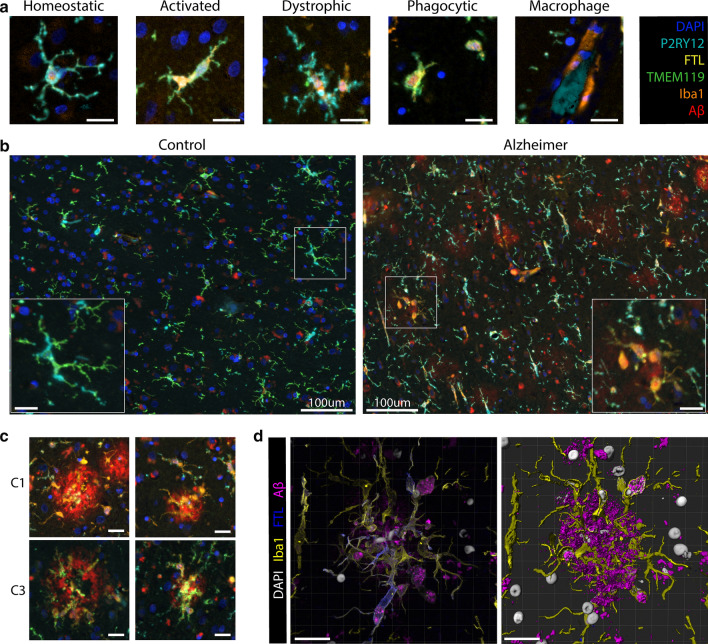
Brain iron accumulation has been found to accelerate disease progression in amyloid-β(Aβ) positive Alzheimer patients, though the mechanism is still unknown. Microglia have been identified as key players in the disease pathogenesis, and are highly reactive cells responding to aberrations such as increased iron levels. Therefore, using histological methods, multispectral immunofluorescence and an automated in-house developed microglia segmentation and analysis pipeline, we studied the occurrence of iron-accumulating microglia and the effect on its activation state in human Alzheimer brains. We identified a subset of microglia with increased expression of the iron storage protein ferritin light chain (FTL), together with increased Iba1 expression, decreased TMEM119 and P2RY12 expression. This activated microglia subset represented iron-accumulating microglia and appeared morphologically dystrophic. Multispectral immunofluorescence allowed for spatial analysis of FTL+Iba1+-microglia, which were found to be the predominant Aβ-plaque infiltrating microglia. Finally, an increase of FTL+Iba1+-microglia was seen in patients with high Aβ load and Tau load. These findings suggest iron to be taken up by microglia and to influence the functional phenotype of these cells, especially in conjunction with Aβ.
Keywords: Alzheimer; Ferritin; Human; Iron; Microglia.
Conflict of interest statement
The authors have no conflicts of interest to declare. All co-authors have seen and agree with the contents of the manuscript and there is no financial interest to report.
Figures
Similar articles
-
Dietary lipophilic iron alters amyloidogenesis and microglial morphology in Alzheimer's disease knock-in APP mice.Metallomics. 2018 Mar 1;10(3):426-443. doi: 10.1039/c8mt00004b. Epub 2018 Feb 9. Metallomics. 2018. PMID: 29424844
-
Co-expression patterns of microglia markers Iba1, TMEM119 and P2RY12 in Alzheimer's disease.Neurobiol Dis. 2022 Jun 1;167:105684. doi: 10.1016/j.nbd.2022.105684. Epub 2022 Mar 2. Neurobiol Dis. 2022. PMID: 35247551
-
Patterns of Expression of Purinergic Receptor P2RY12, a Putative Marker for Non-Activated Microglia, in Aged and Alzheimer's Disease Brains.Int J Mol Sci. 2020 Jan 20;21(2):678. doi: 10.3390/ijms21020678. Int J Mol Sci. 2020. PMID: 31968618 Free PMC article.
-
Microglia in Alzheimer's Disease.Curr Alzheimer Res. 2020;17(1):29-43. doi: 10.2174/1567205017666200212155234. Curr Alzheimer Res. 2020. PMID: 32048973 Review.
-
Investigations with cultured human microglia on pathogenic mechanisms of Alzheimer's disease and other neurodegenerative diseases.J Neurosci Res. 2005 Aug 1;81(3):412-25. doi: 10.1002/jnr.20484. J Neurosci Res. 2005. PMID: 15957156 Review.
Cited by
-
Different phenotypes of microglia in animal models of Alzheimer disease.Immun Ageing. 2022 Oct 8;19(1):44. doi: 10.1186/s12979-022-00300-0. Immun Ageing. 2022. PMID: 36209099 Free PMC article. Review.
-
Microglial-specific knockdown of iron import gene, Slc11a2, blunts LPS-induced neuroinflammatory responses in a sex-specific manner.Brain Behav Immun. 2024 Feb;116:370-384. doi: 10.1016/j.bbi.2023.12.020. Epub 2023 Dec 22. Brain Behav Immun. 2024. PMID: 38141840 Free PMC article.
-
Loss of ATG7 in microglia impairs UPR, triggers ferroptosis, and weakens amyloid pathology control.J Exp Med. 2025 Apr 7;222(4):e20230173. doi: 10.1084/jem.20230173. Epub 2025 Feb 13. J Exp Med. 2025. PMID: 39945772
-
Molecular and spatial heterogeneity of microglia in Rasmussen encephalitis.Acta Neuropathol Commun. 2022 Nov 21;10(1):168. doi: 10.1186/s40478-022-01472-y. Acta Neuropathol Commun. 2022. PMID: 36411471 Free PMC article.
-
Microglia in brain aging: An overview of recent basic science and clinical research developments.J Biomed Res. 2024 Feb 26;38(2):122-136. doi: 10.7555/JBR.37.20220220. J Biomed Res. 2024. PMID: 38403286 Free PMC article.
References
-
- Keren-Shaul H, Spinrad A, Weiner A, Matcovitch-Natan O, Dvir-Szternfeld R, Ulland TK, et al. A unique microglia type associated with restricting development of Alzheimer’s disease. Cell. 2017;169(1276–1290):e17. - PubMed
Publication types
MeSH terms
Substances
LinkOut - more resources
Full Text Sources
Other Literature Sources
Medical
Miscellaneous
