. 2021 Feb 17;7(8):eabb1540.
doi: 10.1126/sciadv.abb1540. Print 2021 Feb.

Neurodevelopmental defects and neurodegenerative phenotypes in human brain organoids carrying Parkinson's disease-linked DNAJC6 mutations

Affiliations

Neurodevelopmental defects and neurodegenerative phenotypes in human brain organoids carrying Parkinson's disease-linked DNAJC6 mutations

Noviana Wulansari et al. Sci Adv. .

Erratum in

Abstract

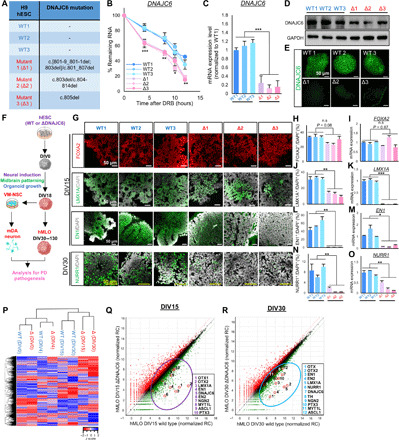
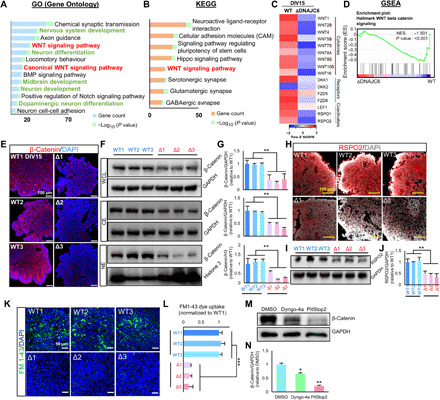
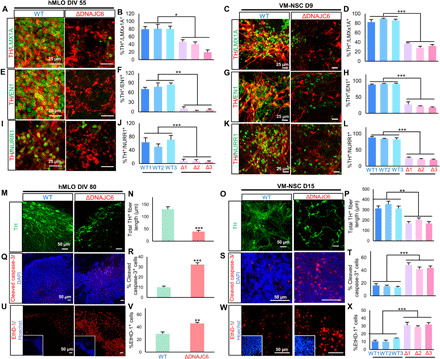
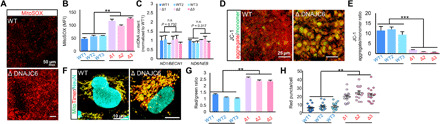
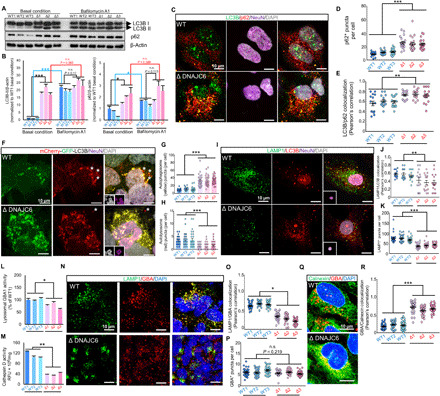
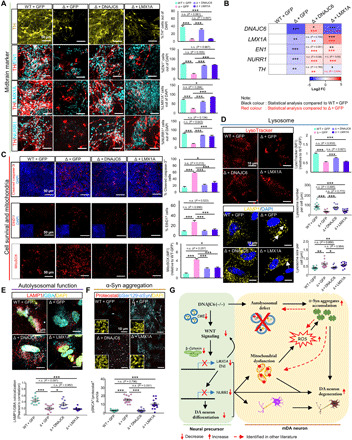
Loss-of-function mutations of DNAJC6, encoding HSP40 auxilin, have recently been identified in patients with early-onset Parkinson's disease (PD). To study the roles of DNAJC6 in PD pathogenesis, we used human embryonic stem cells with CRISPR-Cas9-mediated gene editing. Here, we show that DNAJC6 mutations cause key PD pathologic features, i.e., midbrain-type dopamine (mDA) neuron degeneration, pathologic α-synuclein aggregation, increase of intrinsic neuronal firing frequency, and mitochondrial and lysosomal dysfunctions in human midbrain-like organoids (hMLOs). In addition, neurodevelopmental defects were also manifested in hMLOs carrying the mutations. Transcriptomic analyses followed by experimental validation revealed that defects in DNAJC6-mediated endocytosis impair the WNT-LMX1A signal during the mDA neuron development. Furthermore, reduced LMX1A expression during development caused the generation of vulnerable mDA neurons with the pathologic manifestations. These results suggest that the human model of DNAJC6-PD recapitulates disease phenotypes and reveals mechanisms underlying disease pathology, providing a platform for assessing therapeutic interventions.


Figures

Fig. 1
Fig. 1. Ventral midbrain patterning defects in DNAJC6 mutant human midbrain-like organoids.
(A) Summary of mutated gene sequences in the DNAJC6 mutant hESCs (Δ1, 2, 3) generated in our study. (B) DNAJC6 mRNA stability in the WT and mutant hESCs. DRB, 5,6-dichloro-1-beta-d-ribofuranosylbenzimidazole, a mRNA transcription inhibitor. (C to E) mRNA and protein expressions of DNAJC6 estimated by quantitative polymerase chain reaction (qPCR) (C), Western blot (WB) (D), and immunocytochemical (E) analyses. Scale bars, 50 μm. (F) Schematic of hESCs differentiated to hMLOs, two-dimensional VM neural stem/precursor cells (NSCs), and mDA neuron cultures, used as an experimental platform. (G to O) Expression of the early (FOXA2, LMX1A, and EN1) and late (NURR1) midbrain-specific markers. The early and late midbrain marker expressions were determined in the WT and mutant hMLOs at DIV15 and DIV30, respectively, using immunocytochemical (G, H, J, L, and N) and qPCR (I, K, M, and O) analyses. For quantification of the marker-positive cells, five hMLOs from five different batches from each WT and mutant cultures were cryosectioned at 16-μm thickness, and the positive cells were counted every five sections from each hMLO. Scale bars, 50 μm. (P to R) RNA sequencing (RNA-seq) analysis for WT versus mutant hMLO cultures at DIV0, DIV4, DIV15, and DIV30. (P) Unsupervised hierarchical clustering for the differentially expressed genes (DEGs) between the WT and mutant hMLOs [fragments per kilobase of transcript per million mapped reads (FPKM) >1, fold change >2]. (Q and R) Scatterplots of the DEGs highlighting mDA neuron developmental genes are included in the most significantly and greatly up-regulated in the WT hMLOs versus mutant hMLOs at DIV15 and DIV30. Data are presented as means ± SEM, n = 3 independent experiments. Significance at *P < 0.05; **P < 0.01; ***P < 0.001, Student’s t test; n.s., no significance.
Fig. 2
Fig. 2. Loss of DNAJC6-mediated CME causes defects in WNT intracellular signaling at early stages of DNAJC6 mutant hMLOs.
(A and B) Top GO and KEGG pathways for the genes down-regulated in mutant hMLOs (versus WT hMLOs) at DIV15. “WNT signaling pathway” is highlighted in red. “mDA development”–related categories are highlighted in green. (C) Heatmap for the expressions of WNT cytokines, receptors, and coactivators in the RNA-seq data. Expression values are shown as log2-transformed normalized read counts. (D) Gene set enrichment analysis (GSEA) showed enrichment of WNT signaling in WT cells compared with mutant DNAJC6. (E to G) Immunocytochemical (E) and WB analyses (F) to determine β-catenin protein levels in the WT and mutant hMLOs at DIV15. Intensities of the bands in (F) were quantified using ImageJ software, and the values were normalized to glyceraldehyde-3-phosphate dehydrogenase (GAPDH) (G). WCL, whole-cell lysate; CE, cytosolic extract; NE, nuclear extract. Scale bars, 100 μm. (H to J) Immunocytochemical (H) and WB analyses (I) to determine R-spondin 2 protein levels in the WT and mutant hMLOs at DIV15. Intensities of the bands in (I) were quantified using ImageJ software, and the values were normalized to GAPDH (J). (K and L) Endocytic capacity assessed by the uptake of FM1-43 dye (K). Fluorescence intensity of FM1-43 was measured using ImageJ in 30 cells randomly chosen from each WT and mutant NSC cultures (L). Scale bars, 50 μm. (M and N) Decrease of β-catenin protein levels by treatment of the clathrin-mediated endocytosis inhibitor (M). The WB analysis was done in the VM-NSC cultures derived from WT1-hMLOs. Intensities of the bands in (M) were quantified using ImageJ software, and the values were normalized to GAPDH (N). Data are presented as means ± SEM. n = 3 independent experiments. DMSO, dimethyl sulfoxide. Significance at *P < 0.05; **P < 0.01; ***P < 0.001, Student’s t test (G, J, and L) and two-way analysis of variance (ANOVA) followed by Bonferroni’s post hoc test (N).
Fig. 3
Fig. 3. DNAJC6 mutations yield DA neurons lacking midbrain-specific factor expression and undergoing degeneration.
(A to L) Midbrain-specific factor expression in DA neurons in late hMLO (A, B, E, F, I, and J) and differentiated NSC cultures (C, D, G, H, K, and L). Images shown are representative and taken from the cultures derived from WT1 and mutant-3. Scale bars, 25 μm. (M to X) DA neuron degeneration assessed by a morphometric analysis on TH+ neurons (M to P), % apoptotic cells (cleaved caspase-3+) (Q to T), and % cell death (EthD-1+) cells (U to X). Insets in (U) and (W) are Hoechst+ cells. In the morphometric analysis, TH+ fiber length per DA neuron was estimated in WT and mutant cultures, n = 3 biological replicates; in each WT- and mutant-derived culture, 30 TH+ cells were assessed. Scale bars, 50 μm. Data are presented as means ± SEM, n = 3 independent experiments. Significance at *P < 0.05; **P < 0.01; ***P < 0.001, Student’s t test.
Fig. 4
Fig. 4. Disease pathology in mutant DNAJC6.
(A) Transient plots from multielectrode array with representative sorted neural signals and the firing rate of the neural signals over time recorded from WT and ΔDNAJC6 hMLO organoids using a 16-electrode silicon neural probe. (B and C) Measurement of intracellular reactive oxygen species (ROS) in hMLO (scale bars, 500 μm) and differentiated NSC cultures (scale bars, 50 μm) through dihydrodichlorofluorescein diacetate (DCF) DA staining (B); ROS level is presented as mean fluorescence intensity value (C). n = 3 independent experiments. (D) Quantification of DA release in hMLO DIV94 and differentiated NSC D15. n = 3 independent experiments. mnt, minutes. (E) Heatmap for the expressions of DA metabolism, DA transmission, and pacemaker-related genes in the RNA-seq data. Expression value is shown as log2 fold change of ΔDNAJC6 versus WT hMLO DIV15 and DIV30, respectively. (F to I) WB analyses to determine endogenous α-syn protein levels from Triton X-100 (Tx-100)–soluble and –insoluble fractions of WT and ΔDNAJC6 hMLO at DIV55 and DIV130 (F and H). Intensities of the bands in (F) and (H) were quantified using ImageJ software, and the values were normalized to GAPDH (G and I). n = 3 independent experiments. (J to M) Intracellular detection of α-synuclein aggregation using bimolecular fluorescence complementation (BiFC) on hMLO DIV55 and hNSC D12 (I). Analysis on hMLO DIV55 was conducted using CLARITY imaging and further confirmation by sectioned organoid (thickness, 30 μm) from the same batch and analyzing it using confocal (J). α-Syn aggregation shown in terms of the percentage of BiFC+ cells, n = 3 independent experiments (K), number of BiFC+ puncta per cell (L), and number of BiFC+/pSer129-αSyn+ puncta per cell (M), n = 30 cells analyzed in each group. Scale bars, CLARITY, 200 μm; 30 μm for high-magnification image; hNSC, 50 μm. N.D., not detected. Data are presented as means ± SEM. Significance at *P < 0.05; **P < 0.01; ***P < 0.001, Student’s t test.
Fig. 5
Fig. 5. Mitochondrial dysfunction in DNAJC6 mutants.
(A and B) Mitochondrial ROS in differentiated NSC culture were detected using MitoSOX Red probes (A). Fluorescence intensity was measured using ImageJ in 15 different areas from three independent experiments (B). ROS levels are presented as mean fluorescence intensity. Scale bars, 50 μm. (C) qRT-PCR analysis of mitochondrial DNA ratio in WT and mutant neurons, (n = 3). (D and E) Mitochondrial membrane potential analysis with JC-1 in differentiated NSC culture (D). A decrease in the red fluorescence (JC-1 aggregate)/green fluorescence (JC-1 monomer) ratio indicates depolarization/disruption of the mitochondrial membrane potential (E). Scale bars, 25 μm. (F to H) Representative images of MitoTimer reporter gene expression in differentiated NSC cultures (F). Red fluorescence represents oxidized Ds-Red mutant (DsRed1-E5) caused by oxidative stress. Mitochondria damage was measured as the red:green ratio (G) and number of pure red puncta per cell. n = 15 cells from each group (H). Scale bar, 10 μm. Data are presented as means ± SEM, n = 3 independent experiments. Significance at **P < 0.01; ***P < 0.001, Student’s t test.
Fig. 6
Fig. 6. Autolysosomal dysfunctions in DNAJC6 mutant neuron.
(A and B) WB analysis of the autophagosome components LC3BII and p62 in the presence or absence of bafilomycin A1. (B) represents the protein levels of LC3BII and p62 (normalized to β-actin) relative to the WT1 value at basal condition. n = 3 independent experiments. (C to E). Representative image of LC3B/p62 staining in differentiated neuron cultures (C). Scale bars, 10 μm for all images. Quantification of p62+ puncta number per cell (D) and colocalization of p62+ and LC3+ puncta per cell (E). n = 12 cells (D) and n = 15 cells (E) from each group. (F to H) Representative image of differentiated neuron expressing mCherry-GFP-LC3B (F). Insets, DAPI+ (gray) and NeuN+ (purple) images in the same microscopic fields. Quantification of autophagosomes (yellow puncta) and autolysosomes (red puncta) number per cell (G and H). n = 30 cells. Asterisk (*) symbols indicate autolysosomes. (I to K) Representative image of LAMP1/LC3B staining in differentiated neurons (I). Inset, DAPI+/NeuN+ image. Colocalized LAMP1+ with LC3+ puncta per cell (J). LAMP1+ puncta per cell (K). n = 15 (J) and n = 30 (K) cells. (L and M) Lysosomal glucocerebrosidase 1 (GBA1) (L) and cathepsin (M) activities. n = 3 biological replicates. (N to P) Representative LAMP1+/GBA+ images in differentiated neuron (N). The numbers of colocalized LAMP1+/GBA+ puncta (O) and GBA+ puncta (P) per cell were quantified. n = 24 (O) and n = 20 (P) cells. (Q and R) Representative calnexin+/GBA+ images (Q). The numbers of colocalized calnexin+/GBA+ puncta per cell (R). n = 30 cells. Data are presented as means ± SEM. Significance at *P < 0.05; **P < 0.01; ***P < 0.001, Student’s t test.
Fig. 7
Fig. 7. DNAJC6 does not require LMX1A in preventing lysosomal dysfunction.
DNAJC6 mutant (△3) NSCs were transduced with the lentiviruses expressing LMX1A, DNAJC6, or GFP (control) and then differentiated into mDA neurons. (A and B) Expression of midbrain-specific factor was determined in the differentiated mDA neuronal cultures using immunocytochemical (A) and qPCR (B) analyses. Scale bars, 50 μm. n = 3 independent experiments. (C) Cell viability assessed by the number of cleaved caspase-3+ and EthD1+ cells (first and second rows) and mitochondrial ROS estimated by MitoSox (third row). Scale bars, 50 μm. n = 3 independent experiments. (D) LMX1A and DNAJC6 rescuing effects on amount and size of lysosome. Confocal microscopy for LysoTracker Red DND99 in differentiated neurons. Scale bars, 10 μm. Averages of mean LysoTracker fluorescence intensities per cell are quantified in the graph at the first row. n = 15 cells from each group. Visualization of lysosome by LAMP1 staining in differentiated neurons. Scale bars, 10 μm. Quantification of lysosome number per cell (second graph) and lysosome size per cell (third graph), n = 15 cells from each group. Each dot represents the average value of lysosome size per cell. The white arrow indicates an enlarged lysosome. (E) Representative image of LAMP1/GBA staining in differentiated neurons. Scale bars, 50 μm. Quantification of colocalized LAMP1+ and GBA+ puncta per cell. n = 15 cells from each group. (F) LMX1A and DNAJC6 rescuing effects on α-syn aggregation in differentiated neuron. The α-syn aggregation was quantified by the number of pSer129-αSyn+/ProteoStat+ puncta per cell. Scale bars, 10 μm. n = 15 cells from each group. (G) Schematic summary for PD pathogenic signaling pathways caused by loss of DNAJC6. Data are presented as means ± SEM. Significance at *P < 0.05; **P < 0.01; ***P < 0.001, one-way ANOVA with Bonferroni post hoc analysis.

References

    1. Poewe W., Seppi K., Tanner C. M., Halliday G. M., Brundin P., Volkmann J., Schrag A. E., Lang A. E., Parkinson disease. Nat. Rev. Dis. Primers. 3, 17013 (2017). - PubMed
    1. Ungewickell E., Ungewickell H., Holstein S. E., Lindner R., Prasad K., Barouch W., Martin B., Greene L. E., Eisenberg E., Role of auxilin in uncoating clathrin-coated vesicles. Nature 378, 632–635 (1995). - PubMed
    1. Edvardson S., Cinnamon Y., Ta-Shma A., Shaag A., Yim Y. I., Zenvirt S., Jalas C., Lesage S., Brice A., Taraboulos A., Kaestner K. H., Greene L. E., Elpeleg O., A deleterious mutation in DNAJC6 encoding the neuronal-specific clathrin-uncoating co-chaperone auxilin, is associated with juvenile parkinsonism. PLOS ONE 7, e36458 (2012). - PMC - PubMed
    1. Koroglu C., Baysal L., Cetinkaya M., Karasoy H., Tolun A., DNAJC6 is responsible for juvenile parkinsonism with phenotypic variability. Parkinsonism Relat. Disord. 19, 320–324 (2013). - PubMed
    1. Olgiati S., Quadri M., Fang M., Rood J. P., Saute J. A., Chien H. F., Bouwkamp C. G., Graafland J., Minneboo M., Breedveld G. J., Zhang J.; International Parkinsonism Genetics Network, Verheijen F. W., Boon A. J., Kievit A. J., Jardim L. B., Mandemakers W., Barbosa E. R., Rieder C. R., Leenders K. L., Wang J., Bonifati V., DNAJC6 mutations associated with early-onset Parkinson’s disease. Ann. Neurol. 79, 244–256 (2016). - PubMed

Publication types

Substances