. 2021 Feb 17;7(8):eabc2331.
doi: 10.1126/sciadv.abc2331. Print 2021 Feb.

Microfluidic tumor-on-a-chip model to evaluate the role of tumor environmental stress on NK cell exhaustion

Affiliations

Microfluidic tumor-on-a-chip model to evaluate the role of tumor environmental stress on NK cell exhaustion

Jose M Ayuso et al. Sci Adv. .

Abstract

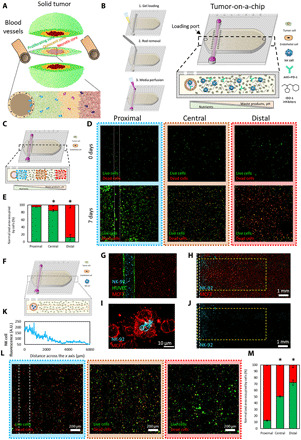
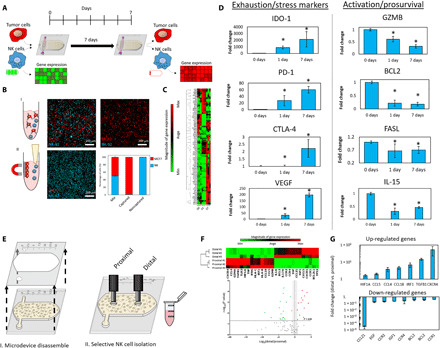
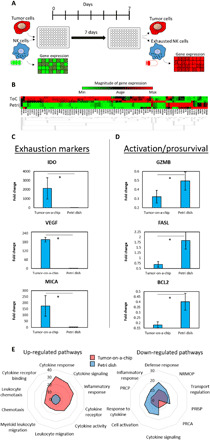
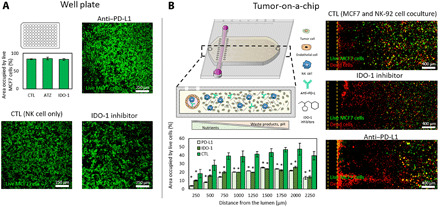
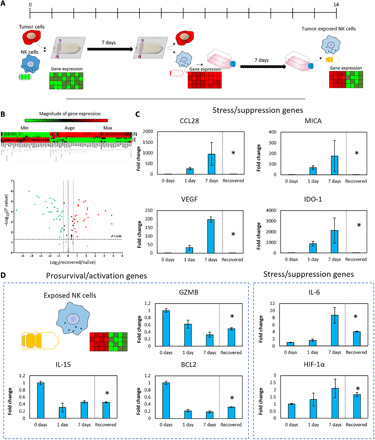
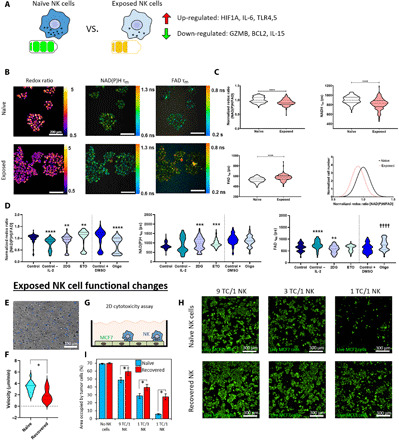
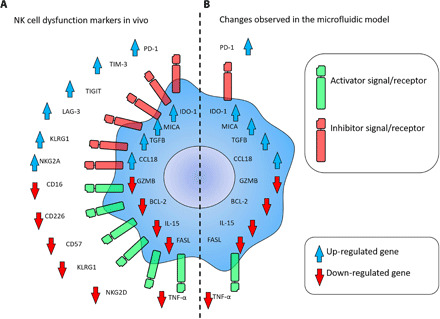
Solid tumors generate a suppressive environment that imposes an overwhelming burden on the immune system. Nutrient depletion, waste product accumulation, hypoxia, and pH acidification severely compromise the capacity of effector immune cells such as T and natural killer (NK) cells to destroy cancer cells. However, the specific molecular mechanisms driving immune suppression, as well as the capacity of immune cells to adapt to the suppressive environment, are not completely understood. Thus, here, we used an in vitro microfluidic tumor-on-a-chip platform to evaluate how NK cells respond to the tumor-induced suppressive environment. The results demonstrated that the suppressive environment created by the tumor gradually eroded NK cell cytotoxic capacity, leading to compromised NK cell surveillance and tumor tolerance. Further, NK cell exhaustion persisted for an extended period of time after removing NK cells from the microfluidic platform. Last, the addition of checkpoint inhibitors and immunomodulatory agents alleviated NK cell exhaustion.


Figures

Fig. 1
Fig. 1. Tumor-on-a-chip.
(A) Schematic representation of the different tumor phenotypes generated in a solid tumor due to nutrient starvation. (B) Scheme of the tumor-on-a-chip microdevice. The bottom panel shows the microdevice cross-section. The lumen was lined with endothelial cells (e.g., HUVECs) to generate a blood vessel surrogate, allowing the perfusion of medium, NK-92 cells, anti–PD-L1 antibodies (i.e., atezolizumab), or IDO-1 inhibitors (i.e., epacadostat). (C) Schematic representation of the microdevice, and the proximal, central, and distal regions are shown in blue, orange, and red, respectively. (D) Confocal images showing live and dead MCF7 cells in green and red, respectively, after 0 and 7 days in the device. (E) Area occupied by live cells (in green) and dead cells (in red) in the proximal, central, and distal regions. Asterisks denote P value of <0.05. (F) Scheme of the experimental setup. (G) Confocal image showing the dispersal of cells in the tumor-on-chip device. MCF7 cells (in red) are embedded in the collagen gel, while NK-92 cells (in blue) and HUVEC cells (in green) are embedded in the lumen. (H) This confocal image shows NK-92 cells (in blue) migrating across the chamber and MCF7 cells (in red). (I) Confocal image representing an NK-92 engaging with an MCF7. (J) This confocal image highlights the migration of NK cells out of the lumen and into the chamber. (K) Quantification of NK-92 migration across the x axis measured by NK cell fluorescence. A.U., arbitrary units. (L) MCF7 and NK-92 cells were cocultured for a week. The proximal region has a higher percentage of dead cells due to NK interaction close to the nutrient-rich lumen. (M) Quantification showing that distance from the lumen and the number of live cancer cells (in green) is proportional. Asterisk denotes P value of <0.05 compared with the proximal region; graphs show means ± SD.
Fig. 2
Fig. 2. Culture in the tumor-on-a-chip microdevice led to NK cell exhaustion.
(A) Schematic representation of an experiment measuring immune exhaustion. NK cells and MCF7 cells were mixed with the collagen mixture and cocultured in a 1:3 ratio (0.5 million cells/1 ml:1.5 million cells/1 ml) for 7 days. This approach guaranteed that NK cell density was homogeneous across the hydrogel (e.g., proximal versus central versus distal area). After 7 days, the NK cells were isolated, and gene expression and other characteristics were measured. (B) Scheme of NK cell separation. MCF7 cells attach to magnetic beads, thus isolating NK cells in suspension. Confocal images represent captured MCF7 cells (in red) and isolated NK cells (in blue). The graph highlights the efficiency of NK cell isolation. (C) Cluster graph depicting gene expression after 0, 1, and 7 days. (D) Bar graphs show the up-/down-regulation of exhaustion markers and activation/prosurvival genes. (E) Scheme of spatially controlled NK cell isolation from proximal and distal regions. (F) Cluster graph and volcano plot quantifying gene expression in the proximal and distal regions. (G) Bar graphs depicting the increase of up-regulated genes and decrease of down-regulated genes in the distal versus proximal regions. Asterisk denotes P value of <0.05; graphs show means ± SD.
Fig. 3
Fig. 3. Comparison of NK cell exhaustion in the tumor-on-a-chip microdevice with traditional 3D culture.
(A) Schematic representation of an experiment measuring immune exhaustion. NK cells and MCF7 cells were cocultured in a 1:3 ratio (0.5 million cells/1 ml:1.5 million cells/1 ml) for 7 days in a well plate. After 7 days, the NK cells were isolated, and gene expression and other characteristics were measured. This experiment shows similar exhaustion patterns in a well plate rather than a tumor on a chip device. (B) Clustergram showing changes in gene expression in the tumor-on-a-chip (ToC) compared with the petri dish experiments (Petri). (C and D) Bar graphs depicting the change in gene expression of exhaustion markers and activation/prosurvival genes in a tumor-on-a-chip device versus a petri dish. (E) Spider plot showing the 10 gene pathways more differentially affected in the tumor-on-a-chip microdevice compared with experiments performed in traditional well plates. NRMOP, negative regulation of multicellular organismal process; PRISP, positive regulation of immune system process; PRCA, positive regulation of cell activation; PRCP, positive regulation of cytokine production. These pathways were identified as the most affected using the GSEA software. Asterisk denotes P value of <0.05; graphs show means ± SD.
Fig. 4
Fig. 4. Effect of ICIs and IDO-1 inhibitors in traditional assays and the tumor-on-a-chip.
(A) The potential effect of atezolizumab (anti–PD-L1 antibody) and epacadostat (IDO-1 inhibitor) was evaluated in traditional well plates. A confluent monolayer of MCF7 was seeded on 96-well plates, and NK-92 cells were added 24 hours later (9 MCF7:1 NK ratio) with/without the IDO-1 inhibitor or the PD-L1 antibody. Confocal images showed no significant improvement on NK-92 cell cytotoxic potential. (B) Similar experiment evaluating epacadostat and atezolizumab in the tumor-on-a-chip microdevice. Confocal images demonstrated that both the PD-L1 antibody and IDO-1 inhibitor increased MCF7 cell necrosis. Dead cells (shown in red) concentrated in the vicinities of the lumen, whereas live MCF7 cells (shown in green) remained present in the farthest (distal) region. Asterisk denotes P value of <0.05; graphs show means ± SD.
Fig. 5
Fig. 5. NK cell recovery from the tumor-on-a-chip platform.
(A) Schematic representation of the experiments evaluating the recovery capacity of NK-92 cells. NK-92 and MCF7 cells were cocultured (0.5 million NK:1.5 million MCF7 cells/ml) for 7 days. Then, NK-92 cells were isolated from the tumor-on-a-chip and subcultured in traditional flasks for an additional week before analyzing their gene expression. (B) Clustergram and volcano plot comparing gene expression in exposed NK cells with naïve NK cells. (C) Bar graphs showing multiple genes that were up-/down-regulated in the tumor-on-a-chip microdevice but returned to the basal expression after 1 week. (D) Bar graphs showing genes that showed partial or no recovery to the basal expression compared with naïve NK cells. Asterisk denotes P value of <0.05; graphs show means ± SD.
Fig. 6
Fig. 6. Functional changes in exposed NK cells.
(A) Exposed NK cells isolated from the tumor-on-a-chip microdevice still exhibited multiple gene expression alterations after a week in traditional flasks. (B) Optical metabolic imaging was used to visualize intracellular NAD(P)H and FAD fluorescence intensities [redox ratio = NAD(P)H intensity divided by FAD intensity] and mean fluorescence lifetimes (τm). (C) Violin plots showing the analysis of NK cell redox ratio based on NAD(P)H and FAD intensity. Exposed NK cells had decreased redox ratio compared with naïve NK cells, indicating metabolic rewiring. In addition, exposed NK cells showed decreased NAD(P)H τm and increased FAD τm. (D) Violin plots depicted changes in redox ratio, NAD(P)H τm, and FAD τm caused by different metabolic inhibitors and chemokines: 2DG, glycolysis inhibitor; etomoxir (ETO), fatty acid oxidation inhibitor; oligomycin (Oligo), electron transport chain complex V inhibitor; DMSO, dimethyl sulfoxide. (E and F) Time-lapse microscopy analyzing exposed NK cell migration in 3D collagen hydrogels. Individual NK cell trajectories are depicted in different colors. Violin plot showing slower migration speed in exposed NK cells. (G and H) Cytotoxicity analysis of exposed and naïve NK cells. A monolayer of MCF7 was seeded in traditional well plates, and naïve or exposed NK cells were added on top. Confocal images showed the killing capacity of both exposed and naïve NK cells. (I) Bar graph analyzing the destruction of MCF7 cells shown in (H) for different ratios of tumor cells (TC) to NK cells (NK). Exposed NK cells exhibited decreased cytotoxic capacity compared with naïve NK cells. *P < 0.05, **P < 0.01, ***P < 0.005, ****P < 0.001; graphs show means ± SD.
Fig. 7
Fig. 7. NK cell dysfunction marker comparison.
(A) Scheme shows molecular changes observed in vivo in dysfunctional (i.e., exhausted and anergic) NK cells. (B) Scheme depicts changes observed in NK-92 cells (seeding cell density: 0.5 million cells/ml) in the model after 7 days in coculture with MCF7 cells (seeding cell density: 1.5 million cells/ml).

References

    1. Siegel R. L., Miller K. D., Jemal A., Cancer statistics, 2020. CA Cancer J. Clin. 70, 7–30 (2020). - PubMed
    1. Liu D., CAR-T “the living drugs”, immune checkpoint inhibitors, and precision medicine: A new era of cancer therapy. J. Hematol. Oncol. 12, 113 (2019). - PMC - PubMed
    1. Schultz L., Mackall C., Driving CAR T cell translation forward. Sci. Transl. Med. 11, eaaw2127 (2019). - PubMed
    1. Grosser R., Cherkassky L., Chintala N., Adusumilli P. S., Combination immunotherapy with CAR T cells and checkpoint blockade for the treatment of solid tumors. Cancer Cell 36, 471–482 (2019). - PMC - PubMed
    1. Mardiana S., Solomon B. J., Darcy P. K., Beavis P. A., Supercharging adoptive T cell therapy to overcome solid tumor–induced immunosuppression. Sci. Transl. Med. 11, eaaw2293 (2019). - PubMed

Publication types

Substances