. 2021 Feb 17;13(581):eaaz3088.
doi: 10.1126/scitranslmed.aaz3088.

Analysis of recurrently protected genomic regions in cell-free DNA found in urine

Affiliations

Analysis of recurrently protected genomic regions in cell-free DNA found in urine

Havell Markus et al. Sci Transl Med. .

Abstract

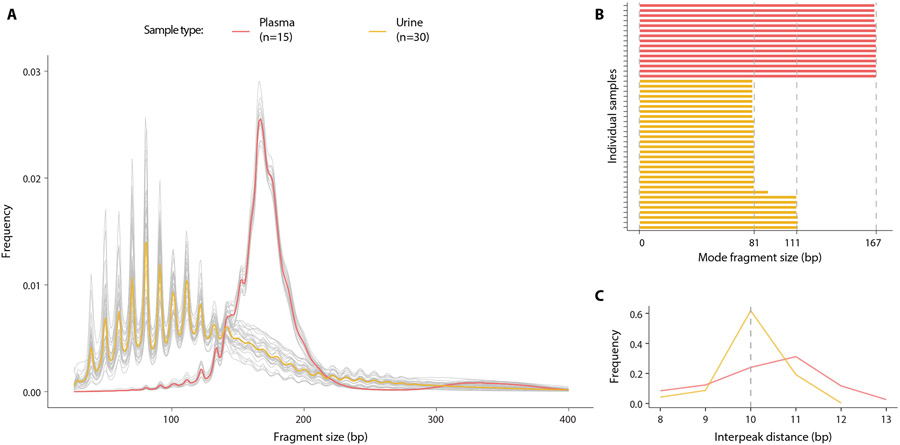
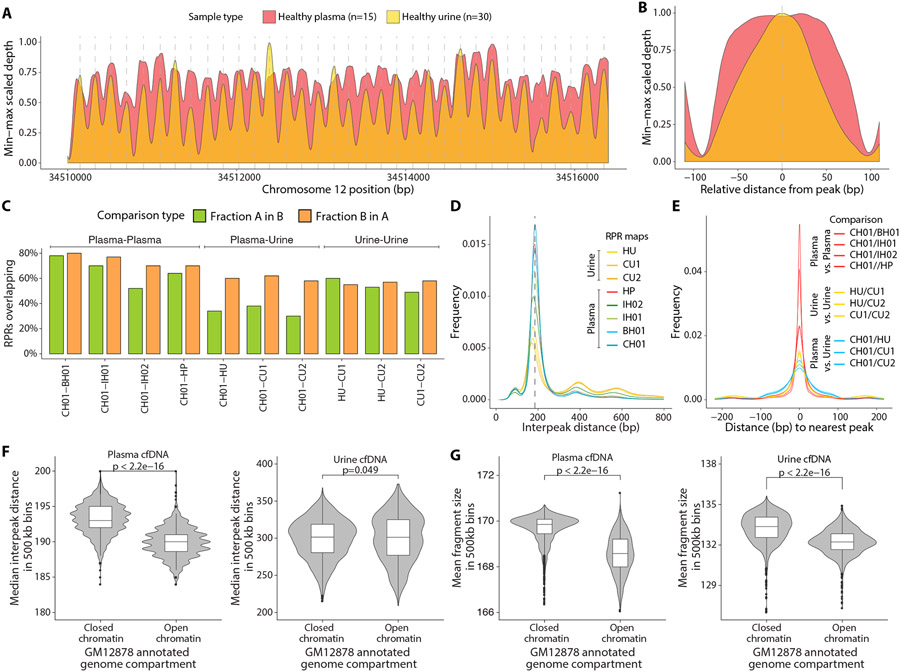
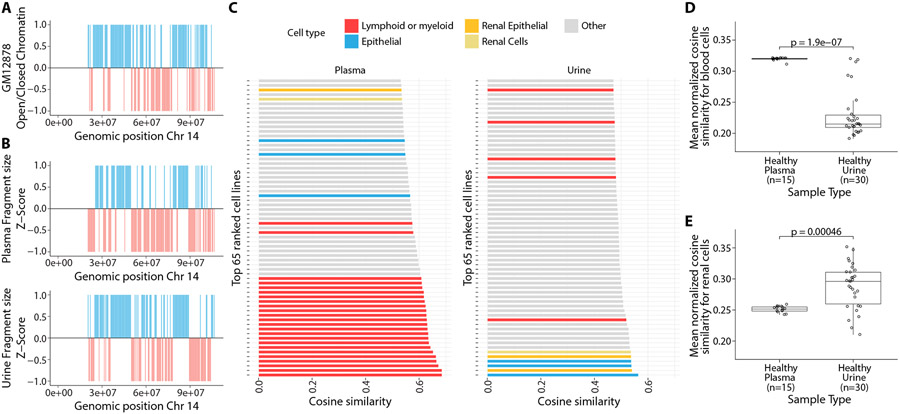
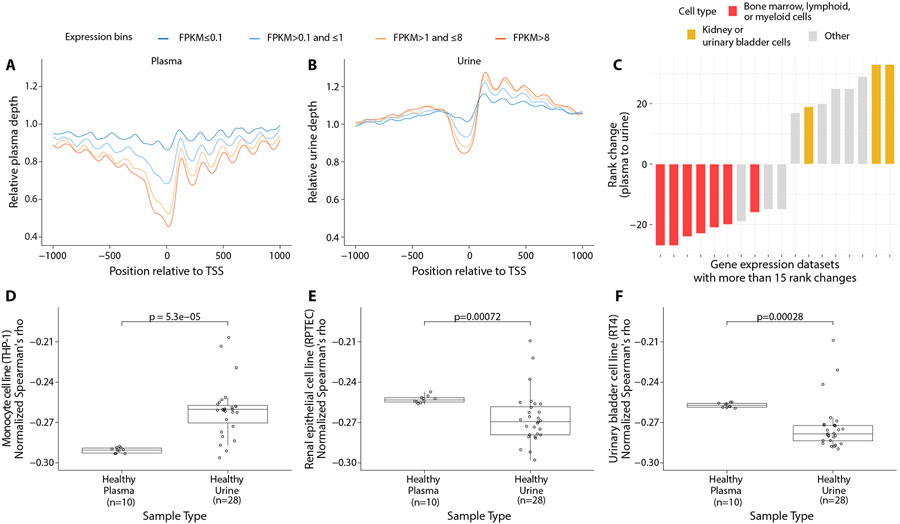
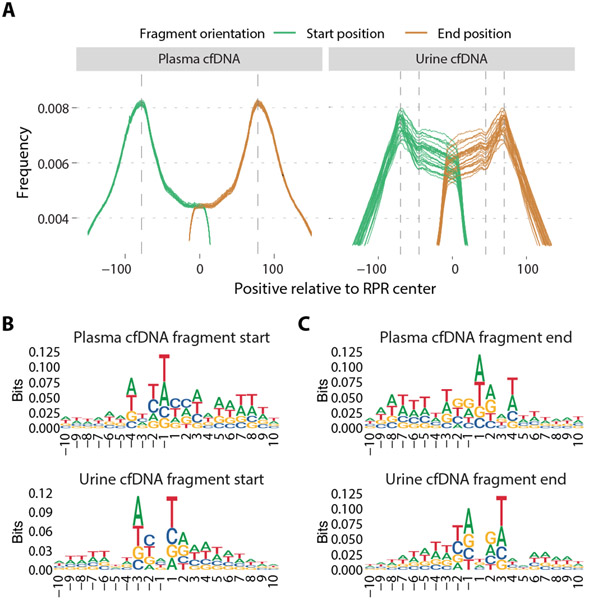
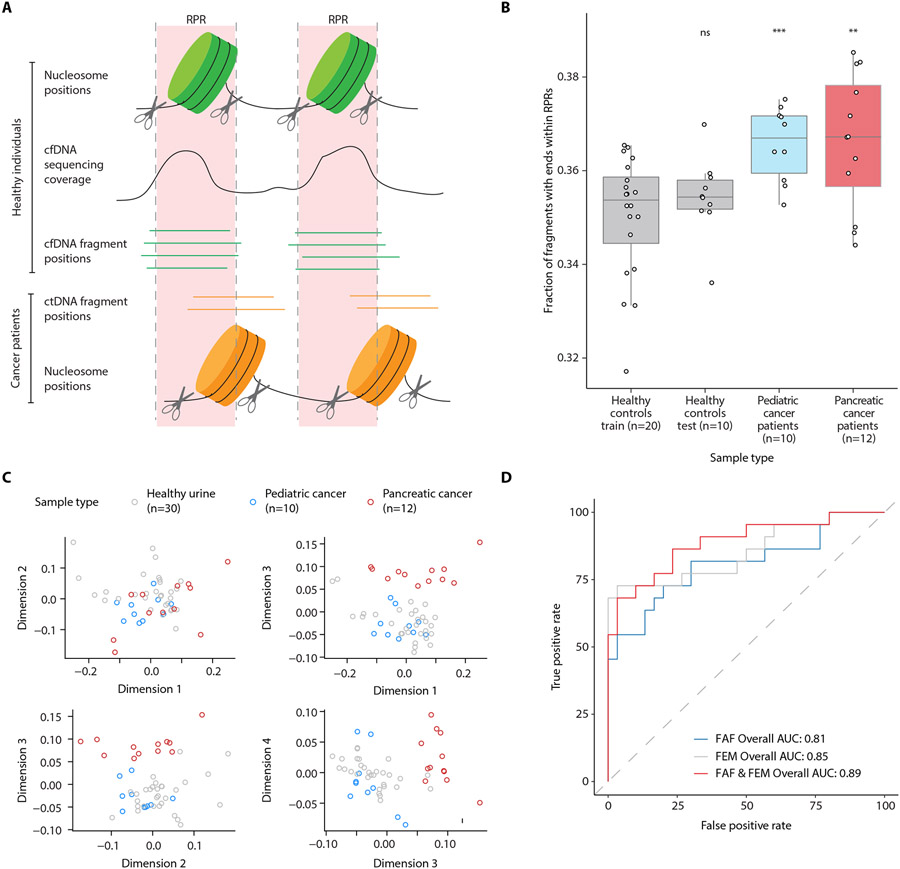
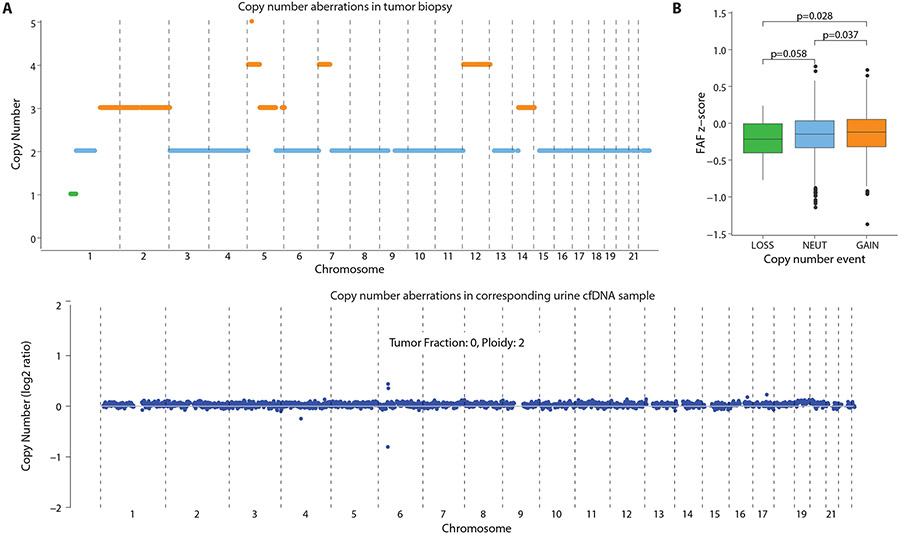
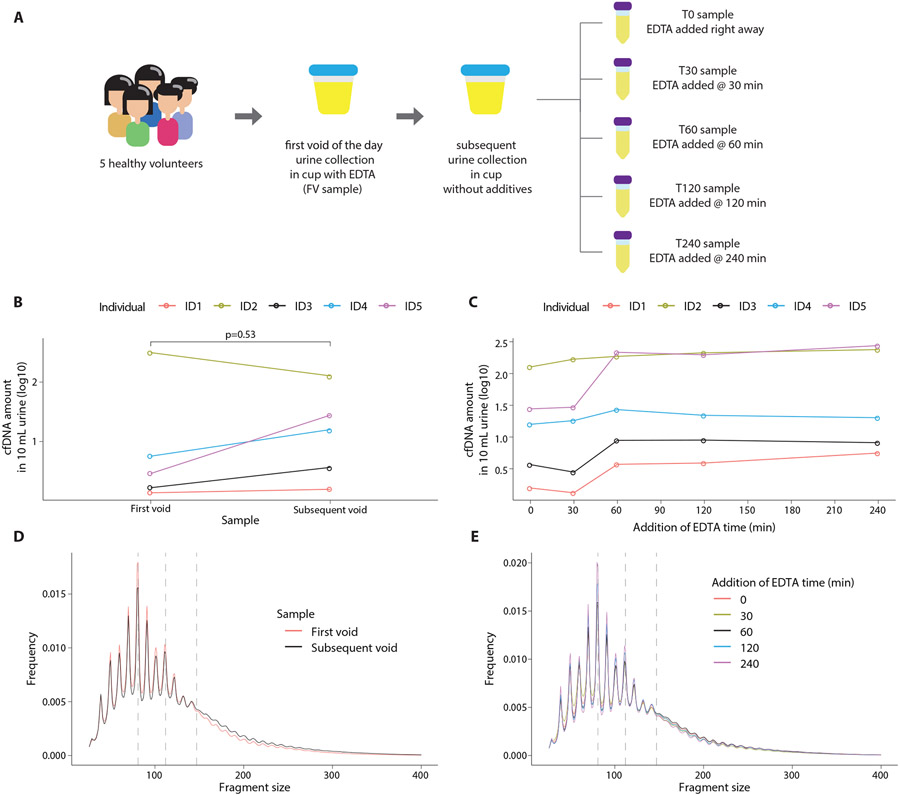
Cell-free DNA (cfDNA) in urine is a promising analyte for noninvasive diagnostics. However, urine cfDNA is highly fragmented. Whether characteristics of these fragments reflect underlying genomic architecture is unknown. Here, we characterized fragmentation patterns in urine cfDNA using whole-genome sequencing. Size distribution of urine cfDNA fragments showed multiple strong peaks between 40 and 120 base pairs (bp) with a modal size of 81- and sharp 10-bp periodicity, suggesting transient protection from complete degradation. These properties were robust to preanalytical perturbations, such as at-home collection and delay in processing. Genome-wide sequencing coverage of urine cfDNA fragments revealed recurrently protected regions (RPRs) conserved across individuals, with partial overlap with nucleosome positioning maps inferred from plasma cfDNA. The ends of cfDNA fragments clustered upstream and downstream of RPRs, and nucleotide frequencies of fragment ends indicated enzymatic digestion of urine cfDNA. Compared to plasma, fragmentation patterns in urine cfDNA showed greater correlation with gene expression and chromatin accessibility in epithelial cells of the urinary tract. We determined that tumor-derived urine cfDNA exhibits a higher frequency of aberrant fragments that end within RPRs. By comparing the fraction of aberrant fragments and nucleotide frequencies of fragment ends, we identified urine samples from cancer patients with an area under the curve of 0.89. Our results revealed nonrandom genomic positioning of urine cfDNA fragments and suggested that analysis of fragmentation patterns across recurrently protected genomic loci may serve as a cancer diagnostic.


Figures

Fig. 1:
Fig. 1:. Comparison of DNA fragment size between plasma and urine samples.
(A) Size distributions of genome-wide DNA fragments were measured in samples of plasma and urine. Grey lines show individual samples,the red line shows the mean in the plasma samples and the yellow line the mean in urine samples. (B) Modal size in individual plasma and urine samples was defined as the fragment size with the highest frequency. (C) Frequency of occurrence of interpeak (peak-to-peak) distance of periodic peaks in fragment size for plasma and urine samples was plotted.
Fig. 2:
Fig. 2:. Relationship between sequencing coverage of cfDNA fragments in plasma and urine samples.
(A) LOESS smoothed and min-max scaled physical sequencing coverage of pooled plasma and urine samples in an ~ 6000 bp genomic region with stable nucleosomes (Chromosome 12p11.1). The vertical dashed grey lines depict the local maxima of each peak for the pooled urine samples. (B) Mean smoothed physical sequencing coverage calculated by centering all peaks at the local maxima. (C) Percentage of RPR calls overlapping in pairwise comparisons of genome-wide RPR maps. Each comparison is between two plasma maps (CH01-BH01, CH01-IH01, CH01-IH02, CH01-HP), two urine maps (HU-CU1, HU-CU2, CU1-CU2), or between a plasma and a urine map (CH01-HU, CH01-CU1, CH01-CU2). (D) Distribution of distances between adjacent peak centers (interpeak distance) in each RPR map. (E) Distribution of distances between nearest peaks in pairwise comparison of any two RPR maps. The distributions of distances between corresponding peak centers are shown. (F) Comparison of plasma and urine median interpeak distance in 500 kb bins annotated as closed chromatin regions or open chromatin regions from Hi-C chromatin contact map of a lymphoblastoid cell line (GM12878). (G) Comparison of plasma and urine mean fragment size in 500 kb bins annotated as closed or open chromatin regions.
Fig. 3:
Fig. 3:. Comparison of cfDNA fragment size with chromatin accessibility across cell types.
(A) Distribution of open (red) and closed chromatin (blue) compartments in non-overlapping 500 kb bins on chromosome 14 from Hi-C chromatin contact map of a lymphoblastoid cell line (GM12878). (B) Distribution of median cfDNA fragment size in corresponding 500 kb bins, normalized to a z-score for pooled plasma samples (upper) and pooled urine samples(lower). Bins with negative and positive z-score values were transformed to −1 and 1 and colored red and blue, respectively. (C) 65 cell lines or tissues with highest cosine similarity between cfDNA fragment size and DHS sites in 500 kb bins across the genome. (D) Comparison of mean quantile normalized cosine similarity scores with blood cells [bone marrow, lymphoid, or myeloid cell lines (n = 24)] in individual plasma and urine samples. (E) Comparison of mean quantile normalized cosine similarity scores with renal tissues and renal epithelial cell lines (n=4 cell lines and tissues) in individual plasma and urine samples.
Fig. 4:
Fig. 4:. Comparison of cfDNA coverage at transcription start sites and correlation to gene expression across cell types.
(A-B) Mean pooled plasma and urine sequencing depth at the transcription start sites (TSS) of genes binned by their expression in fragments per kilobase of transcript per million mapped reads (FPKM). Gene expression amounts in plasma were used for this analysis. (C) Rank changes in correlation between sequencing coverage in the nucleosome-depleted region and gene expression across plasma and urine cfDNA. Cell lines whose ranks changed by at least 15 positions are shown here. (D-F) Comparison of mean quantile normalized Spearman's ρ for gene expression data from a monocyte cell line (D), renal epithelial cell line (E), and urinary bladder cell line (F) in individual plasma and urine samples.
Fig. 5:
Fig. 5:. Characterization of cfDNA fragment end sites.
(A) Genome-wide distribution of fragment start and end sites of individual plasma and urine samples relative to RPR centers. Comparison was made with a plasma-based RPR map (CH01) for plasma cfDNA samples and a urine-based RPR map (HU) for urine cfDNA samples. The vertical lines are drawn at 77 bp downstream and upstream from the RPR center for the plasma cfDNA distribution and at 70 bp and 45 bp downstream and upstream from the RPR center for the urine cfDNA distribution. (B-C) Nucleotide frequencies surrounding 10 bp upstream and downstream of fragment start positions (B) and end positions (C) in pooled plasma and urine cfDNA samples. Position 1 corresponds to the first base of the fragment in (B) and position −1 corresponds to the last base of the fragment in (C).
Fig. 6:
Fig. 6:. Evaluation of aberrant cfDNA fragments in urine from patients with cancer.
(A) Schematic representation of aberrant cfDNA fragments within RPR regions in urine samples from patients with cancer. In healthy individuals, fragment start and end positions flank regions protected by nucleosomes and are clustered away from RPRs. In patients with cancer, differences in nucleosome positioning and transcription factor binding in cancer cells that contribute cfDNA into urine may lead to a higher abundance of fragment start and end sites within RPRs. (B) Fraction of urine cfDNA reads starting or ending within RPRs (up to a maximum distance of 65 bp from the RPR center) inferred from pooled urine cfDNA data from 20 controls (training set). The fractions from the training set are compared to urine samples from 10 additional controls (test set), 10 patients with pediatric cancer, and 12 patients with pancreatic cancer. Statistical differences were determined by t test (ns, p > 0.05; **, p < 0.01; ***, p < 0.001). (C) Multidimensional scaling (MDS) analysis of nucleotide frequencies in 10 bp region surrounding urine cfDNA fragment start and end sites. (D) ROC analysis for classifying urine samples from controls and patients with cancer using fraction of aberrant fragments (FAF), fragment end motifs (FEM), or both. For FEM and for the combination of FAF and FEM, probabilities from a logistic regression fit to the first 4 MDS dimensions and FAF was used for ROC analysis.
Fig. 7:
Fig. 7:. Comparison of fraction of aberrant fragments in urine cfDNA with copy number aberrations in the tumor and urine.
(A) Copy number aberrations observed in a patient with rhabdomyosarcoma. Upper graph shows DNA from the tumor biopsy with copy number gain indicated in orange, no change in blue, and loss in green. Lower graph shows the urine cfDNA sample analyzed by read density analysis with DNA from the tumor below the limit of detection. (B) FAF in a corresponding urine sample with copy number gain, no change (NEUT), and loss regions. Statistical differences were determined by one-tailed t test.
Fig. 8:
Fig. 8:. Pre-analytical variation in urine cfDNA fragmentation patterns.
(A) Schematic representation of the experiment design. Paired urine samples were collected from 5 healthy individuals, including first void of the day and a subsequent sample. The subsequent sample was processed in 5 different aliquots with increasing delays in processing. (B) Comparison of cfDNA yield between the first void sample (FV) and the subsequent sample (T0). cfDNA yield was measured using fluorometry. (C) Comparison of cfDNA yield between 5 aliquots of the subsequent sample. cfDNA yield was measured using fluorometry.(D) Comparison of cfDNA fragment size distributions between first void (FV) and subsequent sample (T0). (E) Comparison of cfDNA fragment size distributions among 5 aliquots of the subsequent sample. In D and E, vertical dashed lines are placed at 81 bp, 112 bp, and 147 bp as visual guides.

References

    1. Wong FC, Lo YM, Prenatal Diagnosis Innovation: Genome Sequencing of Maternal Plasma. Annu Rev Med 67, 419–432 (2016). - PubMed
    1. Burnham P, Khush K, De Vlaminck I, Myriad Applications of Circulating Cell-Free DNA in Precision Organ Transplant Monitoring. Ann Am Thorac Soc 14, S237–S241 (2017). - PMC - PubMed
    1. Wan JCM, Massie C, Garcia-Corbacho J, Mouliere F, Brenton JD, Caldas C, Pacey S, Baird R, Rosenfeld N, Liquid biopsies come of age: towards implementation of circulating tumour DNA. Nat Rev Cancer 17, 223–238 (2017). - PubMed
    1. Murtaza M, Caldas C, Nucleosome mapping in plasma DNA predicts cancer gene expression. Nat Genet 48, 1105–1106 (2016). - PubMed
    1. Cristiano S, Leal A, Phallen J, Fiksel J, Adleff V, Bruhm DC, Jensen SO, Medina JE, Hruban C, White JR, Palsgrove DN, Niknafs N, Anagnostou V, Forde P, Naidoo J, Marrone K, Brahmer J, Woodward BD, Husain H, van Rooijen KL, Orntoft MW, Madsen AH, van de Velde CJH, Verheij M, Cats A, Punt CJA, Vink GR, van Grieken NCT, Koopman M, Fijneman RJA, Johansen JS, Nielsen HJ, Meijer GA, Andersen CL, Scharpf RB, Velculescu VE, Genome-wide cell-free DNA fragmentation in patients with cancer. Nature, (2019). - PMC - PubMed

Publication types