. 2021 Feb 17;13(581):eabd7522.
doi: 10.1126/scitranslmed.abd7522.

APOE immunotherapy reduces cerebral amyloid angiopathy and amyloid plaques while improving cerebrovascular function

Affiliations

APOE immunotherapy reduces cerebral amyloid angiopathy and amyloid plaques while improving cerebrovascular function

Monica Xiong et al. Sci Transl Med. .

Abstract

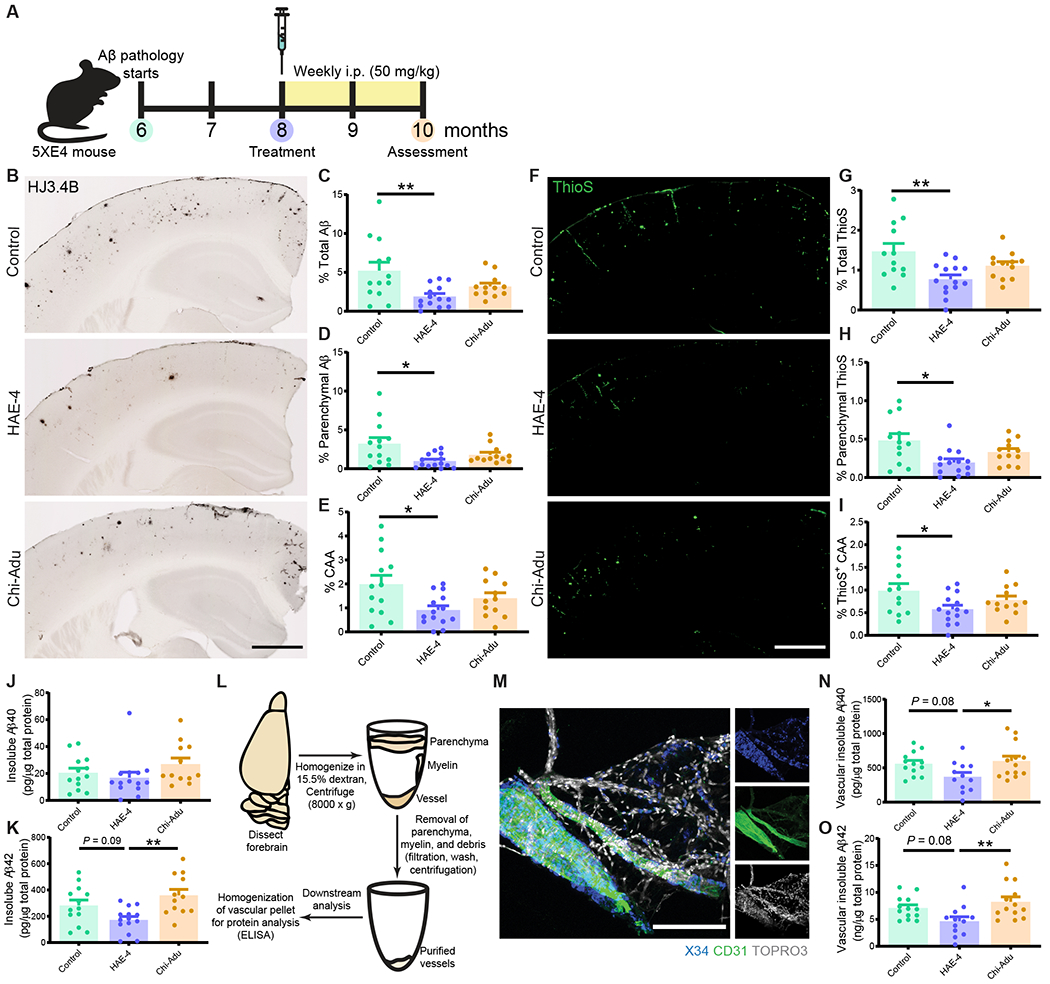
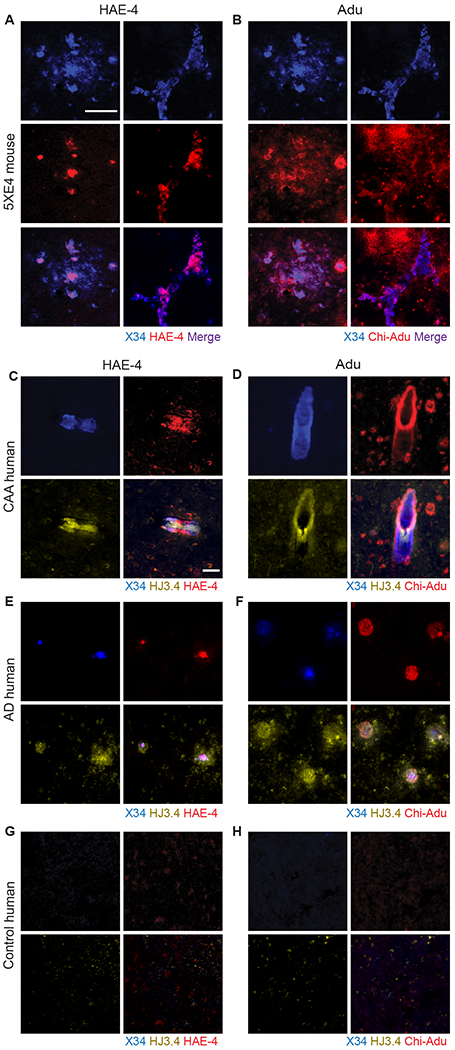
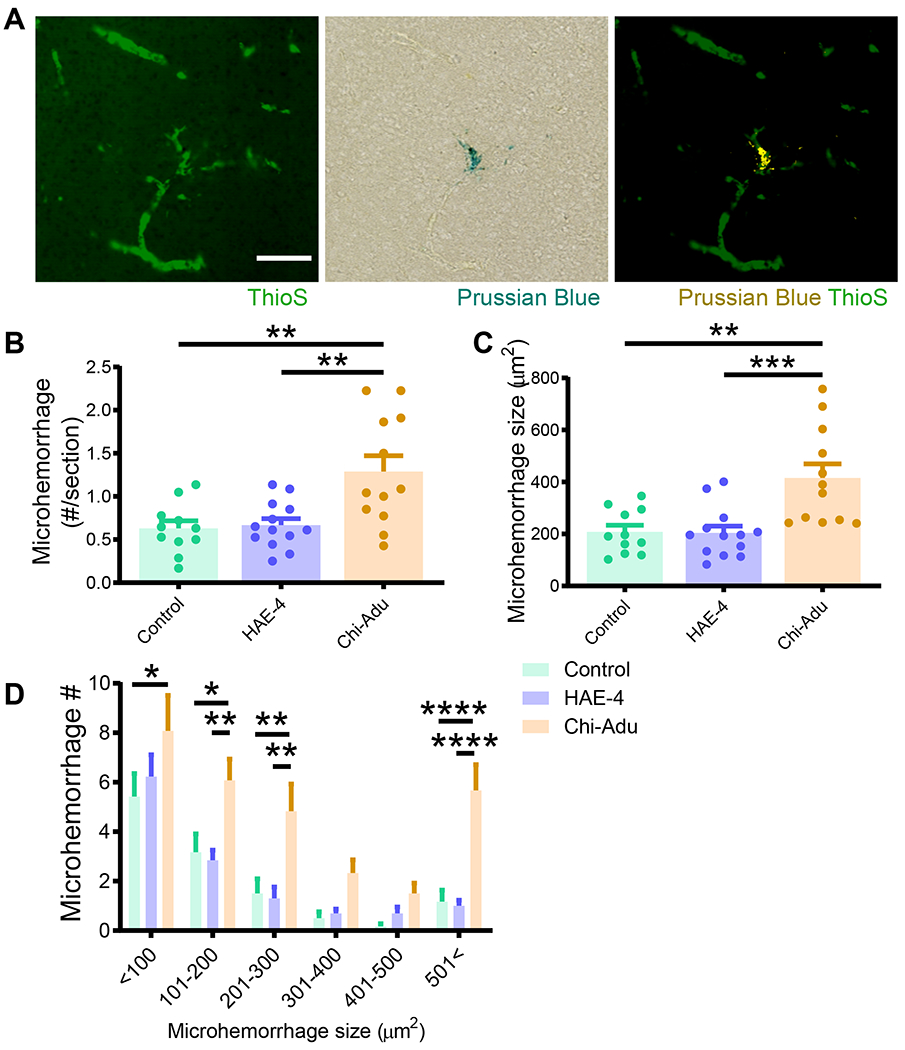
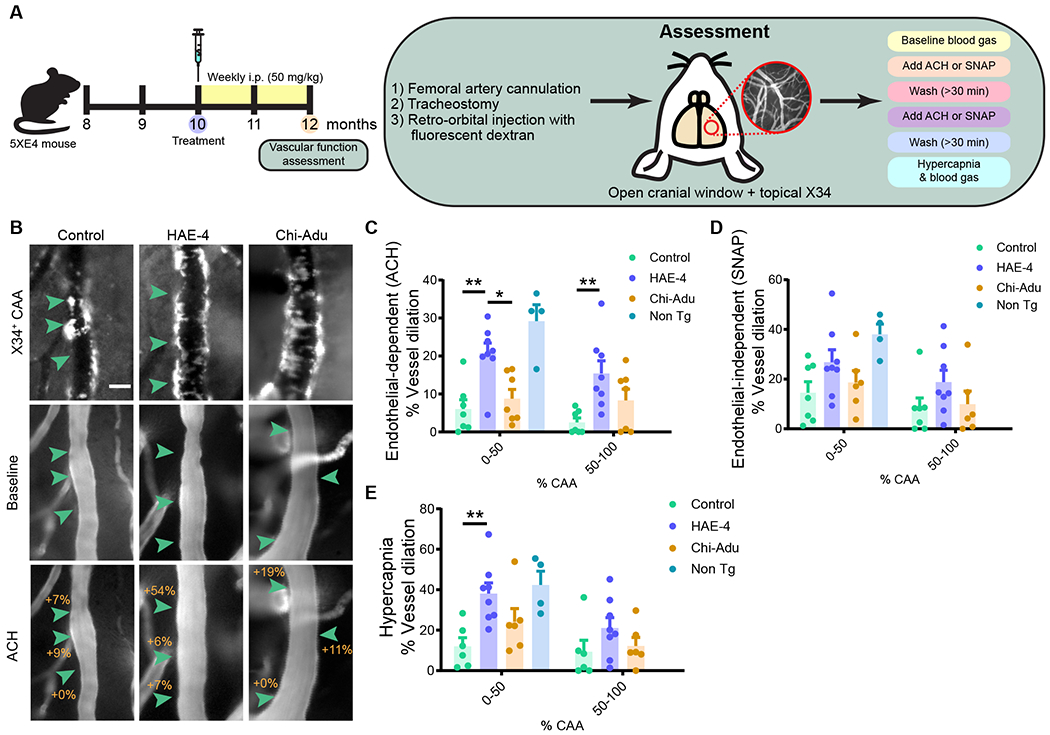
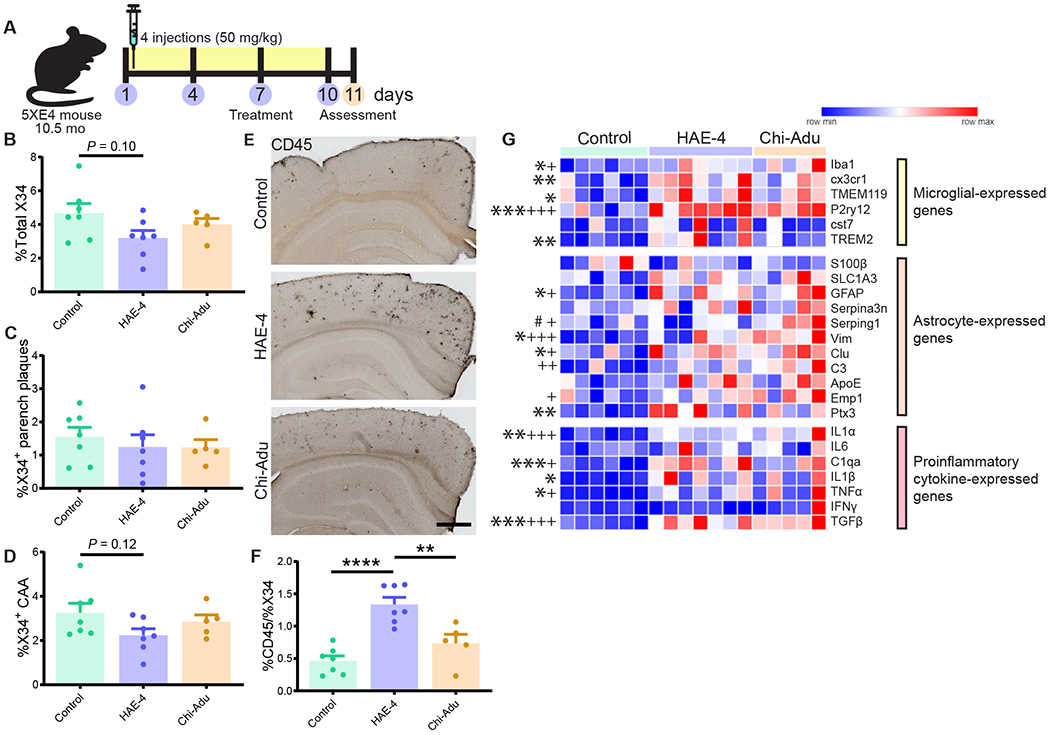
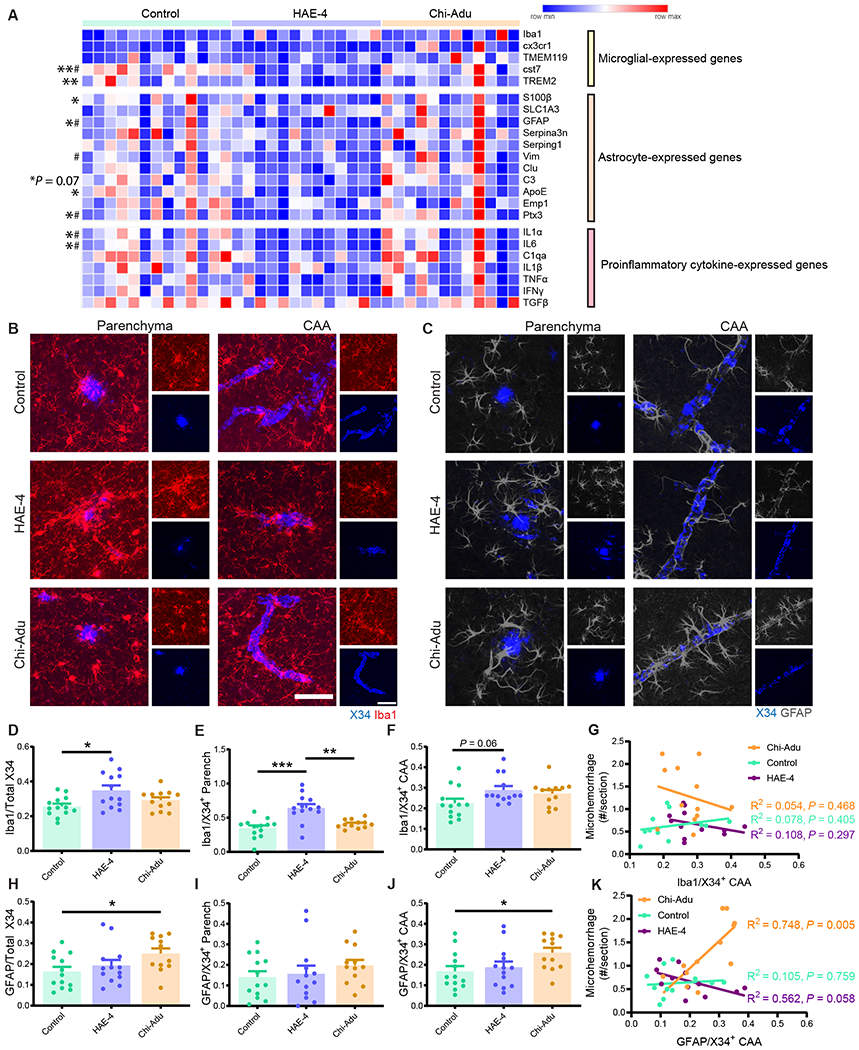
The ε4 allele of the apolipoprotein E (APOE) gene is the strongest genetic risk factor for late-onset Alzheimer's disease (AD) and greatly influences the development of amyloid-β (Aβ) pathology. Our current study investigated the potential therapeutic effects of the anti-human APOE antibody HAE-4, which selectively recognizes human APOE that is co-deposited with Aβ in cerebral amyloid angiopathy (CAA) and parenchymal amyloid pathology. In addition, we tested whether HAE-4 provoked brain hemorrhages, a component of amyloid-related imaging abnormalities (ARIA). ARIA is an adverse effect secondary to treatment with anti-Aβ antibodies that can occur in blood vessels with CAA. We used 5XFAD mice expressing human APOE4 +/+ (5XE4) that have prominent CAA and parenchymal plaque pathology to assess the efficacy of HAE-4 compared to an Aβ antibody that removes parenchymal Aβ but increases ARIA in humans. In chronically treated 5XE4 mice, HAE-4 reduced Aβ deposition including CAA compared to a control antibody, whereas the anti-Aβ antibody had no effect on CAA. Furthermore, the anti-Aβ antibody exacerbated microhemorrhage severity, which highly correlated with reactive astrocytes surrounding CAA. In contrast, HAE-4 did not stimulate microhemorrhages and instead rescued CAA-induced cerebrovascular dysfunction in leptomeningeal arteries in vivo. HAE-4 not only reduced amyloid but also dampened reactive microglial, astrocytic, and proinflammatory-associated genes in the cortex. These results suggest that targeting APOE in the core of both CAA and plaques could ameliorate amyloid pathology while protecting cerebrovascular integrity and function.


Conflict of interest statement

Competing interests

D.M.H. and H.J. are listed as inventors on US patent application #20190270794 entitled “Anti-APOE antibodies” from Washington University on APOE antibodies. N.B.L and R.J.W. are employees at Denali. A.P.S. is an employee of Codexis but conducted this work at Denali. D.M.H. co-founded and is on the scientific advisory board of C2N Diagnostics. D.M.H. is on the scientific advisory board of Denali and consults for Genentech, Merck, and Idorsia. Washington University (D.M.H.) has a sponsored research agreement to work on APOE antibodies from NextCure. All other authors have no competing interests.

Figures

Fig. 1:
Fig. 1:. HAE-4 reduces parenchymal Aβ plaques and CAA in 5XE4 mice.
A, Schematic timeline of antibody treatment in 5XFAD (line 7031) x APOE4+/+ (5XE4) mice with CAA assessed at 10-months-old. B–E, Representative immunostainings of HJ3.4B for mixed pan-Aβ pathology (B) and quantification of percent area in cortex of total Aβ (C), parenchymal Aβ plaques (D), and CAA (E). Control IgG, n = 13; HAE-4, n = 14, chi-Adu, n = 12. Scale bar = 750 μm. F–I, Thioflavin S (ThioS) staining for insoluble, fibrillar plaques (F) with quantification for area covered by total amyloid (G), parenchymal plaques (H), and CAA (I) pathology in overlaying cortex (Control IgG, n = 12; HAE-4, n = 14, chi-Adu, n = 12). Scale bar = 750 μm. J, K, Insoluble Aβ40 (J) or Aβ42 (K) protein concentrations from bulk cortical tissue lysate homogenized in guanidine measured by ELISA and normalized to total protein concentration in cortex (Control IgG, n = 13; HAE-4, n = 14, chi-Adu, n = 12). L–O, Forebrain vessel isolation paradigm using dextran gradient centrifugation of a separate 5XE4 cohort treated with antibodies (L; Control IgG, n = 13; HAE-4, n = 12, chi-Adu, n = 13). Isolated brain vasculature fluorescently stained for X34+ fibrillar CAA, endothelial marker CD31, and nuclei marker TOPRO3. Scale bar = 150 μm. (M). Insoluble Aβ40 (N) and Aβ42 (O) protein concentrations assessed by ELISA from forebrain-extracted vessels sonicated in guanidine-HCL and normalized to total protein concentration. Control = Control IgG. Chi-Adu = Chimeric Aducanumab. Data expressed as mean ± SEM, one-way ANOVA with Tukey’s post hoc test (two-sided) performed for all statistical analyses except Kruskal-Wallis test with Dunn’s multiple comparisons test (two-sided) for parenchymal Aβ/ThioS, and Aβ40 analysis (D, H, J). *P < 0.05, **P < 0.01. No other statistical comparisons are significant unless indicated.
Fig. 2:
Fig. 2:. HAE-4 selectively binds dense core fibrillar plaques whereas chi-Adu recognizes both dense core and diffuse Aβ plaques.
A, B, Triple co-staining of X34, HAE-4 (A), and chi-Adu (B) in unfixed, cortical tissue of a 22-month-old 5XE4 male mouse for plaque-binding profile of antibodies to either APOE (HAE-4) or Aβ (chi-Adu). Left panel in A and B: parenchymal plaque. Right panel: CAA. Scale bar = 50 μm. C–H, Human autopsy brain tissue from patients (n = 1 per group) including CAA (C, D), AD only (E, F), or no pathology (G, H) stained with X34, HJ3.4 (pan-Aβ), HAE-4, or chi-Adu. Scale bar = 50 μm. Chi-Adu = Chimeric Aducanumab.
Fig. 3:
Fig. 3:. Chi-Adu exacerbates CAA-associated brain microhemorrhages whereas HAE-4 does not.
A, Dual labeling of ThioS+ fibrillar CAA and Prussian blue for hemosiderin deposits revealed CAA-associated microhemorrhages (right panel: microhemorrhage digitally converted to yellow) in 10-month-old 5XE4 mice. Scale bar = 100 μm. B, C, Prussian blue staining analysis for microhemorrhage frequency (B) and size (C) in 5XE4 mice dosed weekly for 8 weeks with antibody treatment (50 mg/kg, i.p.; Control IgG, n = 11; HAE-4, n = 13, chi-Adu, n = 12). One-way ANOVA with Tukey’s post hoc test (two-sided). D, Number of microhemorrhages binned in 100 μm2 increments for frequency/size distribution. Control = Control IgG. Chi-Adu = Chimeric Aducanumab. Data expressed as mean ± SEM, two-way ANOVA with Tukey’s post hoc test (two-sided). *P < 0.05, **P < 0.01, ***P < 0.001, ****P < 0.0001. No other statistical comparisons are significant unless indicated.
Fig. 4:
Fig. 4:. HAE-4 restores vascular function to CAA-laden leptomeningeal arteries in vivo.
A, Schematic of antibody treatment and experimental design in 12-month-old 5XE4 mice for assessment of pial vascular function using endothelial-dependent ACH, vascular smooth muscle cell-dependent SNAP, and CO2-induced hypercapnia. B, Representative images of X34+ CAA on vessel segment at baseline or after ACH exposure. C–E, Percent vasodilatory change calculated at baseline and after ACH (C, Control IgG, n = 7; HAE-4, n = 8, chi-Adu, n = 7, Non Tg, n = 4), SNAP (D, Control IgG, n = 7; HAE-4, n = 8, chi-Adu, n = 6, Non Tg, n = 4), or hypercapnia (E, Control IgG, n = 6; HAE-4, n = 8, chi-Adu, n = 6, Non Tg, n = 4). Scale bar = 25 μm. ACH = Acetylcholine. SNAP = S-Nitroso-N-acetyl-DL-penicillamine. Control = Control IgG. Chi-Adu = Chimeric Aducanumab. Non Tg = Non-transgenic. Green arrowheads indicate changes in percent dilation from baseline. Data expressed as mean ± SEM, one-way ANOVA comparison with Tukey’s post hoc test (two-sided) between treatment groups in vessels with less or more than 50% CAA coverage unless otherwise stated. *P < 0.05, **P < 0.01. Non-transgenic (n = 4) versus control IgG comparisons: ACH, P < 0.001; SNAP, P < 0.05; Hypercapnia, P < 0.05. Non-transgenic (n = 4) versus chi-Adu comparisons: ACH, P < 0.001; SNAP, P = 0.097. No other statistical comparisons are significant unless indicated or stated.
Fig. 5:
Fig. 5:. Strong glial response after acute HAE-4 and chi-Adu peripheral administration.
A, Schematic design of 10.5-month-old 5XE4 mice injected once every 3 days for 4 times and assessed at 11 months-of-age. B–D, Quantification of total X34+ (B), parenchymal (C), and CAA (D) fibrillar plaques (Control IgG, n = 7; HAE-4, n = 7, chi-Adu, n = 5). E, F, CD45 (activated microglia) staining and quantification in cortex (Control IgG, n = 7 mice; HAE-4, n = 7 mice, chi-Adu, n = 5 mice). G, Heatmap analysis of bulk cortical microglial, astrocytic, and pro-inflammatory cytokine gene expression pattern by qPCR (Control IgG, n = 6; HAE-4, n = 7, chi-Adu, n = 5). “*” denotes statistical significance for HAE-4 versus control (*P < 0.05, **P < 0.01, ***P < 0.001); “+” for chi-Adu versus control (+P < 0.05, +++P < 0.001).; “#” for HAE-4 versus chi-Adu (#P < 0.05). Parench = Parenchymal. Control = Control IgG. Chi-Adu = Chimeric Aducanumab. Data expressed as mean ± SEM, one-way ANOVA with Tukey’s post hoc test (two-sided). *P < 0.05, **P < 0.01, ***P < 0.001, ****P < 0.0001. No other statistical comparisons are significant unless indicated.
Fig. 6:
Fig. 6:. HAE-4 and chi-Adu treatments stimulate differential glial responses to Aβ plaques and CAA.
A, Relative expression of microglial, astrocytic, and pro-inflammatory transcripts from bulk cortex of antibody-treated 10-month-old 5XE4 mice (50 mg/kg, weekly i.p. for 8 weeks; Control IgG, n = 13; HAE-4, n = 13, chi-Adu, n = 12) measured via qPCR, clustered by antibody treatment, and normalized to control IgG gene expression. “*” denotes statistical significance for HAE-4 versus control (*P < 0.05, **P < 0.01); “#” for HAE-4 versus chi-Adu (#P < 0.05). Genes analyzed using one-way ANOVA with Dunnett’s multiple comparisons test: S100β, GFAP, Vim, IL1α. One-way ANOVA with Tukey’s post hoc test (two-sided) unless otherwise noted. B–C, Representative images of co-staining using X34 for fibrillar plaques and Iba1 for microglia (B) or GFAP for astrocytes (C) in cortex. D–G, Percent area of Iba1+ microglia colocalized with total X34 (D), parenchymal (E), or CAA plaques (F), normalized to respective percent area of plaque load (Iba1+X34+/X34+). Microglial colocalization with CAA correlated to microhemorrhage number per section (G; Pearson correlation: r = 0.279, R2 = 0.078, P = 0.405, control IgG (n = 11); r = 0.329, R2 = 0.108, P = 0.297, HAE-4 (n = 12); r = 0.232, R2 = 0.054, P = 0.468, chi-Adu (n = 12)). H–K, Percent colocalization of GFAP+ astrocytes and total X34 (H), parenchymal (I), or CAA plaques (J), normalized to respective percent area of amyloid load (GFAP+X34+/X34+). Correlation between colocalized astrocyte/CAA and microhemorrhage number per section (K; Pearson correlation: r = 0.105, R2 = 0.011, P = 0.759, control IgG (n = 11); r = 0.561, R2 = 0.315, P = 0.058, HAE-4 (n = 12); r = 0.748, R2 = 0.560, P = 0.005, chi-Adu (n = 12)). Large panel: Scale bar = 50 μm. Small panel: Scale bar = 50 μm. Parench = Parenchyma. Control = Control IgG. Chi-Adu = Chimeric Aducanumab. Data expressed as mean ± SEM, one-way ANOVA with Tukey’s post hoc test (two-sided) for all group comparisons except Kruskal-Wallis test with Dunn’s multiple comparisons test (two-sided) for data not normally distributed (F, H, and I). *P < 0.05, **P < 0.01, ***P < 0.001, ****P < 0.0001. No other statistical comparisons are significant unless indicated.

Comment in

References

    1. Long JM, Holtzman DM, Alzheimer Disease: An Update on Pathobiology and Treatment Strategies, Cell 179, 312–339 (2019). - PMC - PubMed
    1. Sperling R, Salloway S, Brooks DJ, Tampieri D, Barakos J, Fox NC, Raskind M, Sabbagh M, Honig LS, Porsteinsson AP, Lieberburg I, Arrighi HM, Morris KA, Lu Y, Liu E, Gregg KM, Brashear HR, Kinney GG, Black R, Grundman M, Amyloid-related imaging abnormalities in patients with Alzheimer’s disease treated with bapineuzumab: A retrospective analysis, Lancet Neurol. 11, 241–249 (2012). - PMC - PubMed
    1. Sperling RA, Jack CR, Black SE, Frosch MP, Greenberg SM, Hyman BT, Scheltens P, Carrillo MC, Thies W, Bednar MM, Black RS, Brashear HR, Grundman M, Siemers ER, Feldman HH, Schindler RJ, Amyloid-related imaging abnormalities in amyloid-modifying therapeutic trials: Recommendations from the Alzheimer’s Association Research Roundtable Workgroup, Alzheimer’s Dement. 7, 367–385 (2011). - PMC - PubMed
    1. Wilcock DM, Rojiani A, Rosenthal A, Subbarao S, Freeman MJ, Gordon MN, Morgan D, Passive immunotherapy against Aβ in aged APP-transgenic mice reverses cognitive deficits and depletes parenchymal amyloid deposits in spite of increased vascular amyloid and microhemorrhage, J. Neuroinflammation 1, 1–11 (2004). - PMC - PubMed
    1. Racke MM, Boone LI, Hepburn DL, Parsadainian M, Bryan MT, Ness DK, Piroozi KS, Jordan WH, Brown DD, Hoffman WP, Holtzman DM, Bales KR, Gitter BD, May PC, Paul SM, DeMattos RB, Exacerbation of cerebral amyloid angiopathy-associated microhemorrhage in amyloid precursor protein transgenic mice by immunotherapy is dependent on antibody recognition of deposited forms of amyloid β, J. Neurosci. 25, 629–636 (2005). - PMC - PubMed

Publication types

LinkOut - more resources