. 2021 Feb 17;12(1):1106.
doi: 10.1038/s41467-021-21295-0.

Expanded catalog of microbial genes and metagenome-assembled genomes from the pig gut microbiome

Affiliations

Expanded catalog of microbial genes and metagenome-assembled genomes from the pig gut microbiome

Congying Chen et al. Nat Commun. .

Abstract

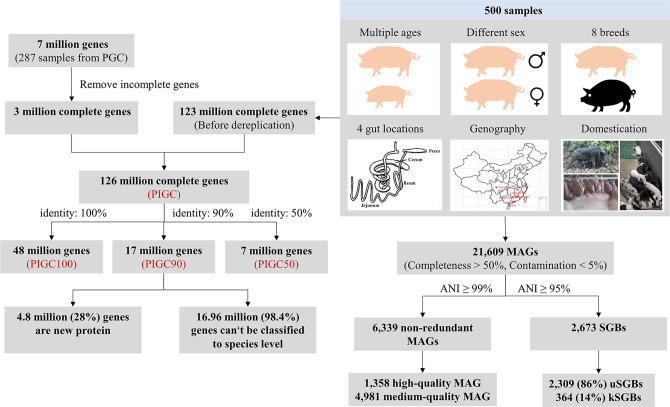
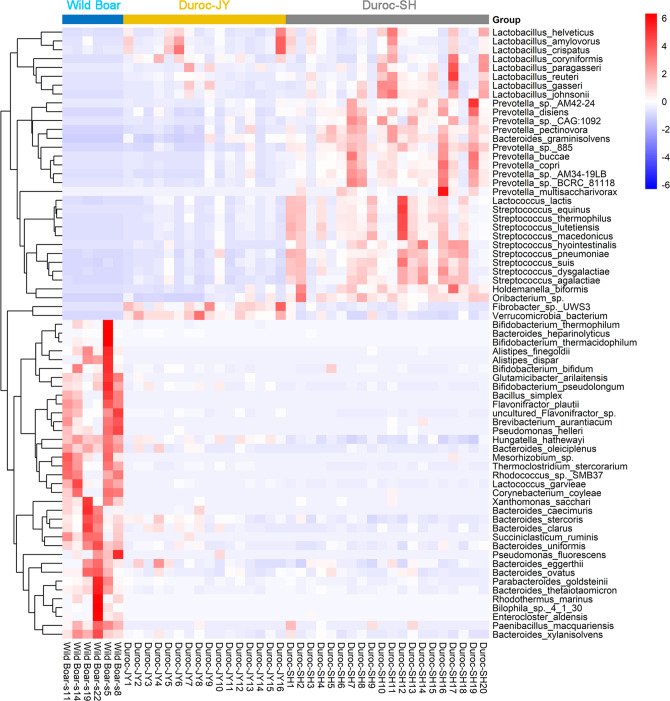
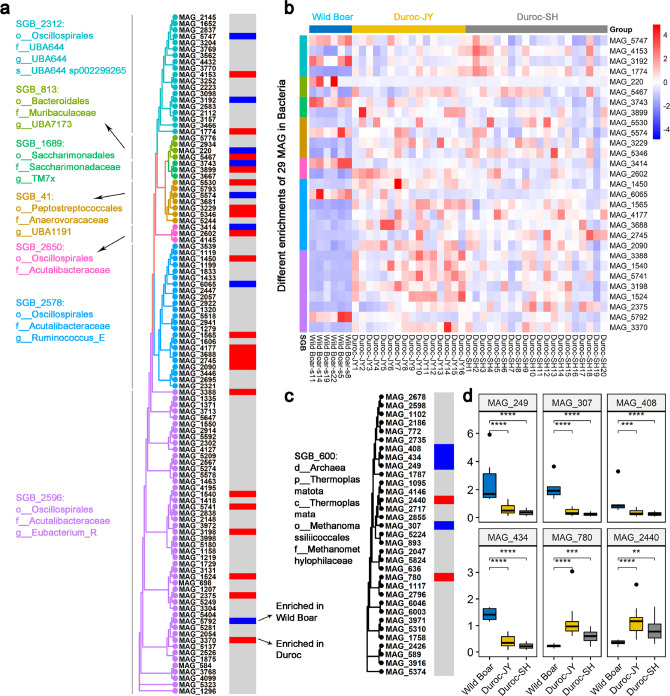
Gut microbiota plays an important role in pig health and production. Still, availability of sequenced genomes and functional information for most pig gut microbes remains limited. Here we perform a landscape survey of the swine gut microbiome, spanning extensive sample sources by deep metagenomic sequencing resulting in an expanded gene catalog named pig integrated gene catalog (PIGC), containing 17,237,052 complete genes clustered at 90% protein identity from 787 gut metagenomes, of which 28% are unknown proteins. Using binning analysis, 6339 metagenome-assembled genomes (MAGs) were obtained, which were clustered to 2673 species-level genome bins (SGBs), among which 86% (2309) SGBs are unknown based on current databases. Using the present gene catalog and MAGs, we identified several strain-level differences between the gut microbiome of wild boars and commercial Duroc pigs. PIGC and MAGs provide expanded resources for swine gut microbiome-related research.


Conflict of interest statement

The authors declare no competing interests.

Figures

Fig. 1
Fig. 1. Pipeline for the construction of pig integrated gene catalog (PIGC) and metagenome-assembled genomes (MAGs).
Metagenomic sequencing data from the samples spanning age, sex, breed, gut location, geography, and domestication, as well as a pig gene catalog (PGC) from 287 metagenome data were integrated and used to construct the PIGC catalog. The complete genes were clustered at 100, 90, and 50% amino acid identity to generate nonredundant gene catalogs of PIGC100, PIGC90, and PIGC50. The reconstructed microbial genomes were clustered to strain-level and species-level genome bins (SGBs) at 99% and 95% of the average nucleotide identity (ANI), respectively. The 6339 nonredundant MAGs were divided into medium-quality MAGs (more than 50% completeness and <5% contamination) and high-quality MAGs (more than 90% completeness and <5% contamination). SGBs containing at least one reference genome (or metagenome-assembled genome) in the Genome Taxonomy Database (GTDB) were considered as known SGBs (kSGB). The SGBs without reference genomes were considered as unknown SGBs (uSGBs).
Fig. 2
Fig. 2. Contribution of sequencing depth and sample sources to the gene content of the PIGC.
a Association of predicted gene number with the sequencing depth (n = 301). The predicted gene number was increased significantly following the sequencing depth. Adjusted R-squared and P-values were calculated by a linear regression model in R (v3.6.2). b The distribution of the gene numbers following the relative abundances. The gene abundances shown in the x-axis were average abundance of each gene (fpkm) in 500 samples. The blue bars indicate the numbers of genes under the average abundance, the green bars indicate the numbers of genes above the average abundance, and the red bar shows the number of genes at the average abundance. c The numbers (percentages) of nonredundant genes in the PIGC90 shared among different proportions of samples. The values next to the dot indicate the number and proportion of genes in the PIGC90 shared among each proportion of samples. Most of the genes are low prevalence. d Contribution of different sample sources to gene content of the PIGC. All 500 samples were divided into six subsets, including feces samples from wild boars (WB_feces, n = 6), lumen samples from the cecum of wild boars (WB_cecum, n = 8), the feces samples from adult domestic pigs (Dom_feces, n = 427), lumen samples from the cecum of adult domestic pigs (Dom_cecum, n = 12), lumen samples from the small intestine of adult domestic pigs (SI, n = 8), and feces samples from piglets (piglet, n = 39). Vertical bars represent the number of genes shared between the specific study sets highlighted with black dots in the lower panel. Horizontal bars in the lower panel indicate the total number of genes contained in each sample subset. e The proportions of sample source-specific genes having high abundance (≥ average abundance) in the corresponding samples that they came from.
Fig. 3
Fig. 3. Core bacterial taxa and functional capacities of pig gut microbiome.
a Numbers (percentages) of shared bacterial taxa among different proportions of samples at the phylum (red), genus (green), and species (blue) level. The percentage of shared items and the proportion of shared samples are represented on the y- and x-axis, respectively. The number and the percentage for each item that are shared in 20, 50, 90, and 100% of samples are indicated in the Figure. Nineteen phyla, 234 genera, and 254 species were shared in 90% samples and defined as core bacteria. b The top 20 bacterial species in relative abundances in ileum lumen, cecum lumen, and feces, respectively. The yellow color indicates the species in the top 20 lists of all three gut locations, and the colors corresponding to boxplots show the top 20 species specific to each gut location. The log10 (relative abundance) values are shown on the x-axis. c Numbers (percentages) of shared function items among different proportions of samples for KEGG orthologues (red), KEGG pathways (olive), CAZy family (cyan), and eggNOG (purple). Other legends are like (a). Boxplots show median, 25th and 75th percentile, the whiskers indicate the minima and maxima, and the points laying outside the whiskers of boxplots represent the outliers.
Fig. 4
Fig. 4. Taxonomic annotation and phylogenetic tree of 6339 metagenome-assembled genomes (MAGs).
a Taxonomic classification of 6339 MAGs at different levels. b Phylogenetic tree of MAGs. The outer cycle represents kingdoms and the different colors of the background of clades represent phylum. The tree was constructed by PhyloPhlAn (v3.0.51) and visualized by iTOL (v5.6.2). c The number of species-level genome bins (SGBs) and the percentage of unknown SGB (uSGB) in each phylum. Two phyla are from Archaea and the others belong to Bacteria. The SGBs without existing reference genome (could not be annotated at the species level by GTDB-tk) were defined as unknown SGBs (uSGBs), while the SGBs having at least one MAG could be annotated at the species level as known SGBs (kSGBs). The color of each phylum was consistent with (b).
Fig. 5
Fig. 5. Bacterial species enriched in wild boars and commercial Duroc pigs, respectively.
Heatmap showed the parts of bacterial species enriched in wild boars and both two Duroc populations (Duroc-JY and Duroc-SH), respectively, at the significance threshold of Bonferroni-corrected P-value <0.01. All 180 significant bacteria species are listed in Supplementary Data 3.
Fig. 6
Fig. 6. The species-level genome bins (SGBs) containing metagenome-assembled genomes (MAGs) showing different directions of enrichment in wild boars and Duroc pigs.
a The phylogenetic tree showing all MAGs from seven SGBs belonging to bacteria. The different colors distinguish each SGB. In each of these seven SGBs, some MAGs were enriched in wild boars (blue bars), some MAGs in Duroc pigs (red bars), and the others did not show significant difference between wild boars and Duroc pigs (gray). b Heatmap showing the different enrichments of the 29 MAGs from seven SGBs described above between wild boars and Duroc pigs. c The phylogenetic tree showing all MAGs from SGB_600, which belongs to Methanomethylophilaceae in Archaea. Four MAGs in this SGB were enriched in wild boars (blue bars) and two MAGs enriched in Duroc pigs (red bars). d Boxplots showing the different abundances of the six MAGs in the SGB_600 between wild boars (n = 6) and Duroc pigs (Duroc-JY: n = 16, Duroc-SH: n = 20). *P < 0.05, **P < 0.01, ***P < 0.001, ****P < 0.0001, two-tailed Wilcoxon test was used Boxplots show median, 25th and 75th percentile, the whiskers indicate the minima and maxima, and the points laying outside the whiskers of boxplots represent the outliers.

Similar articles

Cited by

References

    1. Lunney JK. Advances in swine biomedical model genomics. Int. J. Biol. Sci. 2007;3:179–184. doi: 10.7150/ijbs.3.179. - DOI - PMC - PubMed
    1. Tremaroli V, Backhed F. Functional interactions between the gut microbiota and host metabolism. Nature. 2012;489:242–249. doi: 10.1038/nature11552. - DOI - PubMed
    1. Thaiss CA, Zmora N, Levy M, Elinav E. The microbiome and innate immunity. Nature. 2016;535:65–74. doi: 10.1038/nature18847. - DOI - PubMed
    1. Sylvia KE, Demas GE. A gut feeling: microbiome-brain-immune interactions modulate social and affective behaviors. Horm. Behav. 2018;99:41–49. doi: 10.1016/j.yhbeh.2018.02.001. - DOI - PMC - PubMed
    1. McCormack UM, et al. Porcine feed efficiency-associated intestinal microbiota and physiological traits: finding consistent cross-locational biomarkers for residual feed intake. mSystems. 2019;4:e00324–18. doi: 10.1128/mSystems.00324-18. - DOI - PMC - PubMed

Publication types

LinkOut - more resources