. 2021 Feb 17;12(1):1088.
doi: 10.1038/s41467-021-21246-9.

Inference and analysis of cell-cell communication using CellChat

Affiliations

Inference and analysis of cell-cell communication using CellChat

Suoqin Jin et al. Nat Commun. .

Abstract

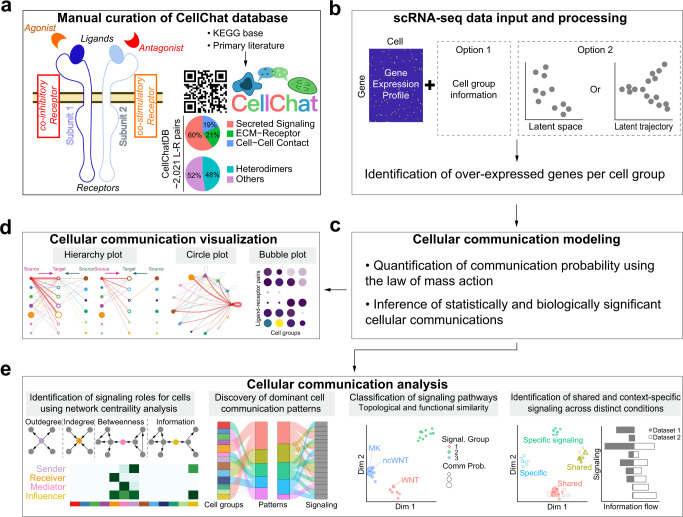
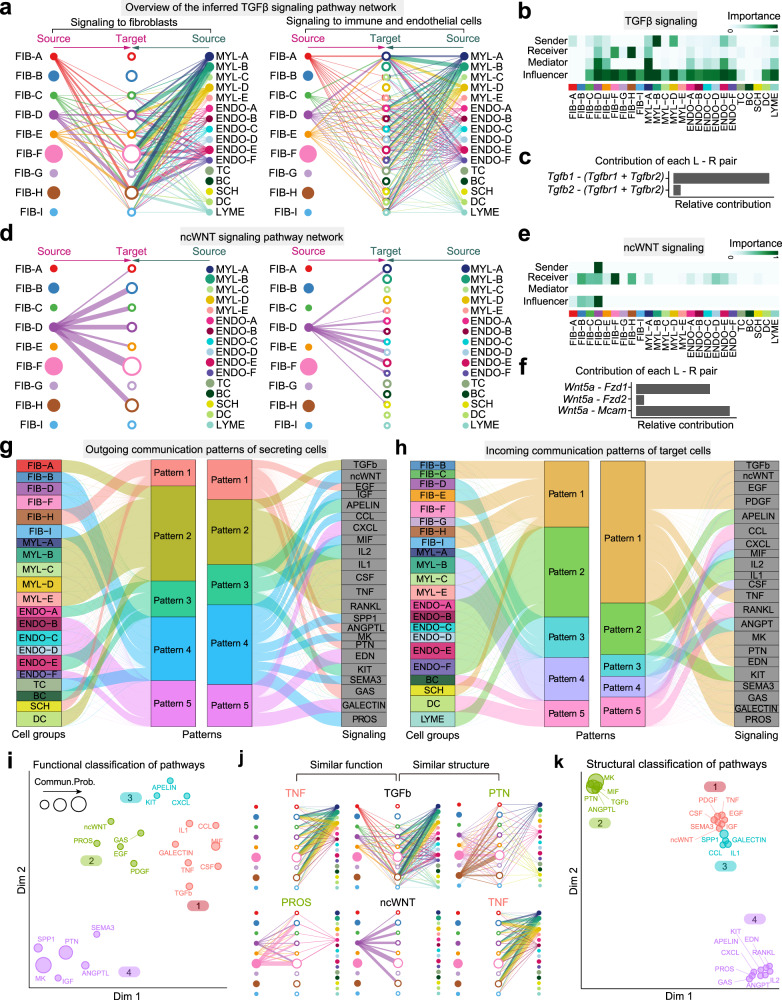
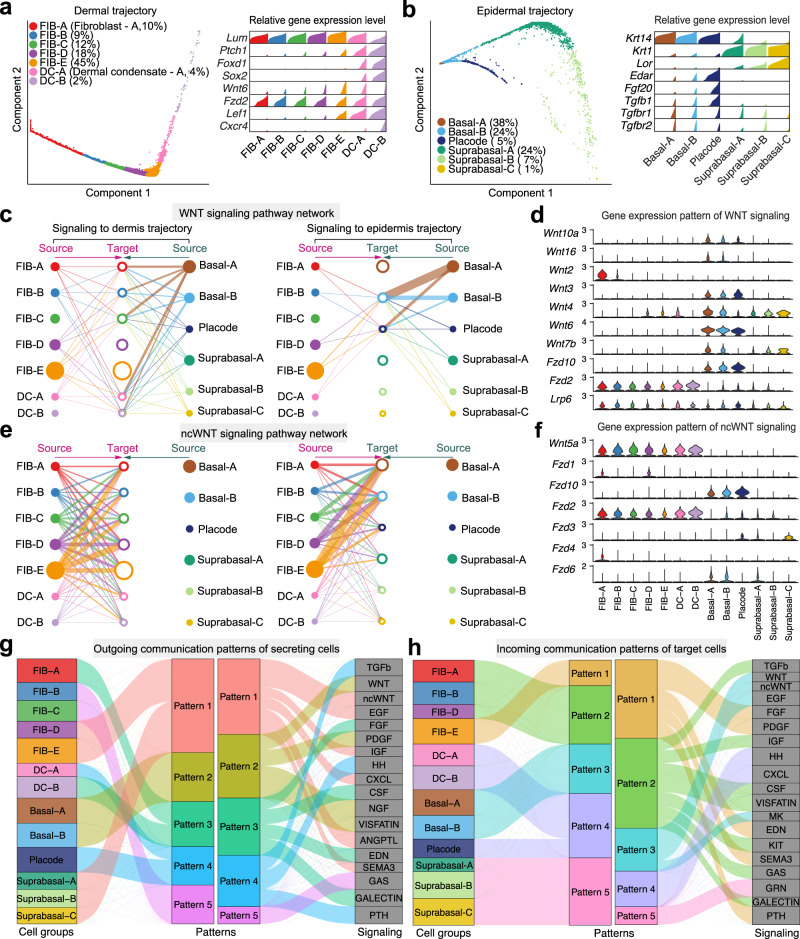
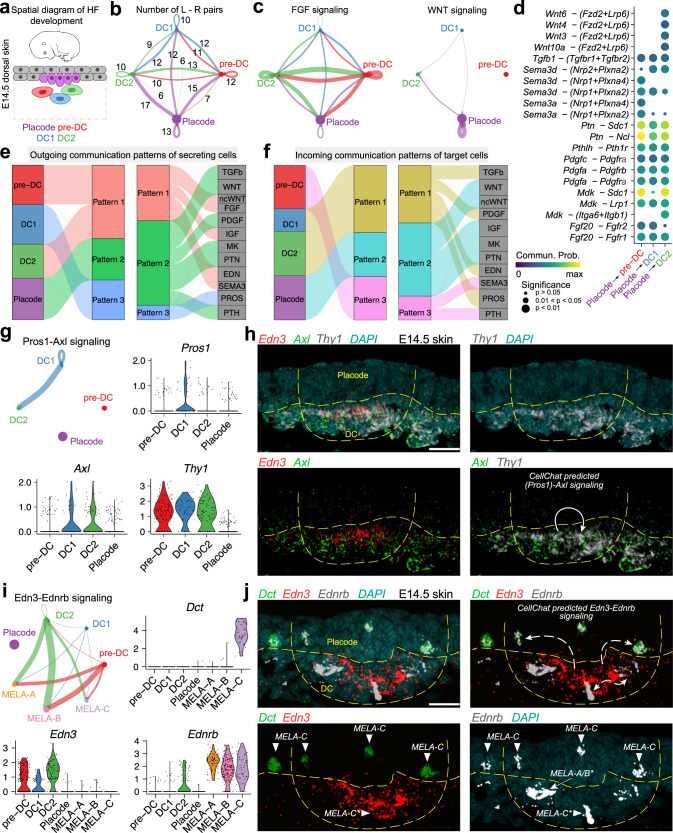
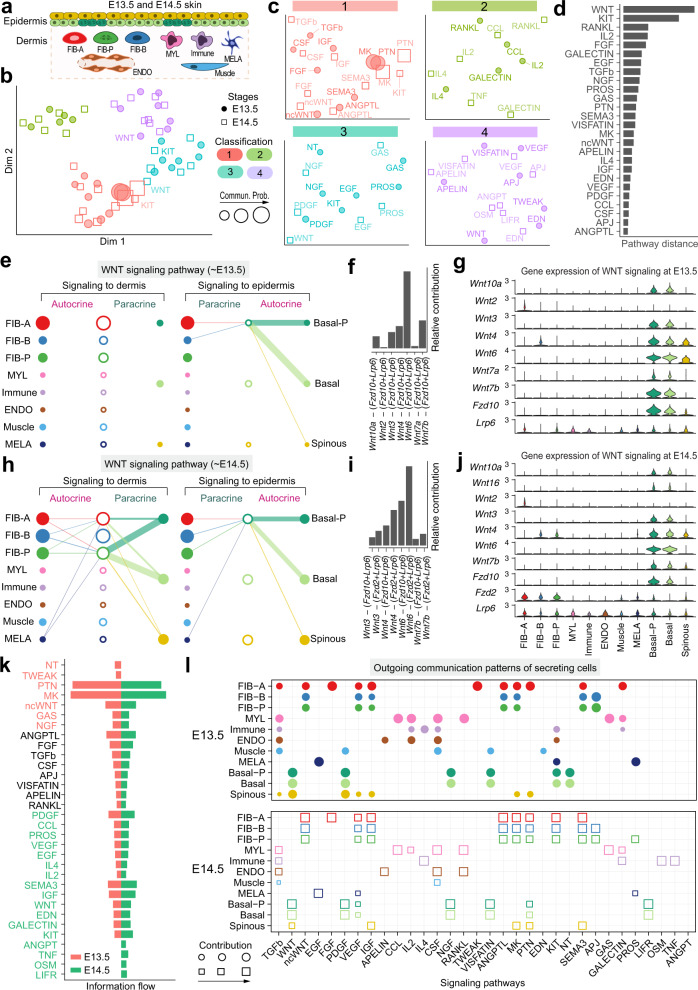
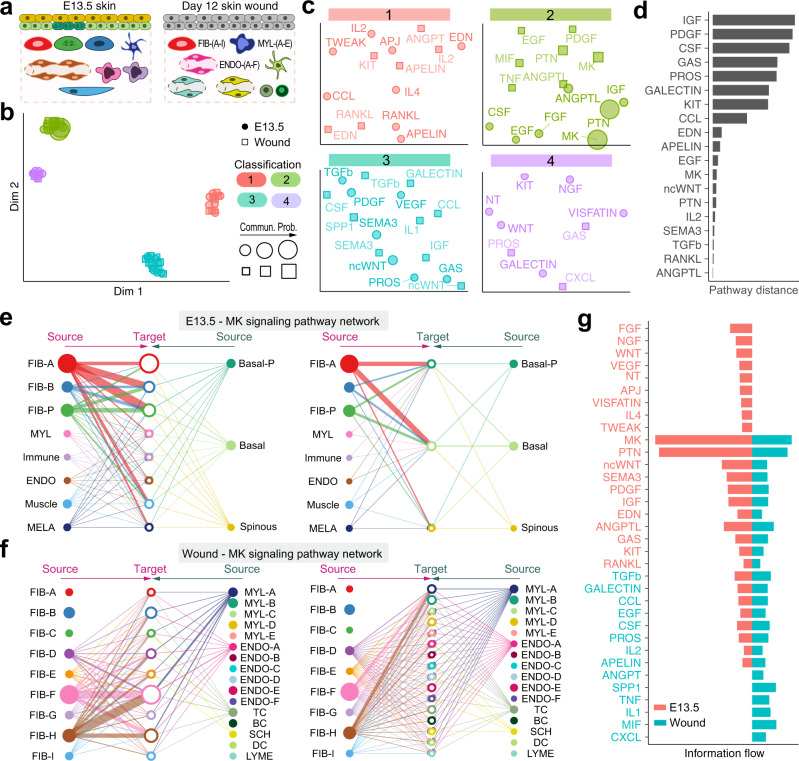
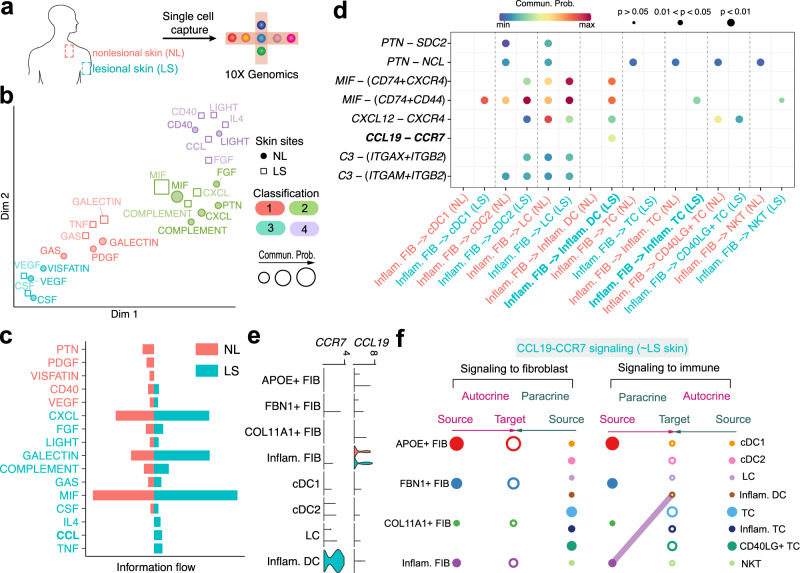
Understanding global communications among cells requires accurate representation of cell-cell signaling links and effective systems-level analyses of those links. We construct a database of interactions among ligands, receptors and their cofactors that accurately represent known heteromeric molecular complexes. We then develop CellChat, a tool that is able to quantitatively infer and analyze intercellular communication networks from single-cell RNA-sequencing (scRNA-seq) data. CellChat predicts major signaling inputs and outputs for cells and how those cells and signals coordinate for functions using network analysis and pattern recognition approaches. Through manifold learning and quantitative contrasts, CellChat classifies signaling pathways and delineates conserved and context-specific pathways across different datasets. Applying CellChat to mouse and human skin datasets shows its ability to extract complex signaling patterns. Our versatile and easy-to-use toolkit CellChat and a web-based Explorer ( http://www.cellchat.org/ ) will help discover novel intercellular communications and build cell-cell communication atlases in diverse tissues.


Conflict of interest statement

The authors declare no competing interests.

Figures

Fig. 1
Fig. 1. Overview of CellChat.
a Overview of the ligand-receptor interaction database. CellChatDB takes into account known composition of the ligand-receptor complexes, including complexes with multimeric ligands and receptors, as well as several cofactor types: soluble agonists, antagonists, co-stimulatory and co-inhibitory membrane-bound receptors. CellChatDB contains 2021 validated interactions, including 60% of secreting interactions. In addition, 48% of the interactions involve heteromeric molecular complexes. b CellChat either requires user assigned cell labels as input or automatically groups cells based on the low-dimensional data representation supplied as input. c CellChat models the communication probability and identifies significant communications. d CellChat offers several visualization outputs for different analytical tasks. Different colors in the hierarchy plot and circle plot represent different cell groups. Colors in the bubble plot are proportional to the communication probability, where dark and yellow colors correspond to the smallest and largest values. e CellChat quantitatively measures networks through approaches from graph theory, pattern recognition and manifold learning, to better facilitate the interpretation of intercellular communication networks and the identification of design principles. In addition to analyzing individual dataset, CellChat also delineates signaling changes across different contexts, such as different developmental stages and biological conditions.
Fig. 2
Fig. 2. CellChat analysis of the communications between skin cells during wound repair.
a Hierarchical plot shows the inferred intercellular communication network for TGFβ signaling. This plot consists of two parts: Left and right portions highlight the autocrine and paracrine signaling to fibroblast states and to other non-fibroblast skin cell states, respectively. Solid and open circles represent source and target, respectively. Circle sizes are proportional to the number of cells in each cell group and edge width represents the communication probability. Edge colors are consistent with the signaling source. FIB-A – I: nine fibroblast cell groups; MYL-A – E: five myeloid cell groups; ENDO-A – F: six endothelial cell groups; TC: T cell; BC: B cell; SCH: Schwan cell; DC: Dendritic cell, LYME: Lymphatic endothelial cell; (b) Heatmap shows the relative importance of each cell group based on the computed four network centrality measures of TGFβ signaling network. c Relative contribution of each ligand-receptor pair to the overall communication network of TGFβ signaling pathway, which is the ratio of the total communication probability of the inferred network of each ligand-receptor pair to that of TGFβ signaling pathway. d The inferred ncWNT signaling network. e Relative contribution of each ncWNT ligand-receptor pair. f The computed network centrality measures of ncWNT signaling. g The inferred outgoing communication patterns of secreting cells, which shows the correspondence between the inferred latent patterns and cell groups, as well as signaling pathways. The thickness of the flow indicates the contribution of the cell group or signaling pathway to each latent pattern. h The inferred incoming communication patterns of target cells. i Projecting signaling pathways onto a two-dimensional manifold according to their functional similarity. Each dot represents the communication network of one signaling pathway. Dot size is proportional to the overall communication probability. Different colors represent different groups of signaling pathways. j Two different similarity measures are used to quantify the similarity among the inferred networks. Examples showing the functional similarity with similar major sources/targets, and structural similarity with similar network topology. k Projecting signaling pathways onto a two-dimensional manifold according to their structural similarity.
Fig. 3
Fig. 3. Application of CellChat to continuous cell states along pseudotemporal trajectories during embryonic skin development.
a Left: Diffusion map projecting dermal skin cells onto the low-dimensional space and showing the dermal differentiation from fibroblasts to DC (dermal condensate) cells. Cells are grouped based on their location in this space. Right: Density plot showing the distribution of expression for selected marker genes in each cell group/population. b Diffusion map showing the epidermal trajectory and associated density plot for selected marker genes. c Hierarchical plot showing dermal and epidermal interactions via canonical WNT signaling. Left and right portions show the autocrine and paracrine signaling to dermal trajectory and epidermal trajectory, respectively. Circle sizes are proportional to the number of cells in each cell group and edge width represents the communication probability. d Violin plot showing the expression distribution of signaling genes involved in the inferred WNT signaling network. e The dermal and epidermal interactions via ncWNT signaling. f The expression distribution of signaling genes involved in the inferred ncWNT signaling network. g The outgoing signaling patterns of secreting cells visualized by alluvial plot, which shows the correspondence between the inferred latent patterns and cell groups, as well as signaling pathways. The thickness of the flow indicates the contribution of the cell group or signaling pathway to each latent pattern. The height of each pattern is proportional to the number of its associated cell groups or signaling pathways. Outgoing patterns reveal how the sender cells coordinate with each other, as well as how they coordinate with certain signaling pathways to drive communication. h Incoming signaling patterns of target cells. Incoming patterns show how the target cells coordinate with each other, as well as how they coordinate with certain signaling pathways to respond to incoming signaling.
Fig. 4
Fig. 4. Application of CellChat to communications between spatially colocalized cell populations.
a Spatial diagram of placode, pre-DC, DC1 and DC2 cells during hair follicle (HF) development at E14.5. DC: dermal condensate. b Number of significant ligand-receptor pairs between any pair of two cell populations. The edge width is proportional to the indicated number of ligand-receptor pairs. c The inferred FGF and WNT signaling networks. Circle sizes are proportional to the number of cells in each cell group and edge width represents the communication probability. d All the significant ligand-receptor pairs that contribute to the signaling sending from placode to three DC states. The dot color and size represent the calculated communication probability and p-values. p-values are computed from one-sided permutation test. e The outgoing communication patterns of secreting cells, which shows the correspondence between the inferred latent patterns and cell groups, as well as signaling pathways. f Incoming communication patterns of target cells. g The inferred Pros1-Axl signaling network, as well as the scRNA-seq expression distribution of the Pros1 ligand, the Axl receptor and cell migration marker Thy1. The edge width represents the communication probability. h RNAscope data (n  =4 independent experiments) showing spatial distribution of Edn3 (red), Axl (green), and Thy1 (white) transcripts in early-stage developing hair follicle from E14.5 embryonic mouse skin. Epithelial placode and dermal condensate (DC) are annotated and outlined with dashed lines. Solid white curved arrows in the bottom-right panel mark CellChat-predicted Pros1-Axl signaling within skin space. DAPI (teal) stains nuclei. Scale bar: 50 μm. i The inferred Edn3-Ednrb signaling network, as well as the scRNA-seq expression distribution of the melanocyte marker Dct, Edn3 ligand and its receptor Ednrb. DC: dermal condensate; MELA: melanocytes; (j) RNAscope data (n = 4 independent experiments) showing spatial distribution of Dct (green), Edn3 (red), and Ednrb (white) transcripts in early-stage developing hair follicle from E14.5 embryonic mouse skin. Arrowheads mark possible melanocyte populations. Solid white curved arrows in the top-right panel mark CellChat-predicted Edn3-Ednrb signaling within skin space. DAPI (teal) stains nuclei. Scale bar: 50 μm.
Fig. 5
Fig. 5. Comparison analysis of epidermal-dermal communications between different skin developmental stages.
a Schematic illustration of cellular composition of embryonic skin at E13.5 and E14.5. Different cell populations are color-coded to match colors in panel e and h. FIB-A: fibroblast type A; FIB-B: fibroblast type B; FIB-P: proliferative fibroblasts. MYL: myeloid cell; ENDO: endothelial cell; MELA: melanocytes; b Jointly projecting and clustering signaling pathways from E13.5 and E14.5 into a shared two-dimensional manifold according to their functional similarity. Circle and square symbols represent the signaling networks from E13.5 and E14.5 respectively. Each dot or square represents the communication network of one signaling pathway. Dot or square size is proportional to the total communication probability. Different colors represent different groups of signaling pathways. c Magnified view of each pathway group. d The overlapping signaling pathways between E13.5 and E14.5 were ranked based on their pairwise Euclidean distance in the shared two-dimensional manifold. e The inferred WNT signaling network at E13.5. Left and right portions show the autocrine and paracrine signaling to dermis and epidermis, respectively. Circle sizes are proportional to the number of cells in each cell group and edge width represents the communication probability. f Relative contribution of each ligand-receptor pair to the overall WNT signaling network at E13.5. g Expression distribution of WNT signaling genes at E13.5. h The inferred WNT signaling network at E14.5. i Relative contribution of each ligand-receptor pair at E14.5. j The expression distribution of WNT signaling genes at E14.5. k All significant signaling pathways were ranked based on their differences of overall information flow within the inferred networks between E13.5 and E14.5. The top signaling pathways colored red are more enriched in E13.5, the middle ones colored black are equally enriched in E13.5 and E14.5, and the bottom ones colored green are more enriched in E14.5. l The dot plot showing the comparison of outgoing signaling patterns of secreting cells between E13.5 and E14.5. The dot size is proportional to the contribution score computed from pattern recognition analysis. Higher contribution score implies the signaling pathway is more enriched in the corresponding cell group.
Fig. 6
Fig. 6. Joint identification of conserved and context-specific communication patterns between two skin states.
a Schematic illustration of cellular composition of skin during embryonic morphogenesis at E13.5 and during adult wound-induced repair at day 12. Different cell populations are color-coded to match colors in panel e and f, respectively. b Jointly projecting and clustering signaling pathways from E13.5 and wound onto shared two-dimensional manifold according to their structural similarity of the inferred networks. Circle and square symbols represent the signaling networks from E13.5 and wound respectively. Each circle or square represents the communication network of one signaling pathway. Circle or square size is proportional to the total communication probability of that signaling network. Different colors represent different groups of signaling pathways. c Magnified view of each pathway group. d The overlapping signaling pathways between E13.5 and wound were ranked based on their pairwise Euclidean distance in the shared two-dimensional manifold. Larger distance implies larger difference. e–f Hierarchical plot showing the inferred intercellular communication network of MK signaling pathway at E13.5 and wound, respectively. Circle sizes are proportional to the number of cells in each cell group and edge width represents the communication probability. g All the significant signaling pathways were ranked based on their differences of overall information flow within the inferred networks between E13.5 and wound. The overall information flow of a signaling network is calculated by summarizing all the communication probabilities in that network. The top signaling pathways colored by red are more enriched in E13.5, and the bottom ones colored by green were more enriched in the wound.
Fig. 7
Fig. 7. Identification of major signaling changes in diseased human skin.
a Schematic illustration of scRNA-seq on cells from nonlesional (NL, normal) and lesional (LS, diseased) human skin from patients with atopic dermatitis. b Jointly projecting and clustering signaling pathways from NL and LS skin onto shared two-dimensional manifold according to functional similarity of the inferred networks. Circle and square symbols represent the signaling networks from NL and LS respectively. Each dot or square represents the communication network of one signaling pathway. Dot or square size is proportional to the communication probability. Different colors represent different groups of signaling pathways. c Significant signaling pathways were ranked based on differences in the overall information flow within the inferred networks between NL and LS skin. The overall information flow of a signaling network is calculated by summarizing all communication probabilities in that network. The top signaling pathways colored red are enriched in NL skin, and these colored green were enriched in the LS skin. d Comparison of the significant ligand-receptor pairs between NL and LS skin, which contribute to the signaling from Inflam.FIB (i.e., inflammatory fibroblasts) to dendritic cells (DC) and T cells (TC) including cDC1, cDC2, LS, Inflam.DC, TC, Inflam.TC, CD40LG + TC, and NKT subpopulations. The highlighted CCL19-CCR7 signaling was previously validated using immunofluorescence staining. Dot color reflects communication probabilities and dot size represents computed p-values. Empty space means the communication probability is zero. p-values are computed from one-sided permutation test. e Expression distribution of ligand CCL19 and its receptor CCR7 in NL (red) and LS (green) skin. f Hierarchical plot showing inferred intercellular communication network of CCL19-CCR7 signaling in LS skin. Left and right portions show autocrine and paracrine signaling to fibroblast and immune cells, respectively. Circle sizes are proportional to the number of cells in each cell group and edge width represents the communication probability. Note that CellChat predicted no significant CCL19-CCR7 signaling in NL skin. FIB: fibroblasts; Inflam.FIB: inflammatory fibroblasts; cDC: conventional dendritic cell; Inflam.DC: inflammatory dendritic cell; LC: Langerhans cell; TC: T cell; Inflam.TC: inflammatory T cell; NKT: natural killer T cell.

References

    1. Stubbington, M. J. T., Rozenblatt-Rosen, O., Regev, A. & Teichmann, S. A. Single-cell transcriptomics to explore the immune system in health and disease. Science358, 58–63 (2017). 10.1126/science.aan6828 - DOI - PMC - PubMed
    1. Vento-Tormo, R. et al. Single-cell reconstruction of the early maternal-fetal interface in humans. Nature563, 347–353 (2018). 10.1038/s41586-018-0698-6 - DOI - PMC - PubMed
    1. Giladi, A. et al. Dissecting cellular crosstalk by sequencing physically interacting cells. Nat. Biotechnol.38, 629–637 (2020). 10.1038/s41587-020-0442-2 - DOI - PubMed
    1. Yuan, G. C. et al. Challenges and emerging directions in single-cell analysis. Genome Biol.18, 84 (2017). 10.1186/s13059-017-1218-y - DOI - PMC - PubMed
    1. Jin, S., MacLean, A. L., Peng, T. & Nie, Q. scEpath: energy landscape-based inference of transition probabilities and cellular trajectories from single-cell transcriptomic data. Bioinformatics34, 2077–2086 (2018). 10.1093/bioinformatics/bty058 - DOI - PMC - PubMed

Publication types