. 2021 Feb 17;12(1):1089.
doi: 10.1038/s41467-021-21244-x.

Dissection of intercellular communication using the transcriptome-based framework ICELLNET

Affiliations

Dissection of intercellular communication using the transcriptome-based framework ICELLNET

Floriane Noël et al. Nat Commun. .

Abstract

Cell-to-cell communication can be inferred from ligand-receptor expression in cell transcriptomic datasets. However, important challenges remain: global integration of cell-to-cell communication; biological interpretation; and application to individual cell population transcriptomic profiles. We develop ICELLNET, a transcriptomic-based framework integrating: 1) an original expert-curated database of ligand-receptor interactions accounting for multiple subunits expression; 2) quantification of communication scores; 3) the possibility to connect a cell population of interest with 31 reference human cell types; and 4) three visualization modes to facilitate biological interpretation. We apply ICELLNET to three datasets generated through RNA-seq, single-cell RNA-seq, and microarray. ICELLNET reveals autocrine IL-10 control of human dendritic cell communication with up to 12 cell types. Four of them (T cells, keratinocytes, neutrophils, pDC) are further tested and experimentally validated. In summary, ICELLNET is a global, versatile, biologically validated, and easy-to-use framework to dissect cell communication from individual or multiple cell-based transcriptomic profiles.


Conflict of interest statement

Irit Carmi-Levy is a full-time employee at Aummune. Maximilien Grandclaudon is currently employed by the pharmaceutical company Servier. The remaining authors declare no competing interests.

Figures

Fig. 1
Fig. 1. Structure of the ligand–receptor database.
a Extract of the ligand–receptor database. The database is structured as the following scheme: the 4 first columns correspond to gene symbol of each subunit of interacting ligand and receptor, the next two columns state the classification into families and/or subfamilies of molecules, and the last column gives the source for manual curation (PubMed ID). b Histogram displaying the number of interactions classified in each family of communication molecules included in the database (antigen binding, checkpoint, chemokine, cytokine, growth factor, notch signaling). c Histogram displaying the number of interactions classified in the different defined subfamilies of cytokines: interleukin 1 family, interleukin 17 family, receptor tyrosine kinase (RTK) family, transforming growth factor beta (TGF) family, tumor necrosis factor family (TNF), type 1 cytokine family, and type 2 cytokine family, and unclassified cytokines.
Fig. 2
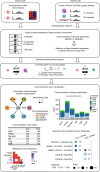
Fig. 2. ICELLNET pipeline to study intercellular communication from cell transcriptional profiles.
(top) Selection of transcriptomic profile of cell population of interest (central cell) and of other cells used to infer communication with among a public dataset (partner cells) (Supplementary Data 2). (middle) Genes corresponding to ligands/receptors included in the database are selected, scaled by maximum of gene expression for each gene, and used to compute a communication score between two cell types. (bottom) Graphical layers used to dissect intercellular communication scores between the central cell (CC) and partner cells (Macroph: macrophage, Fblast: fibroblast, Epith: epithelial cell, B cell, Treg, NK: natural killer cell): global communication network intensity assessment, contribution of each family or subfamily of molecules to the communication scores, statistical difference assessment of the communication scores from the same central cell to the different partner cell types, and plots of specific interactions most contributing to communication scores. Some schematic art pieces were used and modified from Servier Medical Art, licensed under a Creative Common Attribution 3.0 Generic License. http://smart.servier.com/.
Fig. 3
Fig. 3. Dissection of intercellular communication between Triple-Negative breast cancer infiltrating CAF subsets and the tumor microenvironment.
a Workflow of the analysis. b Connectivity maps describing outward communication from cancer associated fibroblasts CAF-S1 (n = 6 biologically independent samples) and CAF-S4 (n = 3 biologically independent samples) subsets to primary cells (Supplementary Data 2). The CAF subsets are considered as central cells and colored in gray. Primary cells are considered as partner cells (DC1 and DC2: conventional dendritic cell 1 and 2, pDC: plasmacytoid dendritic cell, Macroph: macrophage, Mono: monocyte, Endoth: endothelial cell, Fblast_B: breast fibroblast, Epith: epithelial cell, B cell, Treg, CD8 T cell, CD4 T cell, Neutrop: neutrophil, and NK: natural killer cell) and are colored depending on the cell compartment (green: stroma, orange: innate, blue: adaptive, pink: epithelium). The width of the edges corresponds to a global score combining the intensity of all the individual ligand/receptor interactions. A scale ranging from 1 to 10, corresponding to minimum and maximum communication scores, is shown in the legend. A selection of normalized scores is written directly on the network. c Barplot of communication score with contribution by families of communication molecules between CAF subsets (n = 6 biologically independent samples for CAF-S1, n = 3 biologically independent samples for CAF-S4) and a selection of partner cells. Significant differences are shown on the graph (two-sided wilcoxon test, and p values are adjusted with Benjamin–Hochberg method, *p-value ≤ 0.1). d Balloon plot of individual interaction scores between CAF subsets and Tregs. Only interactions with a score contribution above 10 to the score are displayed for clarity purpose. Two biologically interesting communication channels were highlighted by red boxes. e Barplot of communication score with contribution restricted to cytokines subfamilies between CAF subsets (n = 6 biologically independent samples for CAF-S1, n = 3 biologically independent samples for CAF-S4) and a selection of partner cells. Some schematic art pieces were used and modified from Servier Medical Art, licensed under a Creative Common Attribution 3.0 Generic License. http://smart.servier.com/ (a).
Fig. 4
Fig. 4. Evaluation of cell-to-cell communication potential between dendritic cells and T-cell subpopulations in lupus nephritis single cell data.
a Uniform Manifold Approximation and Projection (UMAP) visualization of the lupus nephritis dataset. 22 clusters were previously identified by the authors and their annotations are displayed on the right. Cell identity of each cluster can be found in the original article. b ICELLNET framework applied on specific cluster to assess DC-T intercellular communication. Average expression profiles were computed from the single-cell data matrix counts for each cluster to then compute intercellular communication score. Barplots are displaying the contribution of the different communication molecules families to the communication scores. c Balloon plot representing specific individual interaction scores that differ from at least 10 between the two conditions (cutoff chosen for clarity purpose) for interaction belonging to either chemokine, checkpoint, or growth factor families of molecules. d Assessment of communication score variability when subsampling DC or T cluster. Cells were randomly selected for CT0a and CT3b cluster (left) or CM3 cluster (right) (number of cells selected according to their respective cluster size). Communication scores were computed with the other complete cluster (CM3 for left, T cell cluster for right). Standard deviations of the communication scores are displayed on the graphs (n = 20 random selection of cells). Some schematic art pieces were used and modified from Servier Medical Art, licensed under a Creative Common Attribution 3.0 Generic License. http://smart.servier.com/ (b).
Fig. 5
Fig. 5. IL-10R blocking activates a cell-to-cell communication module in LPS-stimulated DCs.
a Depicted are the four experimental conditions for which transcriptomics was generated (n = 6 biologically independent samples). b Connectivity maps describing outward communication from DCs to putative target cells in the conditions: Medium (M), LPS (L), LPS + aTNFR and LPS + aIL-10R. Twelve primary cell types are considered as partner cells (DC: conventional dendritic cell, Macroph: macrophage, Mono: monocyte, Ostblast: osteoblast, Endoth: endothelial cell, Fblast: fibroblast, Kerat: keratinocyte, Epith: epithelial cell, B cell, T cell, Neutrop: neutrophil and NK: natural killer cell) and are colored depending on the cell compartment (green: stroma, orange: innate, blue: adaptive, pink: epithelium). The width of the edges corresponds to a global score combining the intensity of all the individual ligand/receptor interactions, normalized to the medium condition. A scale ranging from 1 to 10, corresponding to minimum and maximum communication scores, is shown in the legend. c Gene corresponding to ligands (black) and receptors (white) counted in each loop signature (from n = 6 biologically independent samples for each conditions) and plotted according to regulation directionality: upregulated (Up) or downregulated (Down). Genes with separability score ≥4 were included in each condition’s signature. d Balloon plot representing a selection of individual interaction scores. e Protein levels of IL-6 (n = 10 biologically independent samples, except for Medium condition where n = 5), OSM (n = 4 biologically independent samples), IL-23 (n = 8 biologically independent samples) and IL-12p70 (n = 16 biologically independent samples, except for Medium condition where n = 8) demonstrating increased secretion in LPS + aIL-10R DC supernatant. Data are presented as mean values ± SEM. Some schematic art pieces were used and modified from Servier Medical Art, licensed under a Creative Common Attribution 3.0 Generic License. http://smart.servier.com/ (a).
Fig. 6
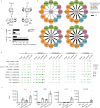
Fig. 6. IL-10 but not TNF loop dictates T helper polarization by LPS-DC.
a, b Supernatants of CD4+ naive (a) and memory (b) T cells, co-cultured with the indicated DCs, were analyzed for the presence of T helper cytokines by CBA: IL-2, IL-3, IL-4, IL-9, IL-10, IL-17A, IL-17F, and IFN-γ (a) and all the above in addition to IL-5, IL-13 TNF, and GM-CSF (b). Results are shown in a two-dimensional principal component analysis (PCA). Dots represent mean of 9 (a) or 6 (b) independent co-culture experiments. c Histogram representation of 4 cytokines present in the supernatant of naive (white bars, left axis) or memory (black bars, right axis) supernatant (n = 16 biologically independent samples for naïve CD4 T cells except Medium condition where n = 8 biologically independent samples, n = 6 for memory CD4 T cells). Data are presented as mean values ± SEM. d CD4+ naive T cells were analyzed for IL-17A, IL-9, and IFNg production using intracellular staining FACS. Percentage of positive producers is given. Shown is one representative out of 3 independent experiments. Some schematic art pieces were used and modified from Servier Medical Art, licensed under a Creative Common Attribution 3.0 Generic License. http://smart.servier.com/ (a).
Fig. 7
Fig. 7. IL-10 loop controls DC communication with keratinocytes, neutrophils, and pDCs.
a RT-PCR analysis of the expression of TNF and IL-1b mRNA in HaCat cells incubated with medium, LPS or with supernatant (diluted 1:10) of the indicated DCs for 4 h. Blocking antibodies for the cytokines IL-19, IL-36g, OSM and TNF were added to LPS + aIL-10R-DC supernatant for 1-h incubation before culturing with HaCat cells. Data are represented as mean values ± SEM, n = 4 or n = 8 biologically independent samples depending on the conditions, *p < 0.05 (two-sided paired t-test without correction). b, c Expression of maturation markers CD86, HLA-DR, and ICOSL (b) or CD11b and CD62L (c) analyzed by flow cytometry with surface staining on pDCs (n = 18 or n = 6 biologically independent samples depending on the conditions) cultured with supernatant (diluted 1:10) of the indicated DC for 24 h (b) and neutrophils (n = 9 or n = 6 biologically independent samples depending on the conditions) (c) cultured with supernatant (diluted 1:100) of the indicated DC for 1 h. Blocking antibodies for the cytokines GCSF, GM-CSF, TNF, and IL-12 (for pDC) or IL-6 (neutrophils) were added to LPS + aIL-10R-DC supernatant for 1 h incubation before culture. Each biological replicate comprised independent DC donor paired to independent pDCs/neutrophils donor. Data are represented as mean values ± SEM, *p < 0.05; **p < 0.01; ***p < 0.001 (two-sided paired t-test without correction). d For each target cell, we reduced the different activation markers to a single parameter normalized between 0 (Ø) and 1 (max) in the rectangles. The value 0 corresponds to the activation level induced by supernatants from untreated DC, while 1 corresponds to the maximum activation level from all the observed conditions. These experimentally validated activation scores were in qualitative agreement with the ICELLNET communication scores between DC and the target cells, represented by the width of the edges. Some schematic art pieces were used and modified from Servier Medical Art, licensed under a Creative Common Attribution 3.0 Generic License. http://smart.servier.com/ (a, b, c).

References

    1. Iikuni N, Kwan Lam Q, Lu L, Matarese G, Cava A. Leptin and Inflammation. CIR. 2008;4:70–79. doi: 10.2174/157339508784325046. - DOI - PMC - PubMed
    1. Ghezzi P, Brines M. Erythropoietin as an antiapoptotic, tissue-protective cytokine. Cell Death Differ. 2004;11:S37–S44. doi: 10.1038/sj.cdd.4401450. - DOI - PubMed
    1. O’Shea, J., Gadina, M. & Siegel, R. M. in Clinical Immunology, Principles and Practice 5th edn (eds Rich, R. R., Fleisher, T. A., Shearer, W. T., Schroeder, H. W. Jr., Frew, A. J. and Weyand, C. M.) Ch. 9 (Elsevier, 2019).
    1. Vento-Tormo R, et al. Single-cell reconstruction of the early maternal–fetal interface in humans. Nature. 2018;563:347–353. doi: 10.1038/s41586-018-0698-6. - DOI - PMC - PubMed
    1. Wang, Y. et al. iTALK: an R Package to characterize and illustrate intercellular communication. 10.1101/507871 (2019).

Publication types