. 2021 Feb 17;12(1):1076.
doi: 10.1038/s41467-021-21394-y.

Determinants of genome-wide distribution and evolution of uORFs in eukaryotes

Affiliations

Determinants of genome-wide distribution and evolution of uORFs in eukaryotes

Hong Zhang et al. Nat Commun. .

Erratum in

Abstract

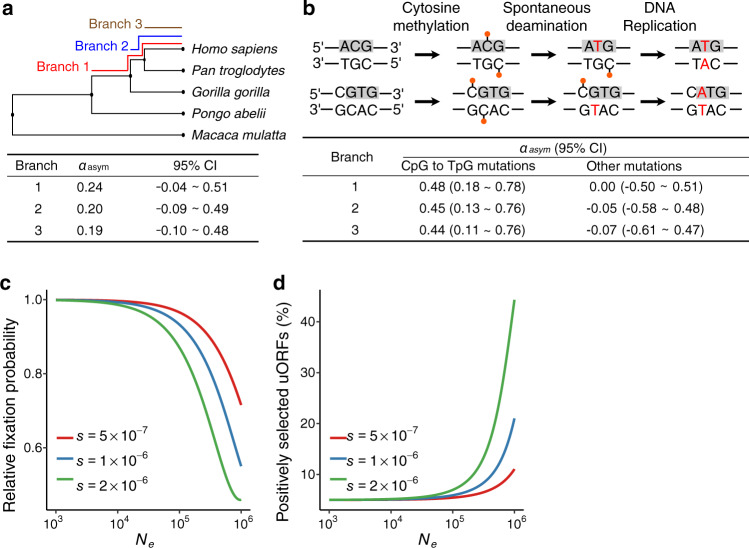
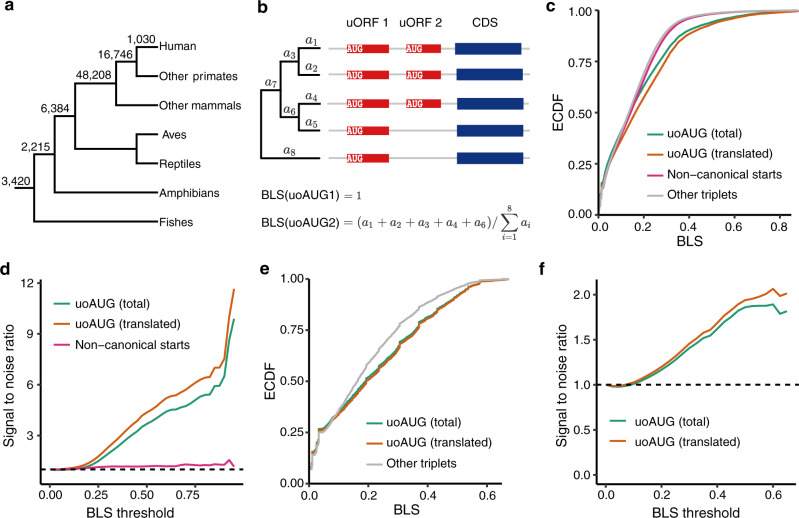
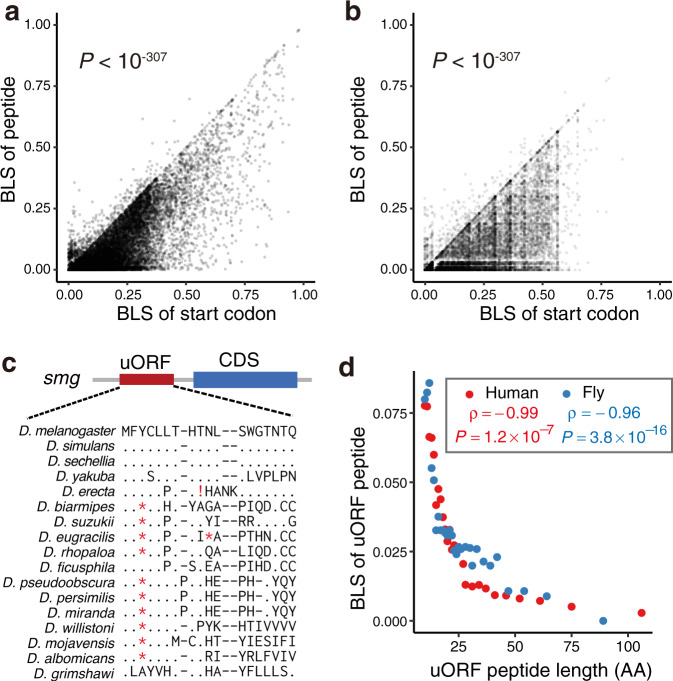
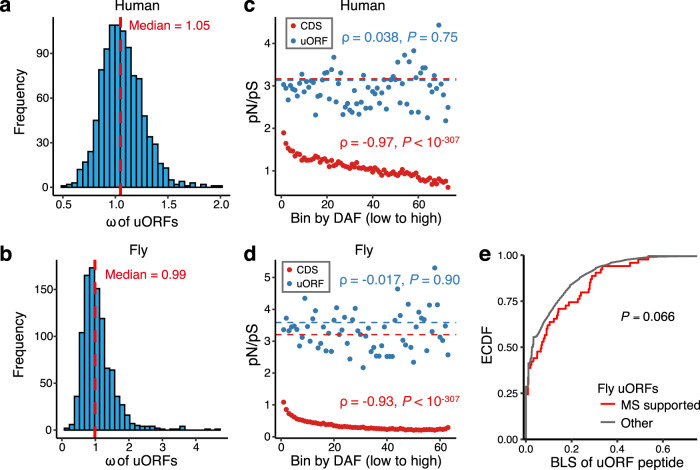
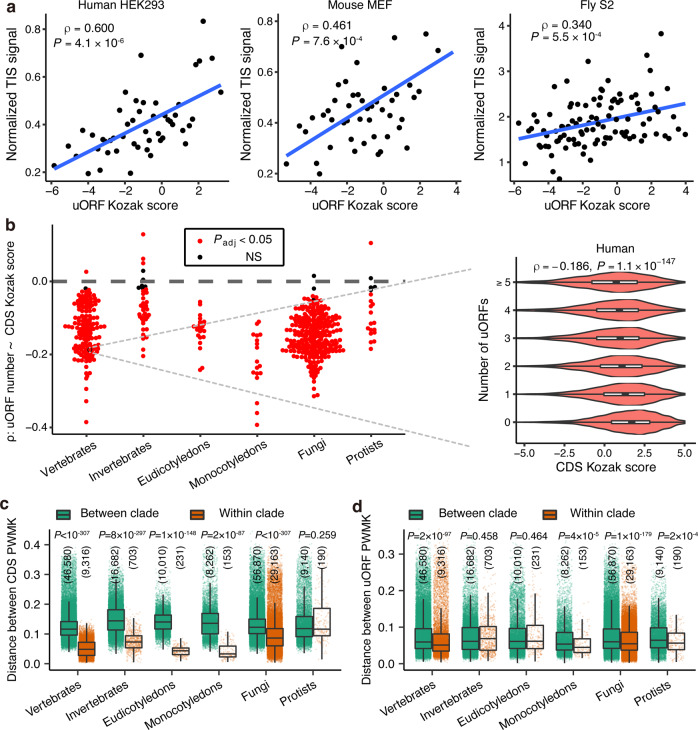
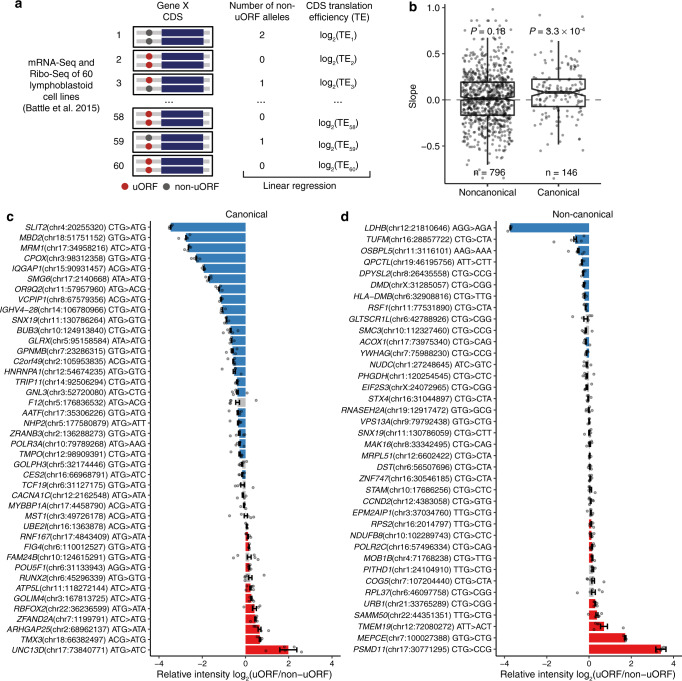
Upstream open reading frames (uORFs) play widespread regulatory functions in modulating mRNA translation in eukaryotes, but the principles underlying the genomic distribution and evolution of uORFs remain poorly understood. Here, we analyze ~17 million putative canonical uORFs in 478 eukaryotic species that span most of the extant taxa of eukaryotes. We demonstrate how positive and purifying selection, coupled with differences in effective population size (Ne), has shaped the contents of uORFs in eukaryotes. Besides, gene expression level is important in influencing uORF occurrences across genes in a species. Our analyses suggest that most uORFs might play regulatory roles rather than encode functional peptides. We also show that the Kozak sequence context of uORFs has evolved across eukaryotic clades, and that noncanonical uORFs tend to have weaker suppressive effects than canonical uORFs in translation regulation. This study provides insights into the driving forces underlying uORF evolution in eukaryotes.


Conflict of interest statement

The authors declare no competing interests.

Figures

Fig. 1
Fig. 1. Variability of upstream AUG (uAUG) prevalence among eukaryotes and evolutionary driving forces.
a Overview of the 216 eukaryotes analyzed in this study. The left panel is the cladogram of the 216 eukaryotes. The number of species in each clade is shown in brackets. The middle panel shows the total number of protein-coding genes in 35 representative species. Genes with an annotated 5′ untranslated regions (5′ UTR+) are colored by clade, and those without 5′ UTR annotation (5′ UTR-) are shown in gray. The unavailability of annotated 5′ UTRs for many genes in less-studied organisms is presumably caused by the lack of accurate annotations. The right panel shows the ratio of the observed number of uAUGs to the expected number of uAUGs (O/E ratio) in the 35 species. The error bars indicate the 95% confidence interval of the O/E ratio. b O/E ratios of uAUGs in sex chromosome (X or Z) genes (Sex, blue) and autosomal genes (Auto, red) in humans, mice, opossum, flies, and chickens. n = 1000 permutation replicates for each category of genes in each species. Center point, median; error bars, 95% confidence intervals. P values were obtained by two-sided Wilcoxon signed-rank tests, and no correction for multiple testing was made. c Relationship between the effective population size (Ne) and the O/E ratio of uORFs among 14 animals. The blue line indicates the local polynomial regression fit of the O/E ratio against Ne, and the gray band indicates the standard error of the fit. Spearman’s correlation (ρ) between Ne and the O/E ratio and the two-sided P value are shown in the plot. d Relationship between the genome-wide median number of nonsynonymous changes per nonsynonymous site over the number of synonymous changes per synonymous site (ω) of coding sequences (CDSs) and the O/E ratio of uORFs among 56 animals. The blue line indicates the local polynomial regression fit and the gray band indicates the standard error of the fit. Both Spearman’s correlation and the significance of the two-sided phylogenetic independent contrast (PIC) between ω and the O/E ratio (PPIC) are shown. Source data are provided as a Source Data file.
Fig. 2
Fig. 2. Selection and effective population size (Ne) shape the upstream open reading frame (uORF) prevalence in eukaryotes.
a Asymptotic McDonald–Kreitman (AsymptoticMK) test of newly fixed uORFs in the lineages leading to extant humans (branches 1, 2, and 3). The left panel shows the phylogeny of the five primates related to the analysis. Rhesus macaque (Macaca mulatta) was used as the outgroup. The fraction of newly fixed uORFs driven by positive selection (αasym) is shown in the bottom panel. b The result of AsymptoticMK tests for newly fixed uORFs derived from CpG to TpG mutations and the other mutations on each branch. The two approaches by which CpG to TpG mutations create new ATGs in 5′ UTRs are illustrated above. Relative fixation probability of newly originated uORFs (c) and the fraction of uORFs driven by positive selection (d) as a function of the Ne of a simulated population. In the simulation, we assumed that beneficial and deleterious mutations presented the same absolute selective coefficient (s) and that there was no dominance (h = 0.5). The fractions of newly originated uORFs that are deleterious, neutral, or beneficial are 75%, 20%, and 5%, respectively. Source data are provided as a Source Data file.
Fig. 3
Fig. 3. Selective constraints on the upstream open reading frame (uORF) start codons.
a Age distribution of start codons (uoAUGs) of human uORFs. The number of origination events assigned to each branch was inferred with the maximum parsimony method. b The scheme showing how the branch length scores (BLSs) for the start codons of two uORFs are calculated based on their presence or absence across species. In this hypothetical example, the length of each branch is denoted with ai (i = 1–8). c Empirical cumulative distribution function (ECDF) of the BLSs for uoAUGs, noncanonical start codons, and the other triplets in human 5′ untranslated regions (UTRs). The BLS of uoAUGs (total or translated) or noncanonical start codons was significantly larger than that of the other triplets (P < 8 × 10−58, two-sided Wilcoxon rank-sum tests). d Signal-to-noise ratios of the BLSs of uoAUGs and noncanonical start codons relative to other triplets in humans based on different thresholds of minimum BLS. The dashed line delineates a signal-to-noise ratio of 1 expected under neutral evolution. e ECDF of BLS for uoAUGs and the other triplets in fly 5′ UTRs. The BLS of uoAUGs (total or translated) was significantly larger than that of the other triplets (P < 2 × 10−88, two-sided Wilcoxon rank-sum tests). f The signal-to-noise ratio of BLSs for uoAUGs relative to other triplets in flies based on different minimum BLS thresholds. Source data are provided as a Source Data file.
Fig. 4
Fig. 4. Conservation of upstream open reading frame (uORF)-encoded peptides.
The branch length score (BLS) of the coding region of a uORF is significantly lower than that of the start codon of that uORF in humans (a) and flies (b). c Example of a typical uORF with a conserved start codon in the fly smg gene. The orthologous peptide sequences in distant lineages exhibit many nonsynonymous substitutions and are frequently disrupted by stop codons (*) or frameshifts (!). d Relationship between the length and the BLS of uORF peptides in humans and flies. The uORFs were grouped into custom bins of increasing peptide length. The median peptide length and BLS value of each bin are displayed and were used to calculate Spearman’s correlations (ρ) with two-sided P values. “AA” refers to amino acid. Source data are provided as a Source Data file.
Fig. 5
Fig. 5. Selective constraints on coding regions of upstream open reading frames (uORFs).
a Distribution of the number of nonsynonymous changes per nonsynonymous site over the number of synonymous changes per synonymous site (ω) of uORFs between humans and rhesus macaques. Human uORFs were equally divided into 1000 bins based on the start codon of uORFs with an increasing Kozak score. For each bin, the alignments of uORF sequences between human and rhesus macaque were concatenated to calculate the ω value. b Distribution of the ω values of uORFs between D. melanogaster and D. simulans. The procedure for ω calculation was similar to that described in a. c The ratio of the nonsynonymous to synonymous SNP numbers (pN/pS) in coding sequences (CDSs, red) and uORFs (blue) in bins with an increasing derived allele frequency (DAF). Spearman’s correlation (ρ) between the pN/pS ratio and the median DAF of each bin of uORFs and CDSs is displayed in the plot with two-sided P values. d Same as c but for fly uORFs. e The empirical cumulative distribution function of (ECDF) of peptide branch length score (BLS) for mass spectrometry (MS)-supported uORFs and the remaining uORFs in flies. uORFs with <10 amino acids were excluded. The one-sided t-test was performed to test differences in BLS. Source data are provided as a Source Data file.
Fig. 6
Fig. 6. The Kozak sequence contextual characteristics that influence upstream open reading frame (uORF) translation.
a Relationship between the Kozak scores and normalized translational initiation signals of uORF start codons (uoAUGs) in human HEK293 cells, mouse MEF cells, and fly S2 cells. In each sample, we ranked uORFs based on increasing Kozak scores and divided them into 50 bins (100 bins for S2 cells) with equal numbers of uoAUGs. The median Kozak score and normalized TIS signal for each bin were used to calculate Spearman’s correlations (ρ) and two-sided P values. The linear fit was indicated with a blue line. b The distribution of Spearman’s correlation coefficients between the coding sequence (CDS) Kozak scores and the number of uORFs for that gene in eukaryotes in different taxa. In the left panel, each dot represents one species. The right panel shows that in humans, genes that have multiple uORFs tend to have weaker Kozak sequence context around the start codon of CDSs. Padj, two-sided P value after correction for multiple testing; NS, not significant. Box plots showing the distribution of the Euclidian distance of the position weight matrix of Kozak sequences (PWMK) for cAUGs (c) and uoAUGs (d) between species within the same taxa (brown) or species in different taxa (green). Differences in distances were compared with two-sided Wilcoxon rank-sum tests. Exact P values (no correction for multiple testing were made) and the number of pairwise distances in each group were shown in the plot. Center line, median; box limits, upper and lower quartiles; whiskers, 1.5 times the interquartile range. Source data are provided as a Source Data file.
Fig. 7
Fig. 7. Experimental verification of canonical and noncanonical upstream open reading frames (uORFs).
a The scheme showing how to determine the effect of uORF variations in the human population on the translation efficiency (TE) of downstream coding sequences (CDSs). With the mRNA-Seq and Ribo-Seq data of 60 human lymphoblastoid cell lines, we calculated the translation efficiency of CDS for each gene and obtained the genotypes of each subject from the 1000Genomes Project. For each uORF variant, we performed a linear regression between the number of non-uORF alleles and the log2(TE) of downstream CDS across the 60 cell lines. b The distribution of slopes in the linear regression between genotypes (the number of non-uORF alleles) and CDS translational efficiency among 60 cell lines. Center line, median; box limits, upper and lower quartiles; whiskers, 1.5 times the interquartile range. The number of variants in each category was shown in the plot. Exact P values of two-sided Wilcoxon signed-rank tests were shown in the plot. The ratio of relative luciferase intensity (log2) between the reporters with the uORF allele or the non-uORF allele for each variant of canonical uORFs (c) or noncanonical uORFs (d). The bars are displayed in blue or red when the relative intensity of uORF-allele is significantly lower or higher than that of the non-uORF allele (one-sided Wilcoxon rank-sum tests, Padj < 0.1), respectively. Measures of center, mean; error bars, standard errors. n = 4 or 5 independent biological replicates for each variant (details are presented in source data). Source data are provided as a Source Data file.

Similar articles

Cited by

References

    1. Jackson RJ, Hellen CU, Pestova TV. The mechanism of eukaryotic translation initiation and principles of its regulation. Nat. Rev. Mol. Cell Biol. 2010;11:113–127. - PMC - PubMed
    1. Sonenberg N, Hinnebusch AG. Regulation of translation initiation in eukaryotes: mechanisms and biological targets. Cell. 2009;136:731–745. - PMC - PubMed
    1. Ruiz-Orera J, Alba MM. Translation of small open reading frames: roles in regulation and evolutionary innovation. Trends Genet. 2018;35:186–198. - PubMed
    1. Zhang H, Wang Y, Lu J. Function and evolution of Upstream ORFs in eukaryotes. Trends Biochem. Sci. 2019;44:782–794. - PubMed
    1. Hinnebusch AG, Ivanov IP, Sonenberg N. Translational control by 5’-untranslated regions of eukaryotic mRNAs. Science. 2016;352:1413–1416. - PMC - PubMed

Publication types

LinkOut - more resources