. 2021 Feb 17;12(1):1075.
doi: 10.1038/s41467-021-21375-1.

Mapping ticks and tick-borne pathogens in China

Affiliations

Mapping ticks and tick-borne pathogens in China

Guo-Ping Zhao et al. Nat Commun. .

Abstract

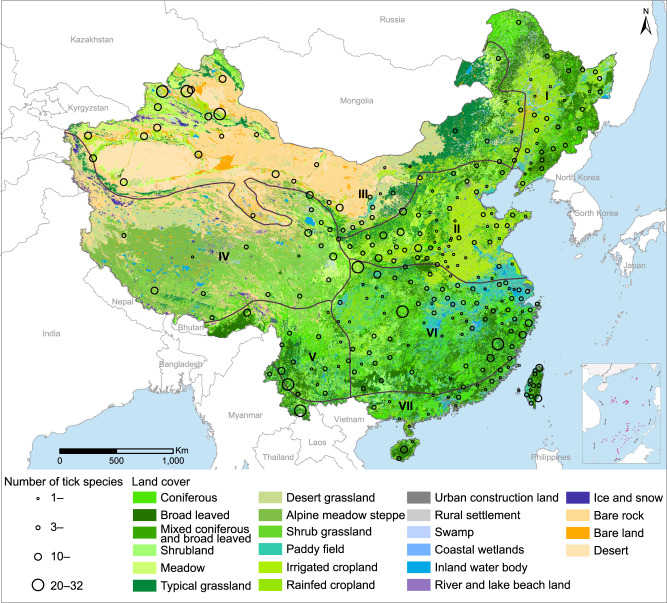
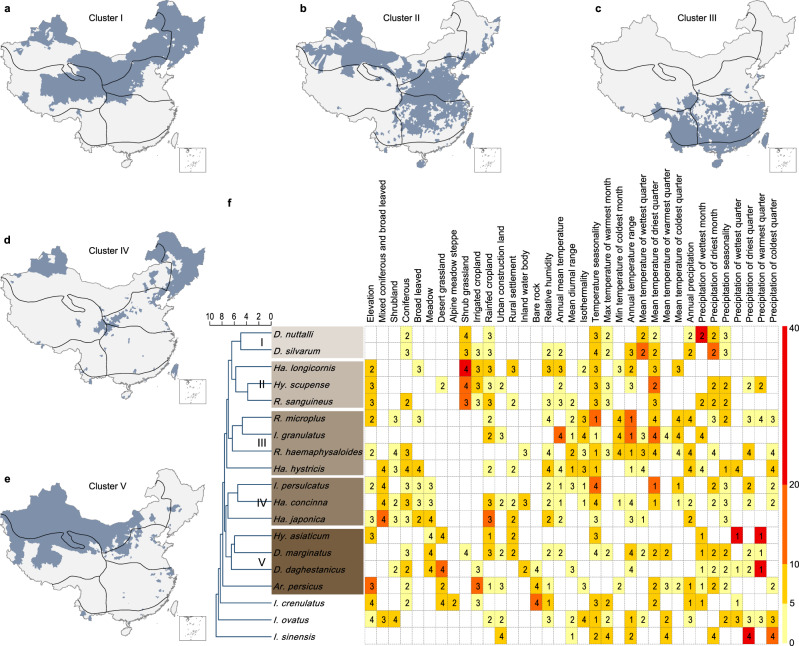
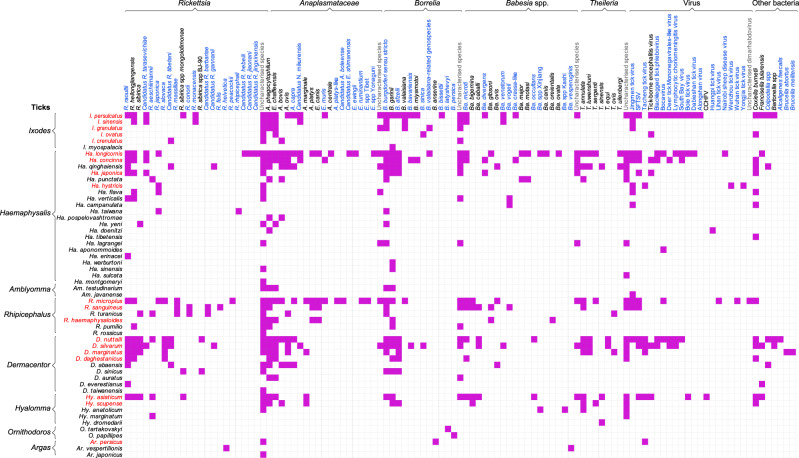
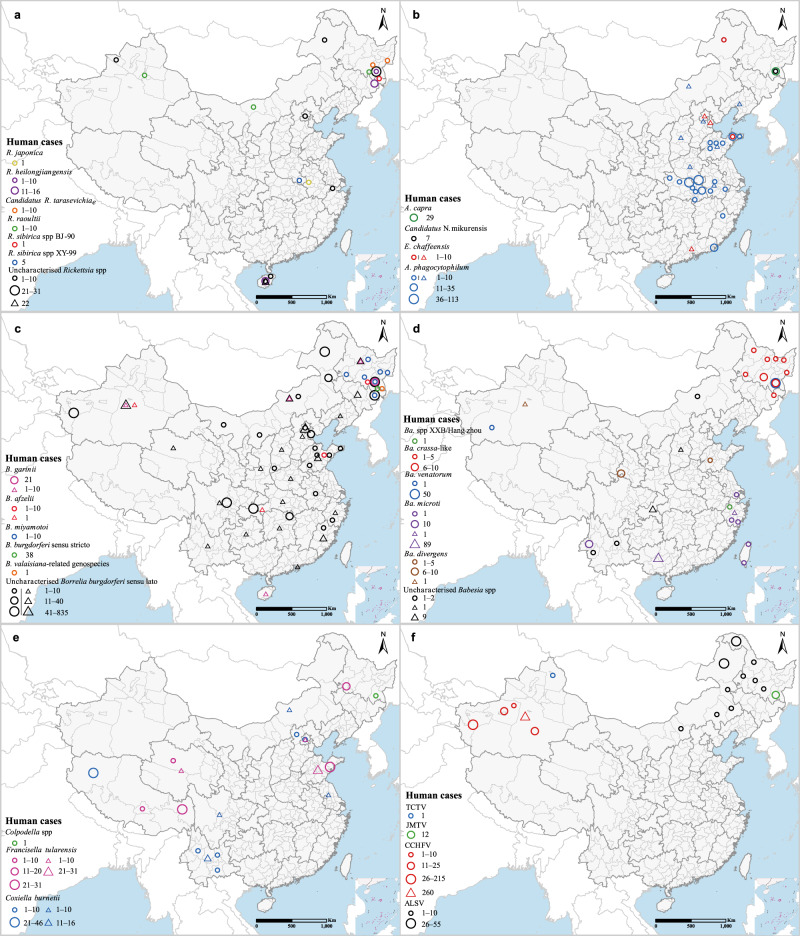
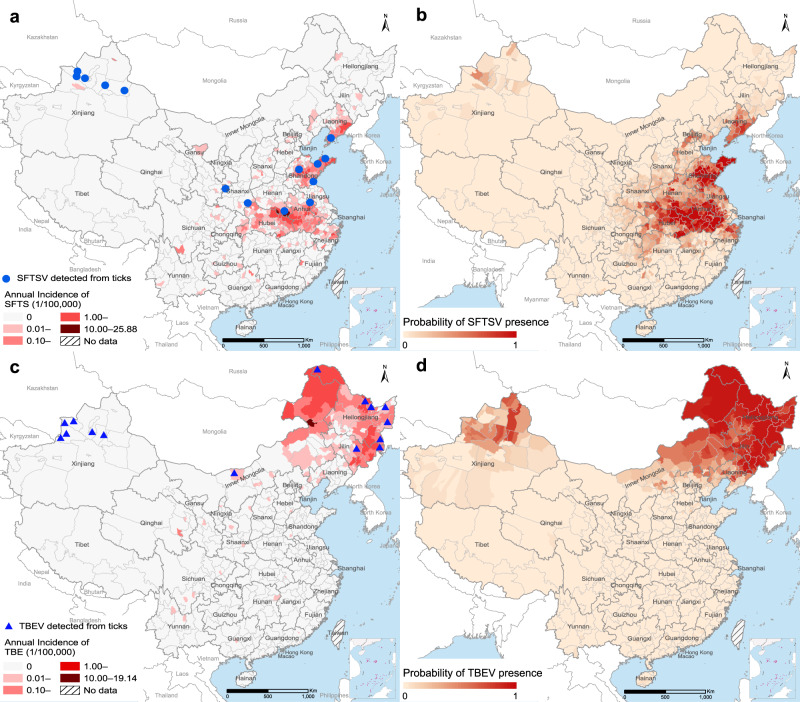
Understanding ecological niches of major tick species and prevalent tick-borne pathogens is crucial for efficient surveillance and control of tick-borne diseases. Here we provide an up-to-date review on the spatial distributions of ticks and tick-borne pathogens in China. We map at the county level 124 tick species, 103 tick-borne agents, and human cases infected with 29 species (subspecies) of tick-borne pathogens that were reported in China during 1950-2018. Haemaphysalis longicornis is found to harbor the highest variety of tick-borne agents, followed by Ixodes persulcatus, Dermacentor nutalli and Rhipicephalus microplus. Using a machine learning algorithm, we assess ecoclimatic and socioenvironmental drivers for the distributions of 19 predominant vector ticks and two tick-borne pathogens associated with the highest disease burden. The model-predicted suitable habitats for the 19 tick species are 14‒476% larger in size than the geographic areas where these species were detected, indicating severe under-detection. Tick species harboring pathogens of imminent threats to public health should be prioritized for more active field surveillance.


Conflict of interest statement

The authors declare no competing interests.

Figures

Fig. 1
Fig. 1. Tick species richness (circles) at the prefecture level in seven biogeographic zones in mainland China from 1950 to 2018.
I = Northeast district (NE), II = North China district (N), III = Inner Mongolia–Xinjiang district (IMX), IV = Qinghai–Tibet district (QT), V = Southwest district (SW), VI = Central China district (C), and VII = South China district (S). Source data are provided as a Source Data file.
Fig. 2
Fig. 2. Clustering of tick species based on their ecological features and spatial distributions at the county level.
Panels ae indicate the spatial distribution of the five clusters (clusters I‒V). The boundaries of the seven biogeographic zones are shown as black solid lines. The dendrogram in panel f displays the clusters I‒V of tick species. The features used for clustering are three quantities associated with each predictor in the BRT models. Two of the three quantities were displayed in panel f to indicate the possible level of ecological suitability: relative contributions (colors in ascending order from yellow to red) and the standardized median value of the predictor (numbers in the heatmap) among counties with tick occurrence (numbers 1‒4 indicate the position of this median in reference to the quartiles of this predictor among all counties). Source data are provided as a Source Data file.
Fig. 3
Fig. 3. The tick species and their corresponding tick-borne agents in China from 1950 to 2018.
The tick-borne agents marked in blue indicate the newly identified agents in the past two decades. Source data are provided as a Source Data file.
Fig. 4
Fig. 4. The distributions of human cases by species of tick-borne agents in China during 1950–2018.
Human cases are positioned at the center of either province (triangles) or prefectures/counties (circles) depending on data availability. a spotted fever group rickettsiae; b Anaplasmataceae; c Borrelia; d Babesia spp.; e bacteria; f viruses. Human cases of SFTSV and TBEV are not shown as they are described in other figures. Another five tick-borne viruses, including Huangpi tick virus, Lihan tick virus, Wenzhou tick virus, Wuhan tick virus, and Yongjia tick virus, were not displayed in the map due to lack of location information. Source data are provided as a Source Data file.
Fig. 5
Fig. 5. The reported and model-predicted distributions of SFTSV and TBEV at the county level in China.
a Reported annual incidence rate of human SFTS and locations of SFTSV detected from ticks. b Spatial distribution of model-predicted probabilities of SFTSV presence. c Reported annual incidence rate of human TBE and locations of TBEV detected from ticks. d Spatial distribution of model-predicted probabilities of TBEV presence. Source data are provided as a Source Data file.

References

    1. Parola P. Tick-borne rickettsial diseases: emerging risks in Europe. Comp. Immunol. Microbiol. Infect. Dis. 2004;27:297–304. doi: 10.1016/j.cimid.2004.03.006. - DOI - PubMed
    1. Dantas-Torres F, Chomel BB, Otranto D. Ticks and tick-borne diseases: a One Health perspective. Trends Parasitol. 2012;28:437–446. doi: 10.1016/j.pt.2012.07.003. - DOI - PubMed
    1. de la Fuente J, Estrada-Pena A, Venzal JM, Kocan KM, Sonenshine DE. Overview: ticks as vectors of pathogens that cause disease in humans and animals. Front. Biosci. 2008;13:6938–6946. doi: 10.2741/3200. - DOI - PubMed
    1. Fang LQ, et al. Emerging tick-borne infections in mainland China: an increasing public health threat. Lancet Infect. Dis. 2015;15:1467–1479. doi: 10.1016/S1473-3099(15)00177-2. - DOI - PMC - PubMed
    1. Kilpatrick AM, Randolph SE. Drivers, dynamics, and control of emerging vector-borne zoonotic diseases. Lancet. 2012;380:1946–1955. doi: 10.1016/S0140-6736(12)61151-9. - DOI - PMC - PubMed

Publication types