. 2021 Feb 17;12(1):1096.
doi: 10.1038/s41467-021-21346-6.

Single-cell transcriptional profiling of human thymic stroma uncovers novel cellular heterogeneity in the thymic medulla

Affiliations

Single-cell transcriptional profiling of human thymic stroma uncovers novel cellular heterogeneity in the thymic medulla

Jhoanne L Bautista et al. Nat Commun. .

Abstract

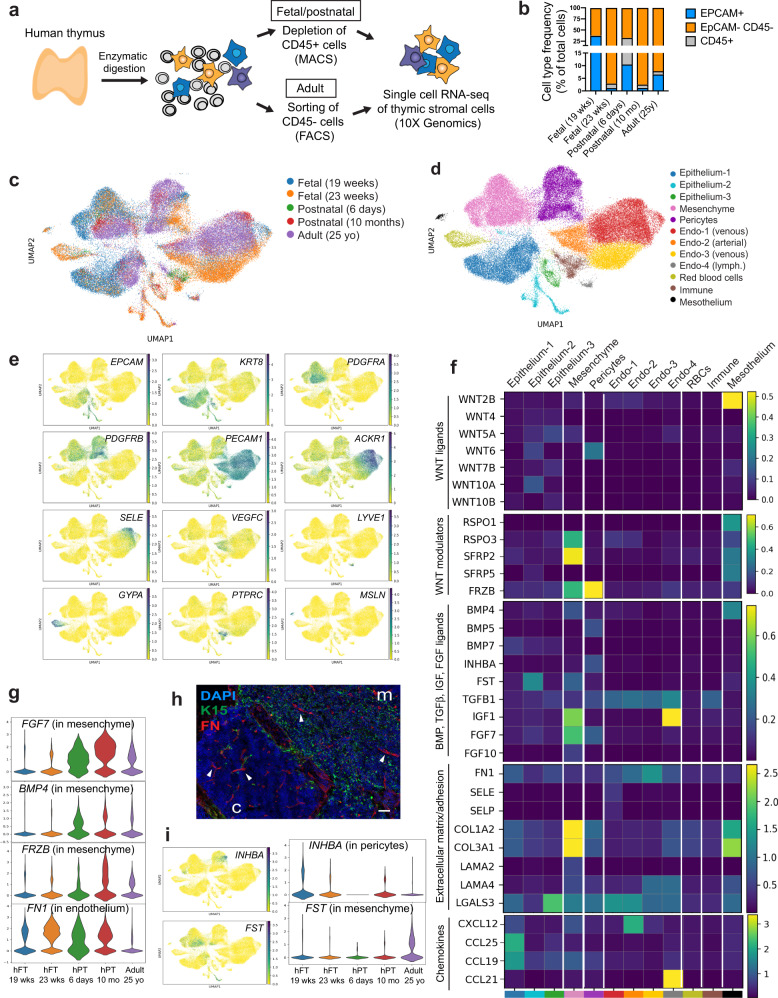
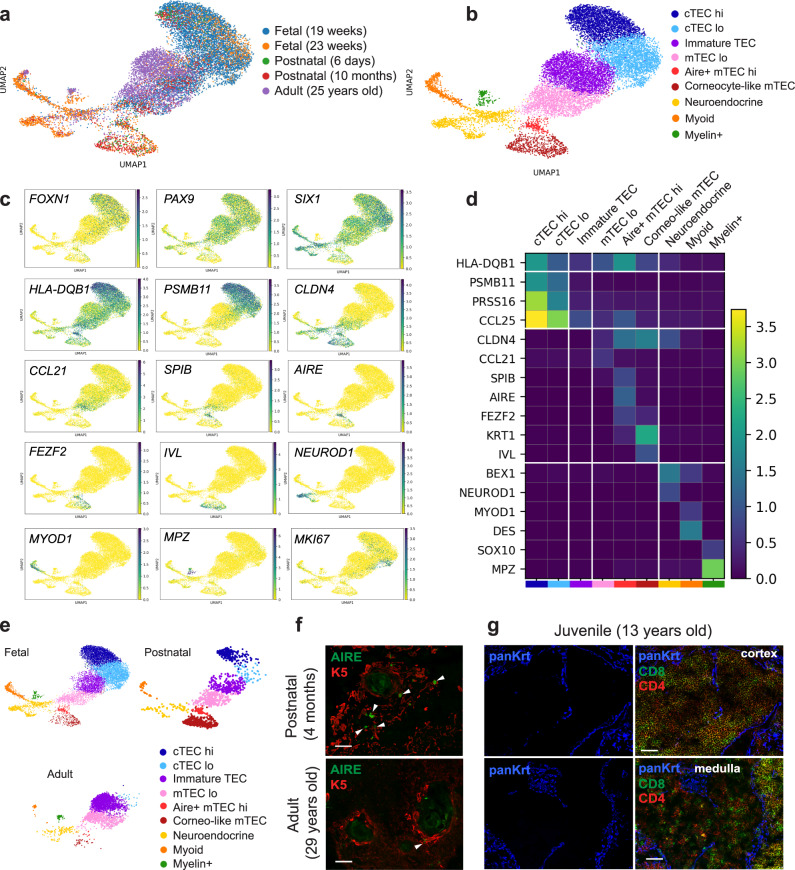
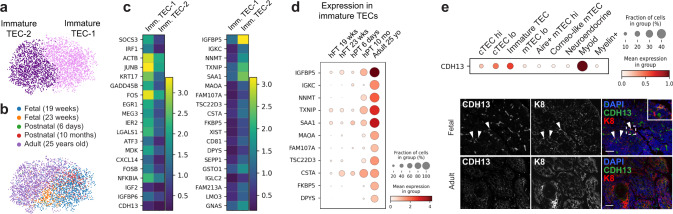
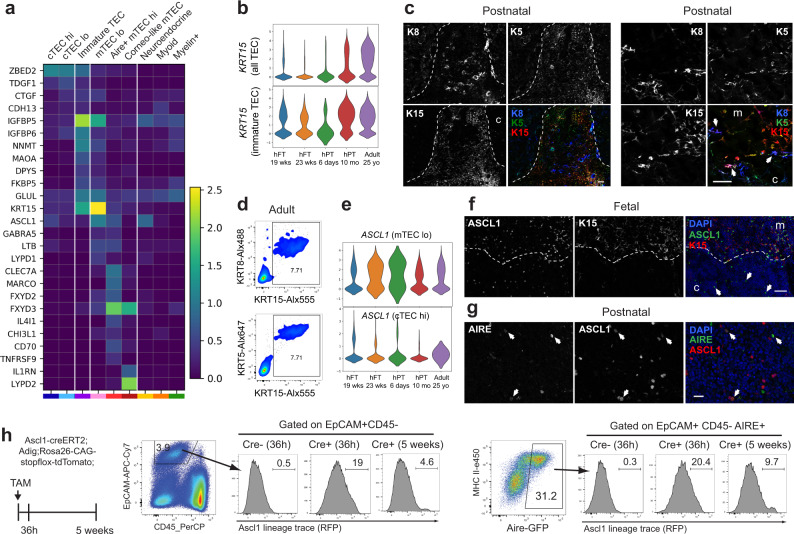
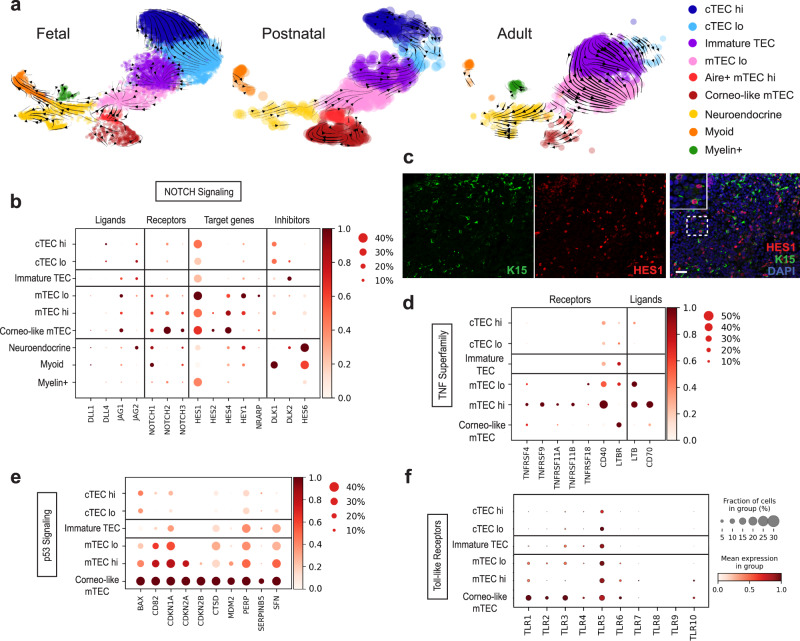
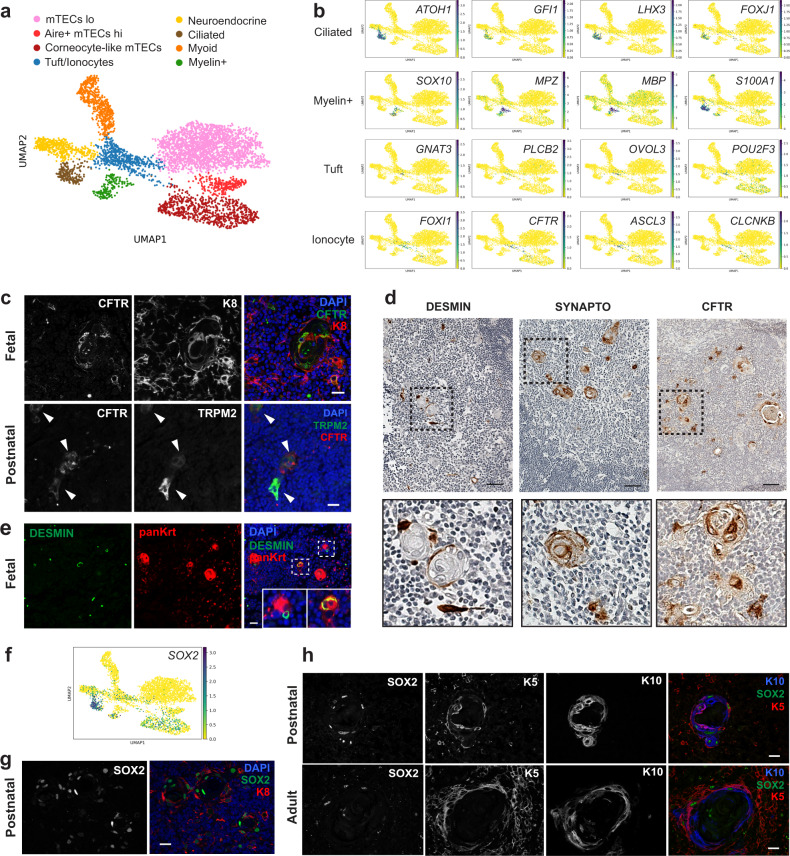
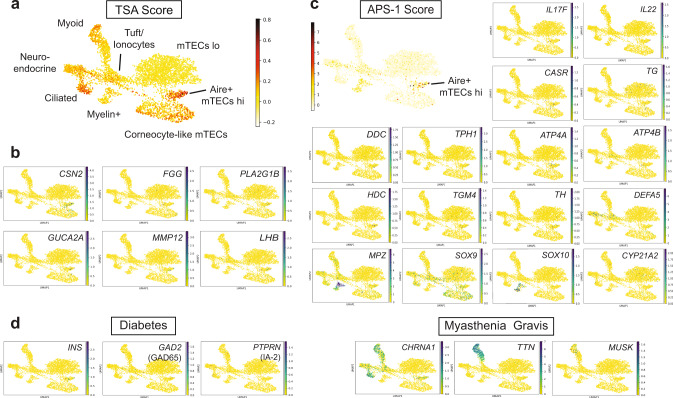
The thymus' key function in the immune system is to provide the necessary environment for the development of diverse and self-tolerant T lymphocytes. While recent evidence suggests that the thymic stroma is comprised of more functionally distinct subpopulations than previously appreciated, the extent of this cellular heterogeneity in the human thymus is not well understood. Here we use single-cell RNA sequencing to comprehensively profile the human thymic stroma across multiple stages of life. Mesenchyme, pericytes and endothelial cells are identified as potential key regulators of thymic epithelial cell differentiation and thymocyte migration. In-depth analyses of epithelial cells reveal the presence of ionocytes as a medullary population, while the expression of tissue-specific antigens is mapped to different subsets of epithelial cells. This work thus provides important insight on how the diversity of thymic cells is established, and how this heterogeneity contributes to the induction of immune tolerance in humans.


Conflict of interest statement

The authors declare no competing interests.

Figures

Fig. 1
Fig. 1. Single-cell profiling of stromal cells from human thymus.
a Workflow of tissue preparation for single-cell transcriptome profiling of human thymic stromal cells. CD45-negative cells were enriched using magnetic-activated cell sorting (MACS) or fluorescence-activated cell sorting (FACS). b Stacked bar graph of cell-type frequencies in each sample. Source data are provided as a Source Data file. c UMAP visualization of thymic stromal cells colored by age group. d UMAP visualization of thymic stromal cells colored by cell types. e UMAP visualization of the expression of known marker genes used for cell cluster identification. f Heatmap showing average expression of soluble factors, extracellular matrix/adhesion molecules, and chemokines in each stromal cluster. g Violin plots showing feature gene expression in human fetal thymus (hFT), human postnatal thymus (hPT) or adult thymus. Colors represent age group. h Immunofluorescence analysis of fibronectin (FN) and K15+ immature TECs/mTECs (green) expression in human fetal thymus (hFT). Arrows point to blood vessels with high expression of FN in the cortex (c) and medulla (m). Scale bar, 50 μm. Staining was repeated twice with similar results. i UMAP and violin plots showing expression of the activin ligand (INHBA) and inhibitor (FST) in human fetal thymus (hFT), human postnatal thymus (hPT) or adult thymus. Colors represent age group.
Fig. 2
Fig. 2. Profiling of human thymic epithelial cells at different stages.
a UMAP visualization of epithelial cells colored by age group. b UMAP visualization of epithelial cells colored by cell types. c UMAP visualization of the expression of known marker genes used for cell cluster identification. d Heatmap showing the average expression of known marker genes in each epithelial cluster. e UMAP visualization of epithelial subsets in fetal, postnatal, and adult samples. f Immunofluorescence staining of AIRE+ (green) K5+ (red) mTEChi cells in postnatal and adult tissues. Arrowheads point to AIRE+ cells. Scale bars, 50 μm. g Thymic tissue from a 13-year-old donor was stained with CD8 (green) and CD4 (red) antibodies to visualize thymocytes together with a wide spectrum cytokeratin antibody to identify epithelial cells (blue). Scale bars, 50 μm. Staining in f and g was repeated twice with many donors with similar results.
Fig. 3
Fig. 3. Analysis of immature TECs.
a, b UMAP visualization of immature TECs colored by cell type (a) or age (b). c Heatmap showing the expression of marker genes in each immature TEC (imm. TEC) cluster. d Dot plot of immature TEC gene expression in human fetal thymus (hFT), human postnatal thymus (hPT), or adult thymus. e Expression of CDH13 in epithelial subsets was confirmed by immunofluorescence analysis of human fetal thymus and human adult thymus. Scale bars, 50 μm. Staining was repeated three times with similar results.
Fig. 4
Fig. 4. Identification of new TEC markers.
a Heatmap showing the expression of newly identified marker genes in each epithelial cluster. b Violin plots of KRT15 expression in all TECs and in immature TECs. c Immunofluorescence analysis of KRT15 expression in postnatal human thymus. KRT8 (blue) and KRT5 (green) are also included as markers of TECs. Dotted line indicates the separation between cortex (c) and medulla (m). A higher magnification showing that KRT15 is expressed at low levels in KRT8+KRT5+ immature TECs and at higher level in mTECs is shown in the right panels. Medullary area is marked with “m” while cortical area is marked with “c”. Arrows point to examples of KRT8+KRT5+ immature TECs. Scale bars, 50 μm. d Flow cytometric analysis of KRT15, KRT8, and KRT5 expression in TECs isolated from adult thymus. e Violin plots of ASCL1 expression in mTEC lo and cTEC hi. f Immunofluorescence analysis of human fetal thymus demonstrating that ASCL1 (green) is expressed in KRT15hi (red) mTECs. ASCL1 expression is also detected in the cortex of fetal thymus (arrows). Dotted line marks the separation between cortex (c) and medulla (m). Scale bar, 50 μm. g Immunofluorescence analysis of postnatal thymus showing that expression of ASCL1 (red) in the thymic medulla partially overlaps with AIRE (green). Scale bar, 20 μm Arrows point to double positive mTECs. h Ascl1-lineage trace (RFP) in TECs at 36 h (n = 3 mice) and 5 weeks (n = 3 mice) post-tamoxifen (TAM) treatment. Percentage of RFP-labeled Aire+ TECs is shown. Expression of RFP in TECs from Cre-negative mice is also presented as negative control (n = 7 mice). Staining in c, f, and g was repeated at least three times with similar results.
Fig. 5
Fig. 5. Lineage decisions within the thymic epithelial compartment.
a Velocity field projected on the UMAP plots of fetal, postnatal, and adult samples. b Dot plot depicting the relative level of expression of Notch signaling ligands, receptors, target genes, and inhibitors in epithelial subsets. c Immunofluorescence staining of human fetal thymus showing expression of HES1 (red) in medullary KRT15+ TECs (green). Scale bar, 100 μm. Staining was repeated twice with similar results. df Dot plots depicting the relative level of expression of selected TNF Superfamily (d), p53 (e), or Toll-like receptor signaling pathway (f) genes.
Fig. 6
Fig. 6. Tuft cells, ionocytes, ciliated cells, and myelin-expressing cells are present in the human thymic medulla.
a UMAP visualization of mTECs, neuroendocrine, myoid, and myelin-expressing cells sub-clustering. b UMAP visualization of the expression of marker genes used for cell cluster identification. c Immunofluorescence analysis of human fetal and postnatal thymus confirming the presence of ionocytes positive for KRT8 (red) and CFTR (green) or TRPM2 (green) and CFTR (red) in the medulla. Scale bars, 20 μm. d Immunohistochemistry staining for ionocytes (CFTR), neuroendocrine cells (SYNAPTO), and myoid cells (DESMIN). Scale bars, 100 μm. e Immunofluorescence analysis showing co-staining of desmin-expressing myoid cells (green) with a wide spectrum cytokeratin antibody (red) in human fetal thymus. Scale bar, 25 μm. f UMAP visualization of SOX2 expression in medullary epithelial cells. g, h Immunofluorescence staining for SOX2 in postnatal and adult thymus confirms expression of this transcription factor in the medulla. A subset of SOX2+ cells (green) co-expressed KRT8 (red) (g) or KRT5 (red) and/or KRT10 (blue) (h). Scale bars, 20 μm. Staining in c, d, e, g, h was repeated at least twice with similar results.
Fig. 7
Fig. 7. Characterization of tissue-specific antigen expression by human TECs.
a UMAP visualization of the average expression of tissue-specific antigens (TSA score) in medullary epithelial cells. b UMAP visualization of the expression of genes that positively correlate with a high TSA score in AIRE+ or corneocyte-like mTECs. c UMAP plots showing the expression of antigens eliciting autoantibodies in APS-1 patients. d Feature plots of antigens eliciting autoantibodies in type 1 diabetes and myasthenia gravis patients.

References

    1. Rossi SW, Jenkinson WE, Anderson G, Jenkinson EJ. Clonal analysis reveals a common progenitor for thymic cortical and medullary epithelium. Nature. 2006;441:988–991. doi: 10.1038/nature04813. - DOI - PubMed
    1. Bleul CC, et al. Formation of a functional thymus initiated by a postnatal epithelial progenitor cell. Nature. 2006;441:992–996. doi: 10.1038/nature04850. - DOI - PubMed
    1. Baik S, Jenkinson EJ, Lane PJL, Anderson G, Jenkinson WE. Generation of both cortical and Aire(+) medullary thymic epithelial compartments from CD205(+) progenitors. Eur. J. Immunol. 2013;43:589–594. doi: 10.1002/eji.201243209. - DOI - PMC - PubMed
    1. Ohigashi I, et al. Aire-expressing thymic medullary epithelial cells originate from β5t-expressing progenitor cells. Proc. Natl Acad. Sci. USA. 2013;110:9885–9890. doi: 10.1073/pnas.1301799110. - DOI - PMC - PubMed
    1. Mayer CE, et al. Dynamic spatio-temporal contribution of single β5t+ cortical epithelial precursors to the thymus medulla. Eur. J. Immunol. 2016;46:846–856. doi: 10.1002/eji.201545995. - DOI - PMC - PubMed

Publication types

MeSH terms