Multicenter Study
. 2021 Feb 17;12(1):1090.
doi: 10.1038/s41467-021-21358-2.

Reduction in mobility and COVID-19 transmission

Affiliations
Multicenter Study

Reduction in mobility and COVID-19 transmission

Pierre Nouvellet et al. Nat Commun. .

Abstract

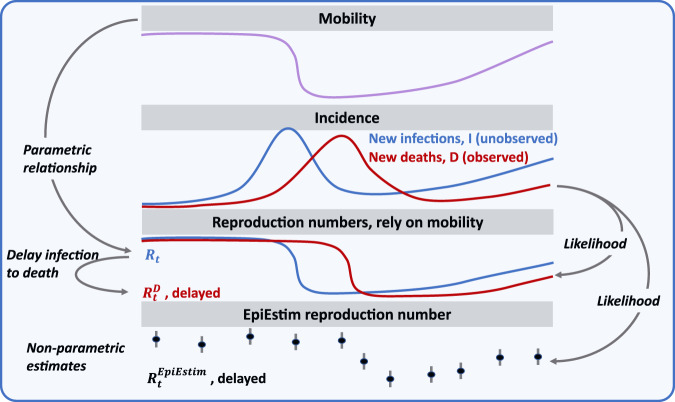
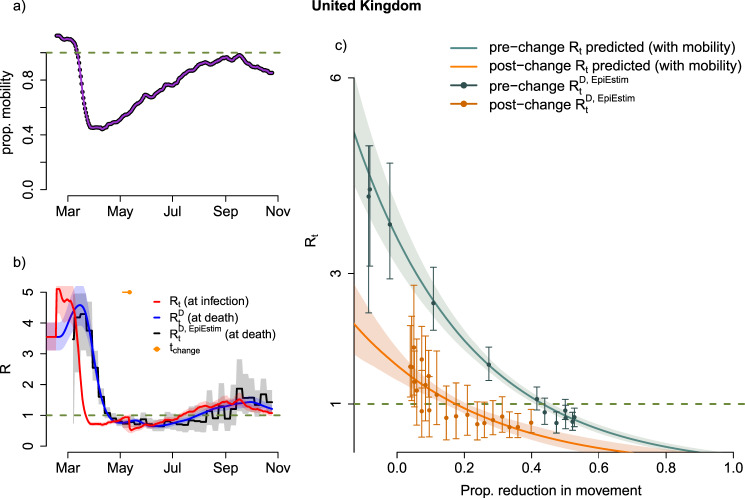
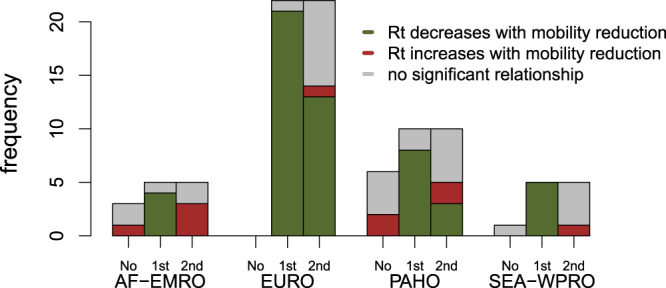
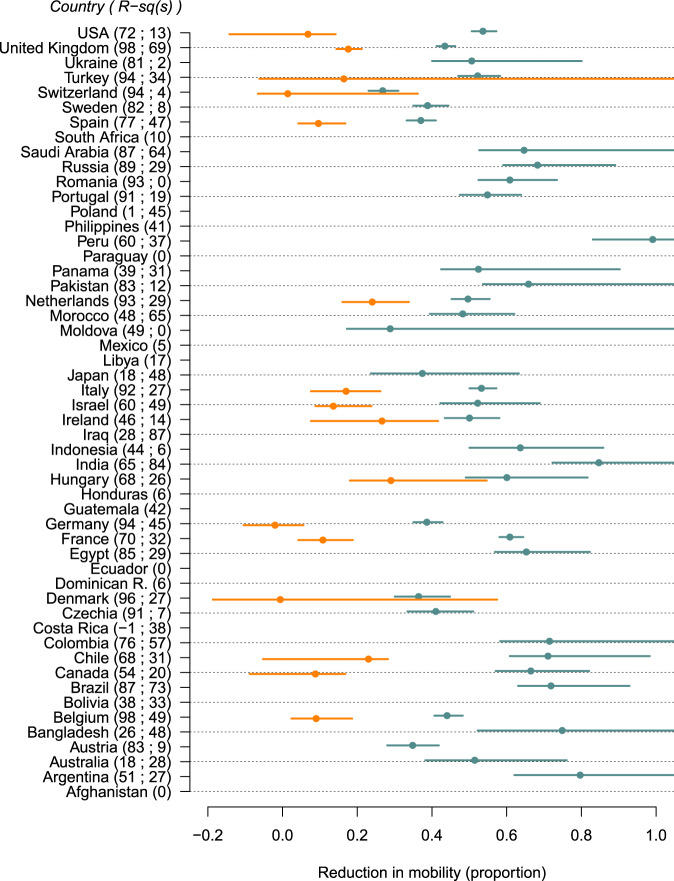
In response to the COVID-19 pandemic, countries have sought to control SARS-CoV-2 transmission by restricting population movement through social distancing interventions, thus reducing the number of contacts. Mobility data represent an important proxy measure of social distancing, and here, we characterise the relationship between transmission and mobility for 52 countries around the world. Transmission significantly decreased with the initial reduction in mobility in 73% of the countries analysed, but we found evidence of decoupling of transmission and mobility following the relaxation of strict control measures for 80% of countries. For the majority of countries, mobility explained a substantial proportion of the variation in transmissibility (median adjusted R-squared: 48%, interquartile range - IQR - across countries [27-77%]). Where a change in the relationship occurred, predictive ability decreased after the relaxation; from a median adjusted R-squared of 74% (IQR across countries [49-91%]) pre-relaxation, to a median adjusted R-squared of 30% (IQR across countries [12-48%]) post-relaxation. In countries with a clear relationship between mobility and transmission both before and after strict control measures were relaxed, mobility was associated with lower transmission rates after control measures were relaxed indicating that the beneficial effects of ongoing social distancing behaviours were substantial.


Conflict of interest statement

The authors declare no competing interests.

Figures

Fig. 1
Fig. 1. Schematic of the methodology.
A parametric relationship between transmission and mobility is assumed and allows to link the effective reproduction number at time of infection (Rt,i) to mobility (mt,i).We obtain the delayed effective reproduction number at time of death (Rt,iD) as a weighted average of Rt,i’s, relying on the delay between infection and death (see Methods section). Inference relies on the likelihood of observed vs predicted deaths, with predicted deaths being a function the Rt,iD (see Methods section). To estimates how much variations in transmission can be explained by variations in mobility, we estimate a non-parametric and delayed reproduction number relying on EpiEstim framework (Rt,iD,EpiEstim) and compare it to Rt,iD.
Fig. 2
Fig. 2. Relationship between human mobility and transmission.
a Smoothed combined Apple-Google mobility. b Estimated daily effective reproduction number for infections (red, Rt,i) and delayed effective reproduction at time of deaths (blue, Rt,iD) estimated using the best-fitting model and mobility data. Effective reproduction number (Rt,iD,EpiEstim) estimated from deaths data alone using a daily 7-day non-overlapping window (black). In each case shading represents the 95% credible interval. Horizontal orange dot and line show the median and 95% CrI for the timing of the change in the relationship between mobility and transmission. c Estimates of the reproduction number against changes in mobility using our best model (5 estimated parameters): green/red lines show the median predictions pre/post change in relationship, with shading indicating the 95% CrI. The ‘EpiEstim’ effective reproduction number using EpiEstim’-like method are shown as error bars in green /orange for approximate pre-post change in relationship with 95% CrI (bands). Results based on the Apple-Google mobility data-stream – equivalent figure using the Apple transit mobility data-stream can be found in the SI (Supplementary Fig. 5); the Apple-related figure shows a qualitatively similar fit but with a marginally better DIC (DIC reduction of 32). Equivalent figures for other countries can be found in the SI (Supplementary Figs. 4–5).
Fig. 3
Fig. 3. Summary of relationship between mobility and transmissibility.
Frequency of countries for which we found a significantly decreasing, increasing, or no clear relationship between mobility and transmissibility (green, red and grey bars respectively). For each WHO region, we further divided countries for which no change in relationship was inferred (labelled “No”), and for those where a change in relationship was significant, we plot separately the nature of the relationship during the first and second time periods (labelled “1st” and “2nd” respectively). Some WHO regions were aggregated, with AF-EMRO corresponding to the African and Eastern Mediterranean Regions, EURO corresponding to the European Region, PAHO corresponding to the Pan-American Region, and SEA-WPRO corresponding to the South-East Asia and the Western Pacific Regions.
Fig. 4
Fig. 4. Country-specific mobility thresholds to interrupt transmission.
Interruption of transmission occurs when R < 1, thresholds presented are based on the Apple-Google mobility data-stream. Thresholds are only defined when transmissibility significantly decreases with a reduction in mobility. Countries with no threshold are still shown. Points indicate the median and horizontal bars the 95% CrI. Upper 95%CrI limits of the mobility going above 1 indicate that the upper limits remain unidentifiable. Turquoise and orange thresholds correspond to the pre- and post-change in the mobility-transmissibility relationship respectively. The y-axis shows specific countries and, next to their names, the predictive abilities of the model in that country (i.e., adjusted R-squared of Rt,iD,obs against Rt,iD; two R-squared values indicate a change in relationship was inferred).
Fig. 5
Fig. 5. Comparison of fit between the individual data-streams and the Apple-Google data-stream used in the main results.
Fit is assessed as the difference in DIC, a positive value (above the red horizontal line) indicates the individual data-stream could be favoured over the Apple-Google data-stream. The boxplot shows medians, interquartile ranges, ranges and outliers. Above the threshold of 10 highlighted with the dashed grey line, the individual data-stream would have substantially improved the fit of the model. The y-axis is on a “signed” square root scale.

Similar articles

Cited by

References

    1. World Health Organization. Statement on the second meeting of the International Health Regulations (2005) Emergency Committee regarding the outbreak of novel coronavirus (2019-nCoV). Available at: https://www.who.int/news-room/detail/30-01-2020-statement-on-the-second-... (Accessed: 14th May 2020).
    1. Wu JT, Leung K, Leung GM. Nowcasting and forecasting the potential domestic and international spread of the 2019-nCoV outbreak originating in Wuhan, China: a modelling study. Lancet. 2020;395:689–697. doi: 10.1016/S0140-6736(20)30260-9. - DOI - PMC - PubMed
    1. Du Z, et al. Risk for transportation of coronavirus disease from Wuhan to other cities in China. Emerg. Infect. Dis. 2020;26:1049–1052. doi: 10.3201/eid2605.200146. - DOI - PMC - PubMed
    1. ECDC. Data on the geographic distribution of COVID-19 cases worldwide. Available at: https://opendata.ecdc.europa.eu/covid19/casedistribution/csv.
    1. Zhu N, et al. A novel coronavirus from patients with pneumonia in China, 2019. N. Engl. J. Med. 2020;382:727–733. doi: 10.1056/NEJMoa2001017. - DOI - PMC - PubMed

Publication types