. 2021 Feb 17;12(1):1097.
doi: 10.1038/s41467-021-21341-x.

Telomeres reforged with non-telomeric sequences in mouse embryonic stem cells

Affiliations

Telomeres reforged with non-telomeric sequences in mouse embryonic stem cells

Chuna Kim et al. Nat Commun. .

Abstract

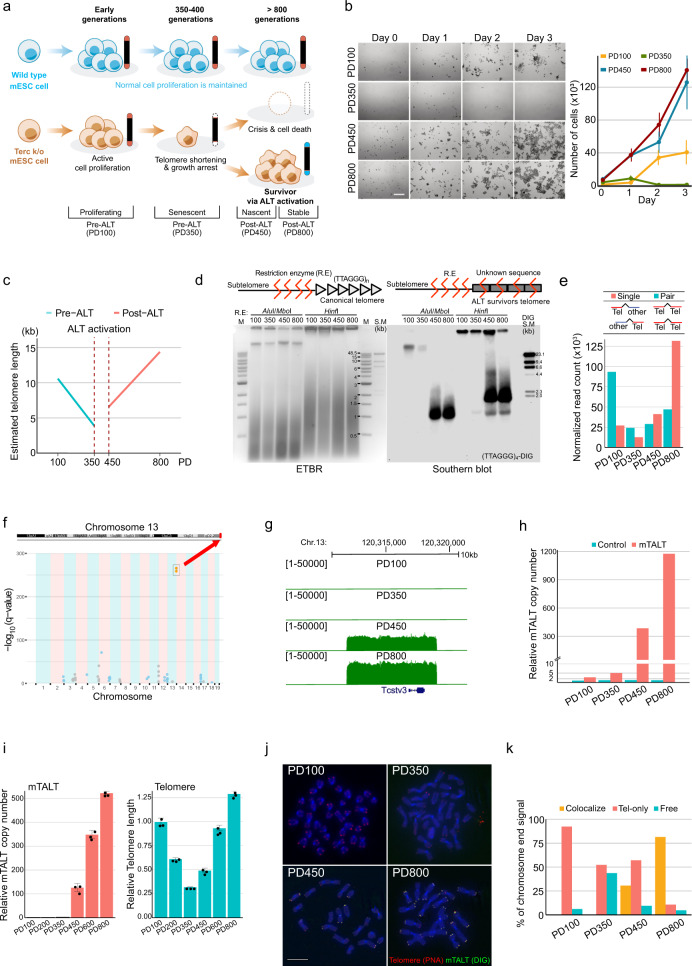
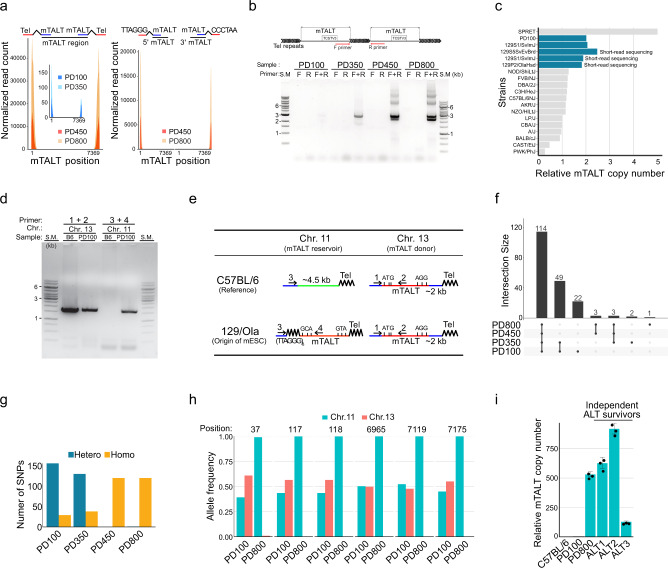
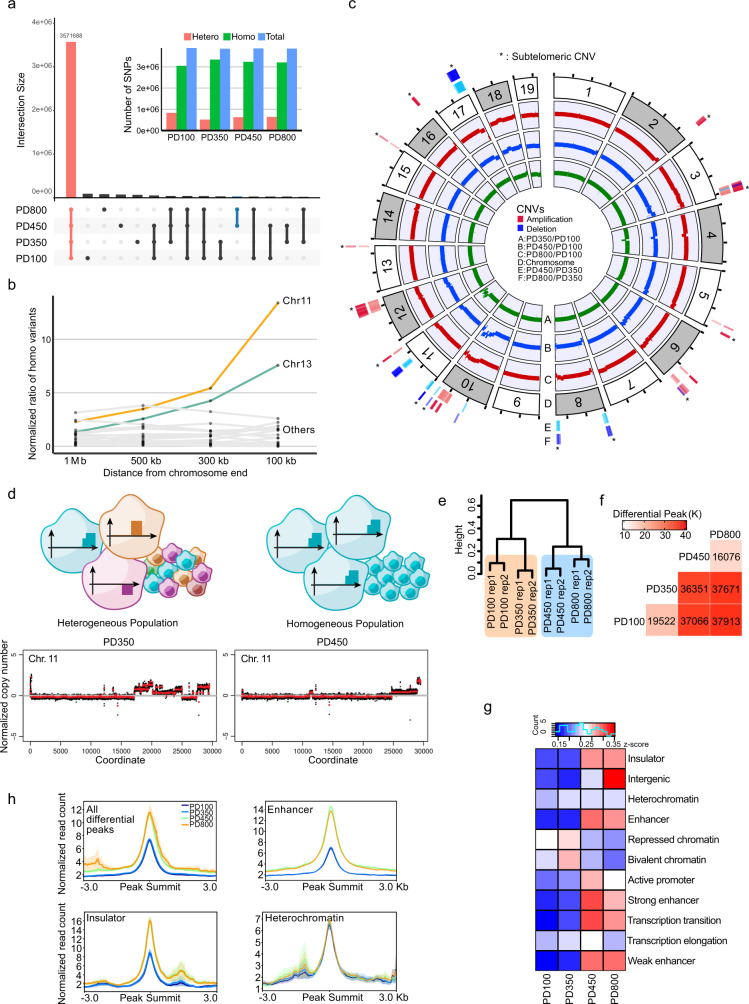
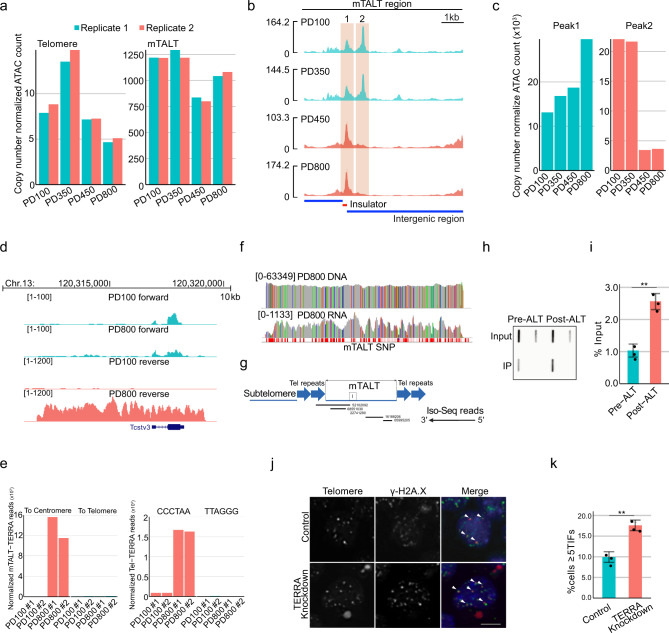
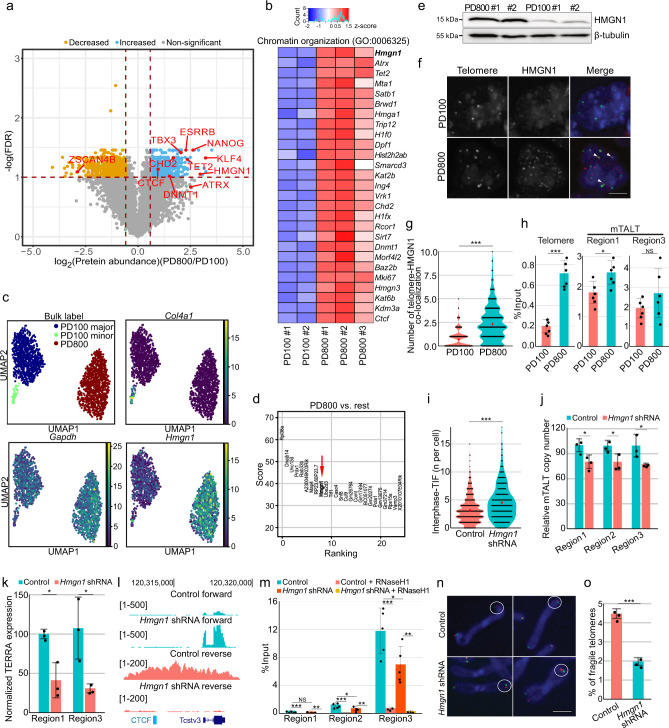
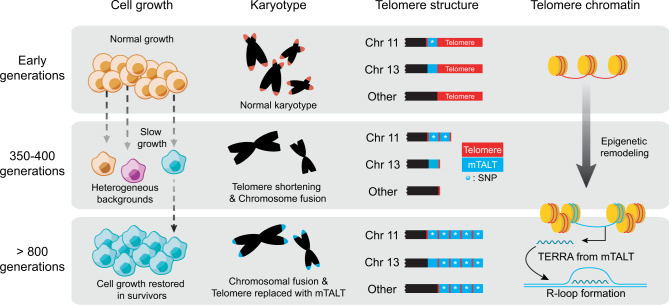
Telomeres are part of a highly refined system for maintaining the stability of linear chromosomes. Most telomeres rely on simple repetitive sequences and telomerase enzymes to protect chromosomal ends; however, in some species or telomerase-defective situations, an alternative lengthening of telomeres (ALT) mechanism is used. ALT mainly utilises recombination-based replication mechanisms and the constituents of ALT-based telomeres vary depending on models. Here we show that mouse telomeres can exploit non-telomeric, unique sequences in addition to telomeric repeats. We establish that a specific subtelomeric element, the mouse template for ALT (mTALT), is used for repairing telomeric DNA damage as well as for composing portions of telomeres in ALT-dependent mouse embryonic stem cells. Epigenomic and proteomic analyses before and after ALT activation reveal a high level of non-coding mTALT transcripts despite the heterochromatic nature of mTALT-based telomeres. After ALT activation, the increased HMGN1, a non-histone chromosomal protein, contributes to the maintenance of telomere stability by regulating telomeric transcription. These findings provide a molecular basis to study the evolution of new structures in telomeres.


Conflict of interest statement

The authors declare no competing interests.

Figures

Fig. 1
Fig. 1. mESCs amplify the mouse template for ALT (mTALT) sequence to maintain telomere length.
a Schematics of retrieving ALT mESCs. b Growth rate assay with crystal violet staining. (left) Representative images of each cell at daily intervals. (right) Quantified results. The bars represent means and SDs from ≥20 images per condition over five independent experiments. Scale bar, 20 μm. c Telomere length quantified from WGS. d TRF assay with DIG-(CCCTAA)*4 probe. Genomic DNA samples were cut using the indicated enzymes. S.M size marker. e Telomere length quantified from WGS according to read types. ‘Pair’ indicates that both read mates contain telomeric repeats, and ‘Single’ indicates that one read does. f Mapping result of the mate reads of single telomeric reads. g Snapshot of mTALT region with the mapped WGS data. h Calculated copy number of mTALT from WGS. Control, chr13:109,998,778-110,006,148. i Calculated copy number of mTALT from mmqPCR. mTALT-specific or telomere-specific protocols were used. The bars represent the means and SDs from three biologically independent replicates. j Representative images of fluorescence in situ hybridisation (FISH) of mTALT and telomeric repeats. Scale bar, 5 μm. k Quantification of mTALT and telomere co-localisation. ≥16 cells per condition were taken. Source data are provided as a Source Data file.
Fig. 2
Fig. 2. A specific copy of mTALT is duplicated in a constant orientation.
a (Left) Alignment of the mate reads of telomere-containing reads. (Right) Alignment of the mate reads of telomere-containing reads in a strand-specific way. b (Top) Schematics of the tandemly duplicated mTALTs and the specific primers used. (Bottom) PCR assays showing the directionality of mTALT duplication. c Calculated copy numbers of mTALTs from WGS data of various mouse strains. d PCR assays elucidating the presence of mTALT on chromosome 11. e Schematics of the mTALT region in chromosomes 11 and 13 of the reference (C57BL/6J) and 129/Ola genome. f SNP analysis of the mTALT region at each time point. The connected lines denote groups sharing SNPs. g Number of SNPs sorted by allelic zygosity. h Frequencies of representative SNPs in mTALT region. i Calculated copy numbers of mTALTs from independent ALT survivors. The bars represent the means and SDs from three biologically independent replicates. Source data are provided as a Source Data file.
Fig. 3
Fig. 3. ALT mESCs experienced extensive copy-number variations (CNV) and epigenetic remodelling.
a Genome-wide SNP analysis at each time point. The connected lines denote groups sharing SNPs. (Inside) Number of SNPs sorted by allelic zygosity. b Numbers of homozygous SNPs of each chromosome focusing on subtelomeric regions. c Copy-number variation (CNV) analysis. Green, blue, and red each denote the CNV of PD350, PD450, and PD800, respectively, compared to PD100 as the control. The outermost colour represents the CNV of PD800 compared to PD350, and the inner colour represents the CNV of PD450. d (Top) CNVs of chromosome 11 at PD350 and PD450. (Bottom) Schematics of the cellular heterogeneity at PD350 and the selected result at PD450. e Hierarchical clustering of ATAC-seq peaks. f Heat map of differential ATAC-seq peaks. g Heat map of the functional terms of ATAC-seq data. Colour index indicates the relative proportion of each time point. h Normalised differential ATAC-seq peaks aligned to the peak summit. The solid lines and the error bands represent the mean of each data and the standard errors of the mean, respectively. Source data are provided as a Source Data file.
Fig. 4
Fig. 4. Long non-coding RNA transcribed from ALT telomeres is important for telomere maintenance in ALT mESCs.
a Copy number normalised ATAC-seq counts mapped to telomere and mTALT regions. b mTALT region snapshot of ATAC-seq peaks. c Quantification of ATAC-seq peaks mapped to specific peaks inside mTALT in b. d Snapshot of RNA-seq of the mTALT region. ‘Forward’ and ‘reverse’ denote the transcription directions. e Calculated levels of mTALT-containing (left) and telomeric repeat-containing transcripts (right) according to the transcriptional direction. f Snapshot of the SNPs of mTALT genomic sequences and transcripts. g Iso-Seq reads aligned to the mTALT region. The right ends of all reads are 5ʹ. I insulator. h Representative figure of the slot-blot with a telomere-specific probe for the DRIP assay. Input DNA was loaded at a 1/10 dilution. i Quantification of slot-blot results. The bars represent the means and SDs from three biologically independent replicates. P value from a two-tailed unpaired t-test: **P = 0.0012. j Representative images of interphase-TIF analysis. Scale bar, 5 μm. k Quantification of the ratio of cells with more than five TIFs. The bars represent the means and SDs from three biologically independent replicates. P values from a two-tailed unpaired t-test: **P = 0.0018. Source data are provided as a Source Data file.
Fig. 5
Fig. 5. Multi-omic analyses identified HMGN1 as a protein involved in ALT.
a Volcano plot showing the differentially expressed proteins in post-ALT cells (PD800) compared to pre-ALT cells (PD100). Quantitative proteomic analysis was done in biological triplicate for PD800 and duplicate for PD100. The red dot lines indicate 1.5 fold change lines (vertical), and 0.1 of false discovery rate (FDR) line (horizontal). b Heat map showing the differentially expressed proteins of the term chromatin organisation. Colour index indicates z-score of protein expressions and ‘count’ (with regard to histogram) indicates the accumulated number of indicated values represented in the heatmap. c UMAP projection of single-cell RNA-seq data. Each dot represents a different cell. Each plot is colour-coded by identified clusters (top left), expression level of Col4a1 (top right), Gapdh (bottom left), and Hmgn1 (bottom right). d Genes were ranked according to their contributions to differentiation of the PD800 cluster from the others. e Western blot showing HMGN1 expression levels in post-ALT (PD800) and pre-ALT (PD100) cells. Tubulin was used as a loading control. f Representative image of immunostaining of HMGN1 and telomeres. Scale bar, 5 μm. g Quantification of HMGN1 and telomere co-localisation. The dots and bars represent means and confidence intervals for the means, respectively, from ≥200 cells per condition over three independent experiments. P value from a two-tailed unpaired t-test: ***P < 0.0001. h Chromatin immunoprecipitation (ChIP) analysis with HMGN1 antibody. The bars represent the means and SDs from three biologically independent replicates. P value from a two-tailed unpaired t-test: ***P < 0.0001, *P = 0.0130, NS non-significant. i Violin plot showing the TIFs of control and HMGN1 knock-down cells. Each dot represents TIFs in a cell. The dots and bars represent means and confidence intervals for the means, respectively, from ≥200 cells per condition over three independent experiments. P value from a two-tailed unpaired t-test: ***P < 0.0001. j Telomere length quantification with mmqPCR. The bars represent the means and SDs from three biologically independent replicates. P values from a two-tailed unpaired t-test: Region 1 *P = 0.0371, Region 2 *P = 0.0433, Region 3 *P = 0.0466. k TERRA expression quantified by qPCR. All infected cells were post-ALT (PD800). P values from a two-tailed unpaired t-test: Region 1 *P = 0.0116; Region 3 *P = 0.0293. l Snapshot of the mTALT region of RNA-seq. ‘forward’ and ‘reverse’ denote the transcription directions. m DRIP-qPCR quantified with specific primers. The bars represent the means and SDs from five biologically independent replicates for no RNaseH1-treated samples and three for RNaseH1-treated samples. All infected cells were post-ALT (PD800). P values from a two-tailed unpaired t-test: Region 1 NS, non-significant, ***P = 0.0009, **P = 0.0040; Region 2 *P = 0.0331, ***P = 0.0009, **P = 0.0079; Region 3 *P = 0.0332, ***P = 0.0013, **P = 0.0050. n Representative images of telomere fragility. Scale bar, 1 μm. o Telomere fragility was quantified from chromosome orientation (CO) FISH. The bars represent the means and SDs from ≥30 cells per condition over three independent experiments. P value from a two-tailed unpaired t-test: ***P = 0.0002. Regions 1–3 denote specific regions inside the mTALT sequence. Source data are provided as a Source Data file.
Fig. 6
Fig. 6. A working model of ALT activation of mESCs.
This figure summarises the emergence process of ALT mESC from various aspects. After the Terc gene was knocked out, cells of the early generation grew normally, but as the telomere length decreased growth slowed down and cells approached a senescent state. Affected by telomere shortening, genome-wide copy-number changes, and chromosomal fusions occurred, and transcriptional networks and cellular physiology changed accordingly. One or more cells activated ALT and were selected to form a homogenous post-ALT cell population. In an evolutionary time-line, the mTALT sequence was located at chromosome 13 first, and at a certain point, replicated at the end of chromosome 11. In the process of telomere shortening, the only mTALT of chromosome 11 underwent selective duplication, and during ALT activation, the mTALT of chromosome 11 was amplified in cis and trans to cover all telomeres. Through transcriptome and proteome analyses, we confirmed that genome-wide epigenetic remodelling occurred during the ALT activation process, and the expression of telomeric transcripts and R-loop formation increased due to HMGN1-dependent telomeric changes, contributing to telomere maintenance.

References

    1. Levy MZ, Allsopp RC, Futcher AB, Greider CW, Harley CB. Telomere end-replication problem and cell aging. J. Mol. Biol. 1992;225:951–960. doi: 10.1016/0022-2836(92)90096-3. - DOI - PubMed
    1. Blackburn EH. Structure and function of telomeres. Nature. 1991;350:569–573. doi: 10.1038/350569a0. - DOI - PubMed
    1. Shay JW, Wright WE. Senescence and immortalization: role of telomeres and telomerase. Carcinogenesis. 2005;26:867–874. doi: 10.1093/carcin/bgh296. - DOI - PubMed
    1. Bernadotte A, Mikhelson VM, Spivak IM. Markers of cellular senescence. Telomere shortening as a marker of cellular senescence. Aging. 2016;8:3. doi: 10.18632/aging.100871. - DOI - PMC - PubMed
    1. Cesare AJ, Reddel RR. Alternative lengthening of telomeres: models, mechanisms and implications. Nat. Rev. Genet. 2010;11:319–330. doi: 10.1038/nrg2763. - DOI - PubMed

Publication types

MeSH terms