. 2021 Feb 17;11(1):4022.
doi: 10.1038/s41598-021-83575-5.

Machine learning methodology for high throughput personalized neutron dose reconstruction in mixed neutron + photon exposures

Affiliations

Machine learning methodology for high throughput personalized neutron dose reconstruction in mixed neutron + photon exposures

Igor Shuryak et al. Sci Rep. .

Abstract

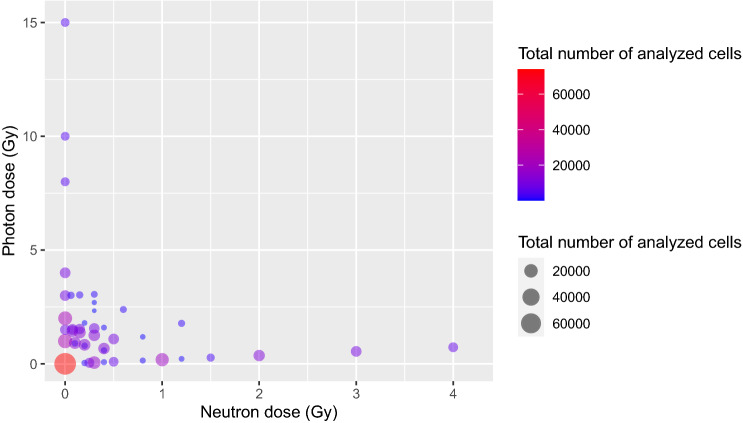
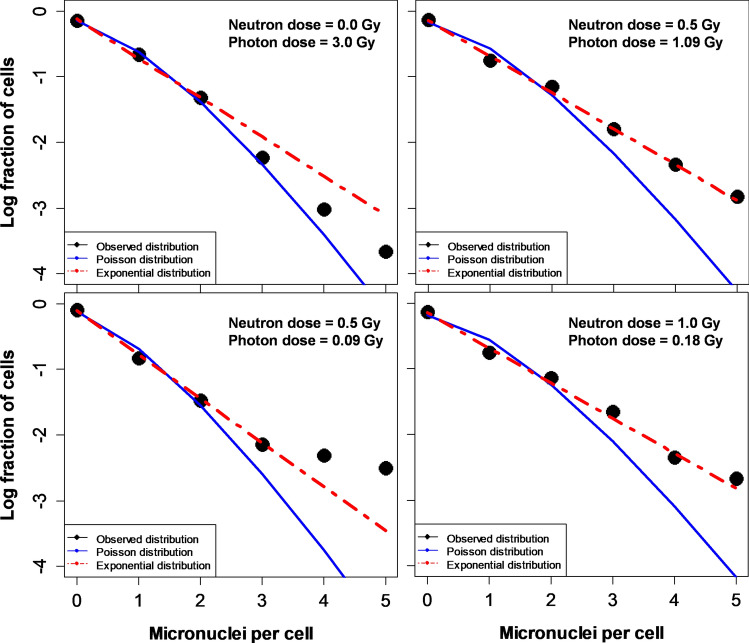
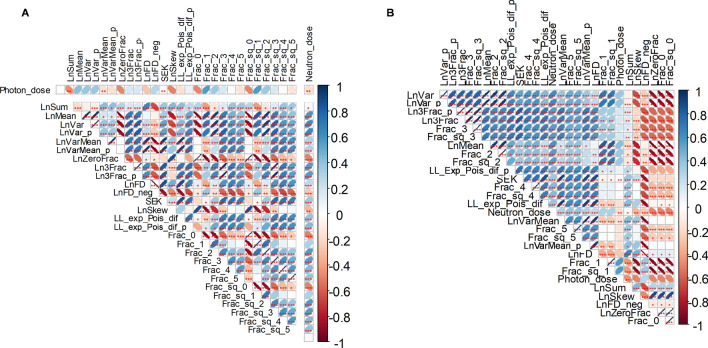
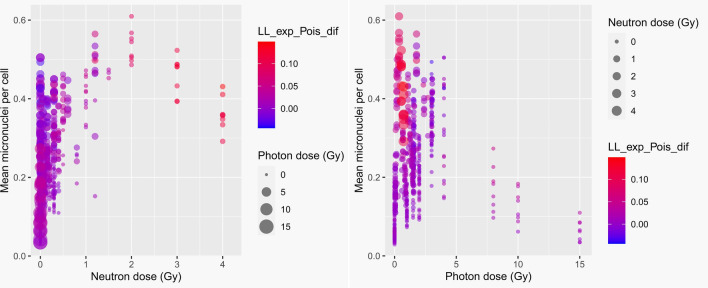
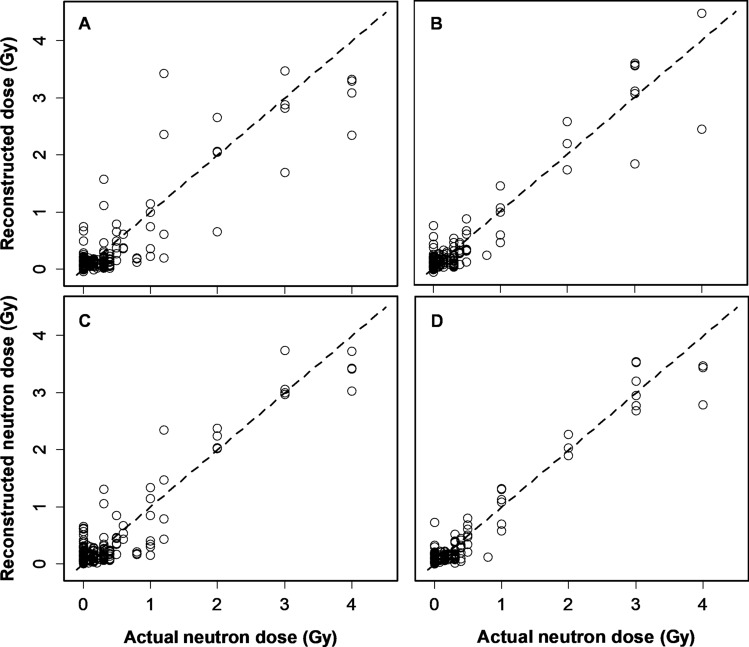
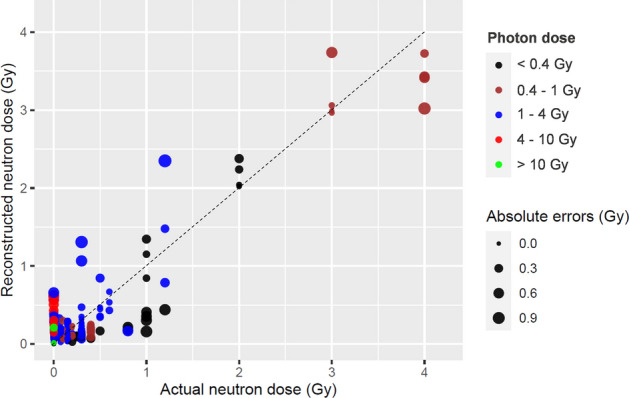
We implemented machine learning in the radiation biodosimetry field to quantitatively reconstruct neutron doses in mixed neutron + photon exposures, which are expected in improvised nuclear device detonations. Such individualized reconstructions are crucial for triage and treatment because neutrons are more biologically damaging than photons. We used a high-throughput micronucleus assay with automated scanning/imaging on lymphocytes from human blood ex-vivo irradiated with 44 different combinations of 0-4 Gy neutrons and 0-15 Gy photons (542 blood samples), which include reanalysis of past experiments. We developed several metrics that describe micronuclei/cell probability distributions in binucleated cells, and used them as predictors in random forest (RF) and XGboost machine learning analyses to reconstruct the neutron dose in each sample. The probability of "overfitting" was minimized by training both algorithms with repeated cross-validation on a randomly-selected subset of the data, and measuring performance on the rest. RF achieved the best performance. Mean R2 for actual vs. reconstructed neutron doses over 300 random training/testing splits was 0.869 (range 0.761 to 0.919) and root mean squared error was 0.239 (0.195 to 0.351) Gy. These results demonstrate the promising potential of machine learning to reconstruct the neutron dose component in clinically-relevant complex radiation exposure scenarios.


Conflict of interest statement

The authors declare no competing interests.

Figures

Figure 1
Figure 1
Summary of the analyzed data set on radiation-induced micronuclei in ex vivo irradiated peripheral blood lymphocytes. Each circle represents a specific combination of neutron and/or photon doses. The same data are listed numerically in Supplementary Table S1.
Figure 2
Figure 2
Comparison of some real data examples from our data set with the Poisson and Exponential distributions. These examples show the tendency of the data to deviate away from the Poisson distribution and to approach an Exponential distribution in blood samples exposed to substantial neutron doses. In contrast, data from samples exposed to photons only tend to be closer to the Poisson distribution.
Figure 3
Figure 3
Matrix of Spearman’s correlation coefficients between all variables in the analyzed training data set. The meanings of all variables are provided in Table 1, and a color-coded correlation scale is provided on the right of the plot. Blue ellipses represent positive correlations, and red ones represent negative correlations. Darker color tones and narrower ellipses represent larger correlation coefficient magnitudes. Red star symbols indicate statistical significance levels: ***indicates p < 0.001, **indicates p < 0.01, *indicates p < 0.05, no stars indicate p > 0.05. These p-values here are intended only for visualization: since the correlations are pairwise, without correction for multiple testing, only 3-star significance levels are likely to indicate strong associations. Blank squares indicate correlation coefficients close to zero. (A) Default ordering of variables with photon and neutron doses in the top rows. (B) Ordering of variables by similar correlation coefficients to show variable groupings.
Figure 4
Figure 4
Visualization of how micronuclei per binucleated cell probability distribution shapes systematically differ after photon and neutrons exposures. Each circle represents a blood sample. The left and right panels show the same data set, but focus on different variables. LL_exp_Pois_dif (described in Table 1) is one of the predictors used in the machine learning analysis.
Figure 5
Figure 5
Neutron dose reconstruction results by the robust linear regression (RL) and random forest (RF) algorithms on testing data. (A) Results of analyzing the full data set by RL. R2 = 0.767, RMSE = 0.319 Gy. (B) Results of analyzing a subset of data where only blood samples with ≥ 300 cells were used by RL. R2 = 0.900, RMSE = 0.246 Gy. (C) Results of analyzing the full data set by RF. R2 = 0.860, RMSE = 0.248 Gy. (D) Results of analyzing a subset of data where only blood samples with ≥ 300 cells were used by RF. R2 = 0.936, RMSE = 0.189 Gy. In all panels, circles represent data points (blood samples), and the line represents theoretically perfect 1:1 correlation.
Figure 6
Figure 6
Visualization of the errors in neutron dose reconstruction by the random forest algorithm on testing data. Each circle represents a blood sample. These data points are the same as those in Fig. 5C, but absolute errors in neutron dose reconstruction are shown by circle size and the photon dose is shown by circle color (black: < 0.4 Gy, brown: 0.4–1 Gy, blue: 1–4 Gy, red: 4–10 Gy, green: > 10 Gy). The dashed line represents theoretically perfect 1:1 correlation.

Similar articles

Cited by

References

    1. Zitnik M, et al. Machine learning for integrating data in biology and medicine: Principles, practice, and opportunities. Inf. Fusion. 2019;50:71–91. doi: 10.1016/j.inffus.2018.09.012. - DOI - PMC - PubMed
    1. Qu K, Guo F, Liu X, Lin Y, Zou Q. Application of machine learning in microbiology. Front. Microbiol. 2019;10:827. doi: 10.3389/fmicb.2019.00827. - DOI - PMC - PubMed
    1. Jones DT. Setting the standards for machine learning in biology. Nat. Rev. Mol. Cell Biol. 2019;20:659–660. doi: 10.1038/s41580-019-0176-5. - DOI - PubMed
    1. Garty G, et al. Mice and the A-bomb: Irradiation systems for realistic exposure scenarios. Radiat. Res. 2017;187:465–475. doi: 10.1667/RR008CC.1. - DOI - PMC - PubMed
    1. Wang Q, et al. Automated triage radiation biodosimetry: Integrating imaging flow cytometry with high-throughput robotics to perform the cytokinesis-block micronucleus assay. Radiat. Res. 2019 doi: 10.1667/RR15243.1. - DOI - PMC - PubMed

Publication types

LinkOut - more resources