. 2021 Feb 17;11(1):4004.
doi: 10.1038/s41598-021-83607-0.

Automated detection of cerebral microbleeds on T2*-weighted MRI

Affiliations

Automated detection of cerebral microbleeds on T2*-weighted MRI

Anthony G Chesebro et al. Sci Rep. .

Abstract

Cerebral microbleeds, observed as small, spherical hypointense regions on gradient echo (GRE) or susceptibility weighted (SWI) magnetic resonance imaging (MRI) sequences, reflect small hemorrhagic infarcts, and are associated with conditions such as vascular dementia, small vessel disease, cerebral amyloid angiopathy, and Alzheimer's disease. The current gold standard for detecting and rating cerebral microbleeds in a research context is visual inspection by trained raters, a process that is both time consuming and subject to poor reliability. We present here a novel method to automate microbleed detection on GRE and SWI images. We demonstrate in a community-based cohort of older adults that the method is highly sensitive (greater than 92% of all microbleeds accurately detected) across both modalities, with reasonable precision (fewer than 20 and 10 false positives per scan on GRE and SWI, respectively). We also demonstrate that the algorithm can be used to identify microbleeds over longitudinal scans with a higher level of sensitivity than visual ratings (50% of longitudinal microbleeds correctly labeled by the algorithm, while manual ratings was 30% or lower). Further, the algorithm identifies the anatomical localization of microbleeds based on brain atlases, and greatly reduces time spent completing visual ratings (43% reduction in visual rating time). Our automatic microbleed detection instrument is ideal for implementation in large-scale studies that include cross-sectional and longitudinal scanning, as well as being capable of performing well across multiple commonly used MRI modalities.


Conflict of interest statement

The authors declare no competing interests.

Figures

Figure 1
Figure 1
Examples of microbleed location. The participant’s MRI shown here reflects a heavy burden of cerebrovascular disease. (A) Left: axial slice of a SWI image, with a microbleed location highlighted in white. Right: an enlarged image of the highlighted location. From top to bottom, the views shown are axial, sagittal, and coronal. (B) Left: axial slice of the same participant’s GRE image, with the same microbleed location highlighted in white. Right: an enlarged image of the highlighted location. From top to bottom, the views shown are axial, sagittal, and coronal.
Figure 2
Figure 2
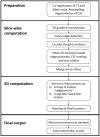
Algorithm flowchart. Summary of the algorithm as described in the text.
Figure 3
Figure 3
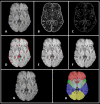
Algorithm Illustration. This image illustrates some of the algorithm steps on an SWI image. (A) Initial SWI image, resampled. (B) 2D gradient computation (gradient magnitude pictured). (C) Edges of the slice as output after Canny edge detection. (D) Initial potential ROIs labeled by the circular Hough transform. (E) ROIs remaining after edge exclusion. (F) ROIs remaining after circular grouping and size exclusion. (G) Final ROI marked after CSF exclusion and multi-slice merging. (H) Co-registered lobar map used to quantify distribution of detected microbleeds.
Figure 4
Figure 4
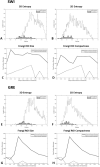
Geometric measure cutoff justifications. This figure illustrates the geometric properties used to remove false positives from the identified locations in SWI and GRE images. Modalities are separated into panels. (A) Distribution of 3D entropy in the ROI neighborhood on SWI. (B) Distribution of the 2D entropy of the maximum intensity projection of the ROI neighborhood on SWI. (C) Number of false positives removed at different cutoffs of the Frangi vesselness measure based on the central blob volume on SWI. (D) Number of false positives removed at different cutoffs of the Frangi vesselness measure based on the central blob compactness on SWI. (E) Distribution of 3D entropy in the ROI neighborhood on GRE. (F) Distribution of the 2D entropy of the maximum intensity projection of the ROI neighborhood on GRE. (G) Number of false positives removed at different cutoffs of the Frangi vesselness measure based on the central blob volume on GRE. (H) Number of false positives removed at different cutoffs of the Frangi vesselness measure based on the central blob compactness on GRE.
Figure 5
Figure 5
Illustration of Frangi-filter threshold effect on blob size and compactness. The dashed lines represent the bounds of the volumes of true positives, while the solid lines represent the bounds of the volumes of false positives. All false positives that fall within the shaded grey areas are removed. The purpose of trying a range of thresholds for vesselness was to determine the points of maximum difference (i.e., where the shaded area is largest, and therefore removes the most false positives). (A) Range of volume of central blobs in Frangi-filtered ROIs on SWI images across different thresholds. (B) Range of central blob compactness in Frangi-filtered ROIs on SWI images across different thresholds. (C) Range of volume of central blobs in Frangi-filtered ROIs on GRE images across different thresholds. (D) Range of compactness of central blobs in Frangi-filtered ROIs on GRE images across different thresholds.

References

    1. Greenberg SM, et al. Cerebral microbleeds: A field guide to their detection and interpretation. Lancet Neurol. 2009;8:165–174. doi: 10.1016/S1474-4422(09)70013-4. - DOI - PMC - PubMed
    1. Martinez-Ramirez S, Greenberg SM, Viswanathan A. Cerebral microbleeds: Overview and implications in cognitive impairment. Alzheimers Res. Ther. 2014;6:33. doi: 10.1186/alzrt263. - DOI - PMC - PubMed
    1. Wiegman AF, et al. Cerebral microbleeds in a multiethnic elderly community: Demographic and clinical correlates. J. Neurol. Sci. 2014;345:125–130. doi: 10.1016/j.jns.2014.07.024. - DOI - PMC - PubMed
    1. Sperling RA, et al. Amyloid related imaging abnormalities (ARIA) in amyloid modifying therapeutic trials: Recommendations from the Alzheimer’s Association Research Roundtable Workgroup. Alzheimers Dement. 2011;7:367–385. doi: 10.1016/j.jalz.2011.05.2351. - DOI - PMC - PubMed
    1. Haller S, et al. Cerebral microbleeds: Imaging and clinical significance. Radiology. 2018;287:11–28. doi: 10.1148/radiol.2018170803. - DOI - PubMed

Publication types