. 2021 May;35(5):1438-1450.
doi: 10.1038/s41375-021-01147-y. Epub 2021 Feb 17.

Characterization of complete lncRNAs transcriptome reveals the functional and clinical impact of lncRNAs in multiple myeloma

Affiliations

Characterization of complete lncRNAs transcriptome reveals the functional and clinical impact of lncRNAs in multiple myeloma

Arantxa Carrasco-Leon et al. Leukemia. 2021 May.

Abstract

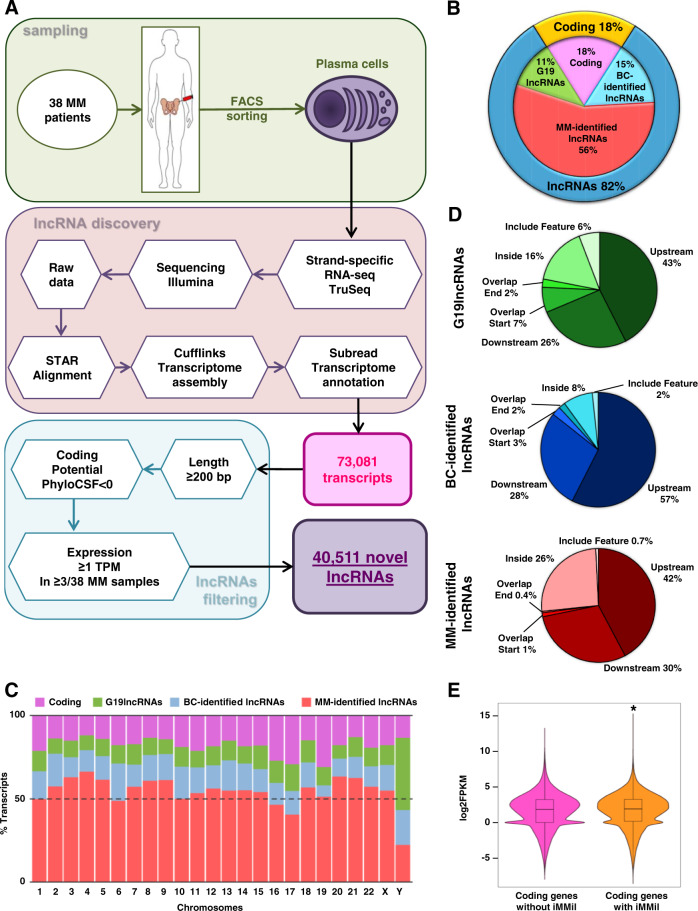
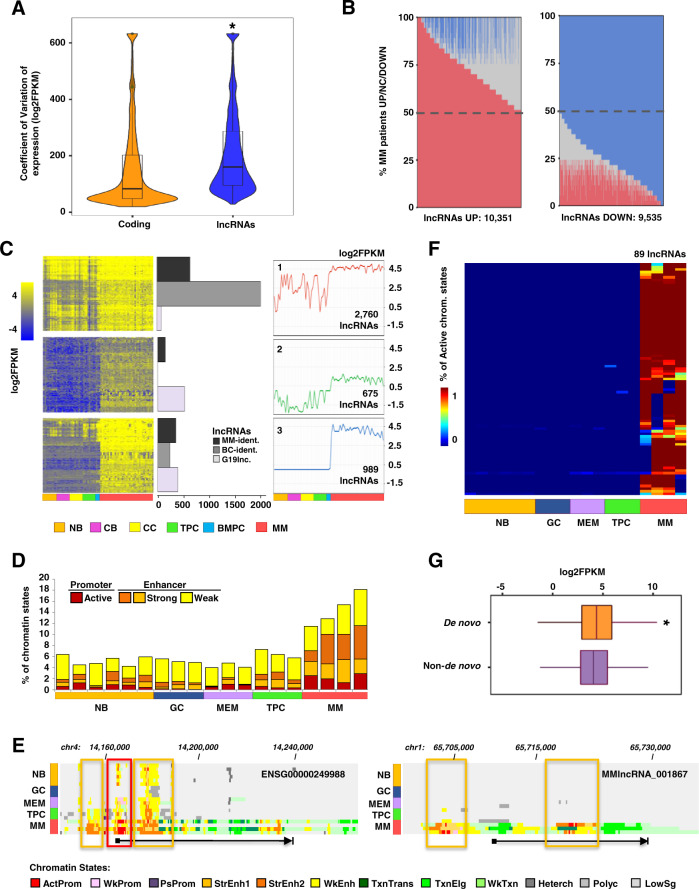
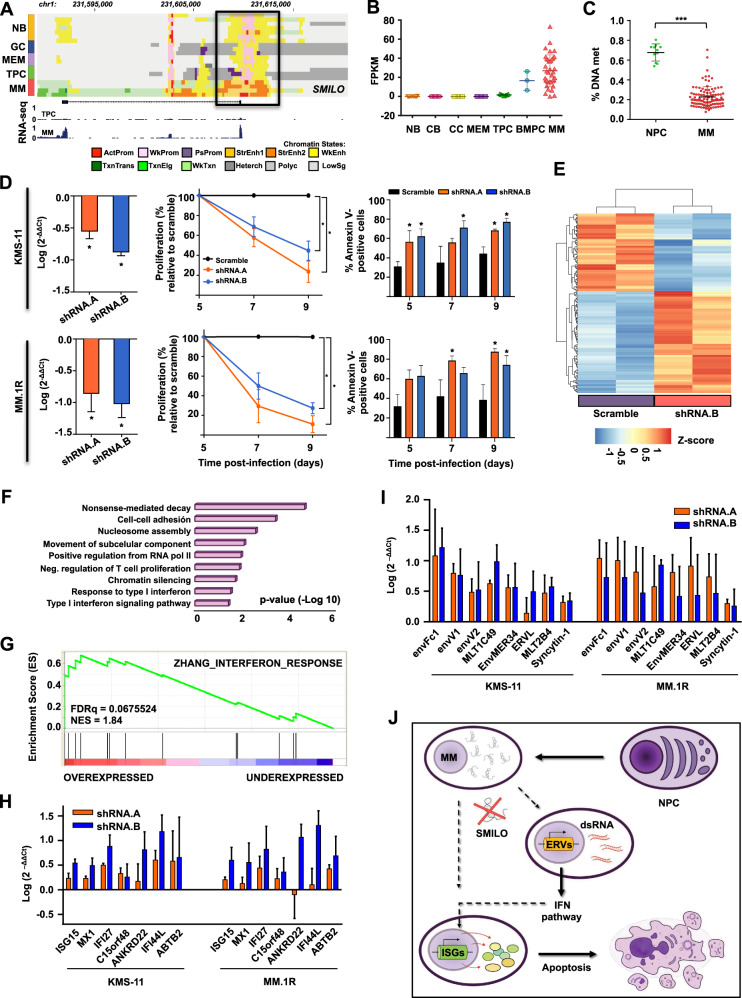
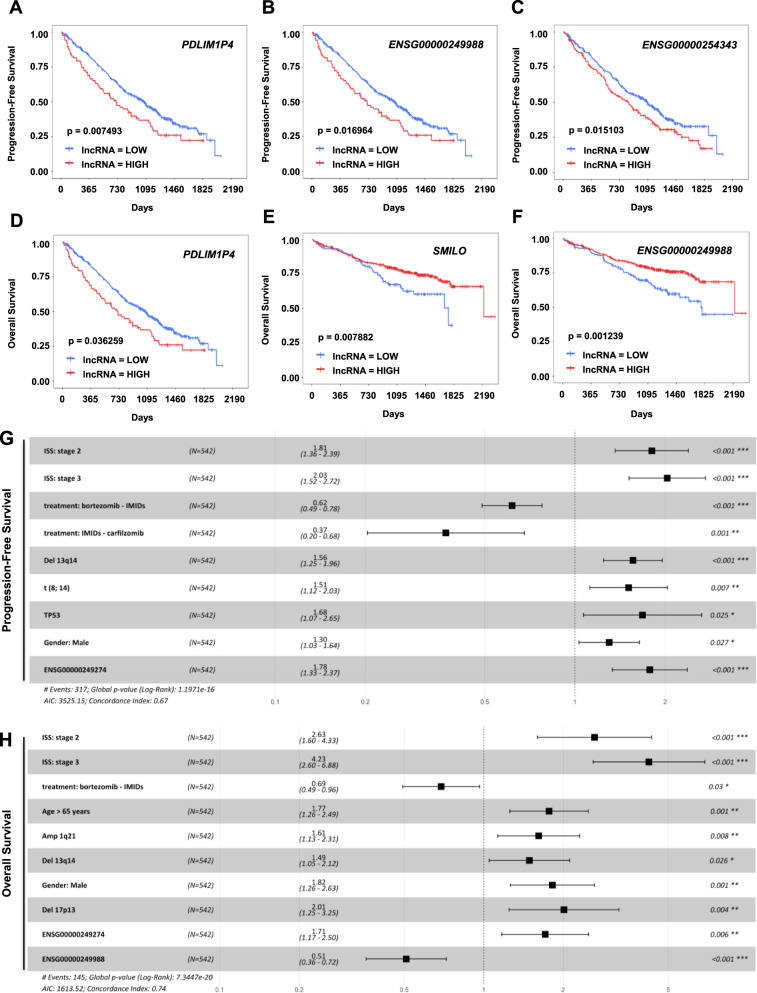
Multiple myeloma (MM) is an incurable disease, whose clinical heterogeneity makes its management challenging, highlighting the need for biological features to guide improved therapies. Deregulation of specific long non-coding RNAs (lncRNAs) has been shown in MM, nevertheless, the complete lncRNA transcriptome has not yet been elucidated. In this work, we identified 40,511 novel lncRNAs in MM samples. lncRNAs accounted for 82% of the MM transcriptome and were more heterogeneously expressed than coding genes. A total of 10,351 overexpressed and 9,535 downregulated lncRNAs were identified in MM patients when compared with normal bone-marrow plasma cells. Transcriptional dynamics study of lncRNAs in the context of normal B-cell maturation revealed 989 lncRNAs with exclusive expression in MM, among which 89 showed de novo epigenomic activation. Knockdown studies on one of these lncRNAs, SMILO (specific myeloma intergenic long non-coding RNA), resulted in reduced proliferation and induction of apoptosis of MM cells, and activation of the interferon pathway. We also showed that the expression of lncRNAs, together with clinical and genetic risk alterations, stratified MM patients into several progression-free survival and overall survival groups. In summary, our global analysis of the lncRNAs transcriptome reveals the presence of specific lncRNAs associated with the biological and clinical behavior of the disease.


Conflict of interest statement

The authors declare that they have no conflict of interest.

Figures

Fig. 1
Fig. 1. Complete characterization of the lncRNAs transcriptome of MM.
A Schematic of the strategy used for ssRNA-seq data processing and for the identification of novel transcripts and lncRNAs in MM patients. B Pie chart representation of transcripts detected and expressed in at least 3 of the 38 MM patients with a minimum expression of 1 TPM. C Cumulative percentage of each type of expressed genes distributed by chromosome. D Pie charts representing the genetic location of G9lncRNAs, BC-identified lncRNAs, and MM-identified lncRNAs. E Graph showing the expression levels of coding genes harboring (right) or not (left) inside MM-identified lncRNAs (iMMil) (p-value = 6.857e−14). MM: multiple myeloma patients, G19lncRNAs: lncRNAs previously annotated in Gencode 19 database, BC-identified lncRNAs: lncRNAs identified in different B-cell subpopulations on our previous work, MM-identified lncRNAs: lncRNAs identified in MM patient samples, iMMil: inside MM-identified lncRNAs.
Fig. 2
Fig. 2. lncRNAs show a heterogeneous and dynamic expression among MM patients.
A Violin plots representing the coefficient of variation of the expression of coding and lncRNA transcripts in all MM samples (p-value < 2.2e−16). B Analysis of expression heterogeneity of lncRNAs in MM patient samples. Barplot of the percentage of MM patients (y axis) that show overexpression (red), downregulation (blue), or no significant changes (gray) for each lncRNAs (x axis). C Expression of lncRNAs from the three transcriptional dynamisms detected along with B-cell differentiation and in MM patient samples. For each dynamism, a heatmap showing the RNA-seq expression of the lncRNAs (left), the number of each type of lncRNA (center), and the centroid (expression average) (right) in normal B-cell subpopulations and MM patient samples are depicted. D Chart depicting the percentage of the length of lncRNAs (y axis) occupied by promoter and enhancer chromatin marks of the 989 lncRNAs from cluster three in normal B-cell subpopulations and MM patient samples. E Genome browser snapshots showing chromatin states of two loci of MM-specific lncRNAs. Red and orange boxes encompass the gain of the active promoter and strong enhancer chromatin marks, respectively, in MM compared to B-cell populations. Each chromatin state is represented by one color. The arrow indicates the length and direction of expression of the lncRNAs. F Heatmap showing de novo activation of lncRNAs in MM. The color scale indicates the percentage of active chromatin sates in the promoter region of each lncRNA. G Box plot representing the expression level of lncRNAs showing de novo active epigenetic marks in MM patients (orange) and those without de novo gain (purple) (p-value = 3.724e−07). CV: coefficient of variation of the expression, MM: multiple myeloma patients, MM-ident.: lncRNAs identified in MM patient samples, BC-ident.: lncRNAs identified in different B-cell subpopulations on our previous work, G19lnc.: lncRNAs previously annotated in Gencode 19 database, NB: naïve, GC: germinal center, CB: centroblast, CC: centrocyte, MEM: memory B-cell, TPC: tonsil plasma cell, BMPC: bone marrow plasma cell, Chr: chromosome, ActProm: active promoter, WkProm: weak promoter, PsProm: poised promoter, StrEnh1: strong enhancer 1, StrEnh2: strong enhancer 2, WkEnh: weak enhancer, TxnTrans: transcription transition, TxnElg: transcription elongation, WkTxn: weak transcription, Heterch: heterochromatin, Polyc: polycomb, LowSg: low signal, De novo: lncRNAs with de novo chromatin active marks, Non-de novo: lncRNAs without de novo chromatin active marks.
Fig. 3
Fig. 3. SMILO is essential for the survival of MM cells.
A Genome browser snapshot showing chromatin states representation and RNA-seq levels of SMILO locus in normal B-cell populations and MM patient samples. The black box indicates the promoter region of SMILO, showing the gain of chromatin active marks such as promoter and strong enhancer marks in MMs. Each chromatin state is represented by one color. B SMILO expression obtained from strand specific RNA-seq data performed in several subpopulations of B-cell differentiation and MM patient samples. FPKM values are shown for each sample. C Percentage of DNA methylation of a CpG (cg08458637) located in the promoter region of SMILO obtained from a DNA methylation array data performed in NPCs and MM patients in our previous study [35]. D Knockdown of SMILO by two different shRNAs in KMS-11 and MM.1R MM cell lines. Levels of SMILO expression were determined by qPCR (left). Gene expression normalized to GUSß is presented relative to that observed in cells infected with a scrambled shRNA. Proliferation curves (center) and the percentage of annexin-V positive cells (right) were detected at the indicated times after infection. Scramble represented in black, shRNA.A in orange and shRNA.B in blue. The average of three independent biological replicates ±SD is shown. E Heatmap showing the RNA-seq data of 194 differentially expressed genes upon SMILO knockdown in KMS-11 cell line. F Gene ontology (GO) analysis showing the top GO terms of the differentially expressed genes after SMILO knockdown in KMS-11 cells. G GSEA plot of the IFN pathway identified comparing KMS-11 cells with or without SMILO knockdown. HI Validation by qPCR of the overexpression of ISGs (H) or ERVs (I) after inhibition of SMILO in KMS-11 and MM.1R cells. Samples were collected after 5 days of infection. Gene expression normalized to GUSß is presented relative to that observed in cells infected with a scrambled shRNA. The average of three independent biological replicates ±SD is shown. J Schematic representation of the putative role of SMILO knockdown in the promotion of MM cell death. Chr: chromosome, NB: naïve, GC: germinal center, MEM: memory B-cell, TPC: tonsil plasma cell, MM: multiple myeloma patient, ActProm: active promoter, WkProm: weak promoter, PsProm: poised promoter, StrEnh1: strong enhancer 1, StrEnh2: strong enhancer 2, WkEnh: weak enhancer, TxnTrans: transcription transition, TxnElg: transcription elongation, WkTxn: weak transcription, Heterch: heterochromatin, Polyc: polycomb, LowSg: low signal, CB: centroblast, CC: centrocyte, BMPC: bone marrow plasma cell, NPC: normal plasma cell, % DNA met: percentage of DNA methylation, FDRq: false discovery rate, NES: normalized enrichment score, ERVs: endogenous retroviruses genes, ISGs: interferon-stimulated genes, IFN pathway: interferon pathway, dsRNA: double-strand RNA.
Fig. 4
Fig. 4. Prognostic value of lncRNAs in MM.
AC Survival analysis of PDLIM1P4, ENSG00000249988, and ENSG00000254343 performed with CoMMpass dataset showing PFS of MM patients. Kaplan–Meier curves represent a bi-level state expression (high and low) of the lncRNA. DF Survival analysis of PDLIM1P4, SMILO, and ENSG00000249988 performed with CoMMpass dataset showing OS of MM patients. GH Multivariate analyses evaluating the significance of the different genetic and clinical factors together with the expression of PDLIM1P4 in PFS (G), and PDLIM1P4, and ENSG00000249988 in OS (H), respectively. LOW: low expression of the lncRNA, HIGH: high expression of the lncRNA.

References

    1. Laubach JP, Richardson PG, Anderson KC. The evolution and impact of therapy in multiple myeloma. Med Oncol. 2010;27:S1–6. - PubMed
    1. Dimopoulos K, Gimsing P, Grønbæk K. The role of epigenetics in the biology of multiple myeloma. Blood Cancer J. 2014;4:e207. - PMC - PubMed
    1. Zhuang W, Ge X, Yang S, Huang M, Zhuang W, Chen P, et al. Upregulation of lncRNA MEG3 promotes osteogenic differentiation of mesenchymal stem cells from multiple myeloma patients by targeting BMP4 transcription. Stem Cells. 2015;33:1985–97. - PubMed
    1. Hauptman N, Glavač D. Long non-coding RNA in cancer. Int J Mol Sci. 2013;14:4655–69. - PMC - PubMed
    1. Ghidini M, Braconi C. Non-coding RNAs in primary liver cancer. Front Med. 2015;2:36. - PMC - PubMed

Publication types

MeSH terms

Substances