. 2021 Mar;591(7848):157-161.
doi: 10.1038/s41586-021-03230-x. Epub 2021 Feb 17.

Structure and inhibition mechanism of the human citrate transporter NaCT

Affiliations

Structure and inhibition mechanism of the human citrate transporter NaCT

David B Sauer et al. Nature. 2021 Mar.

Abstract

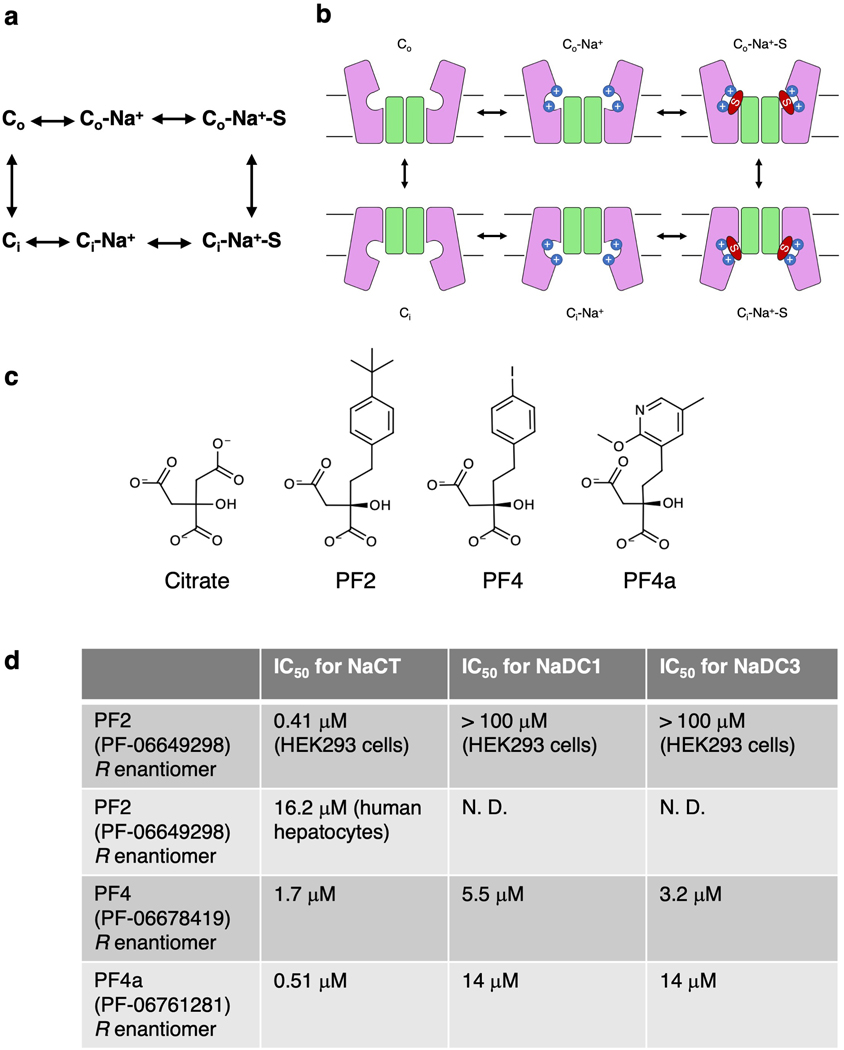
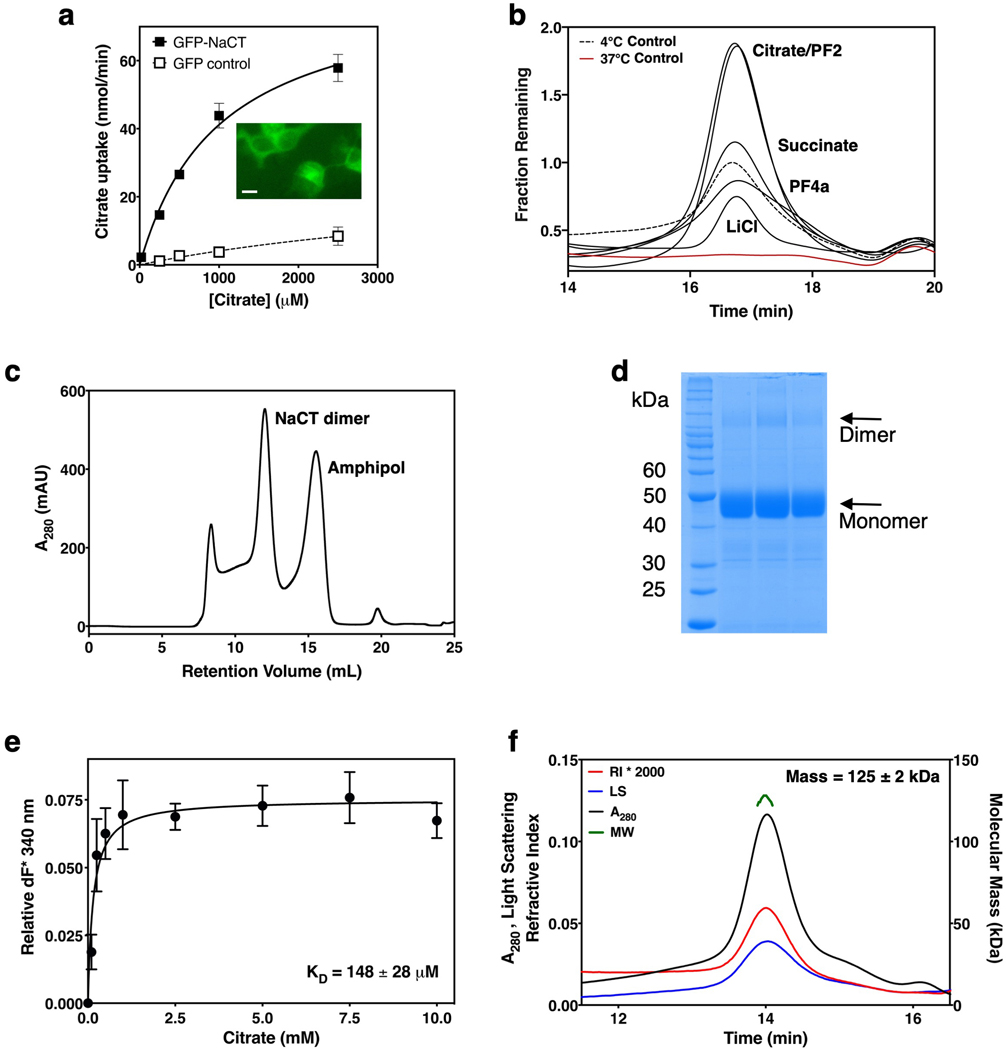
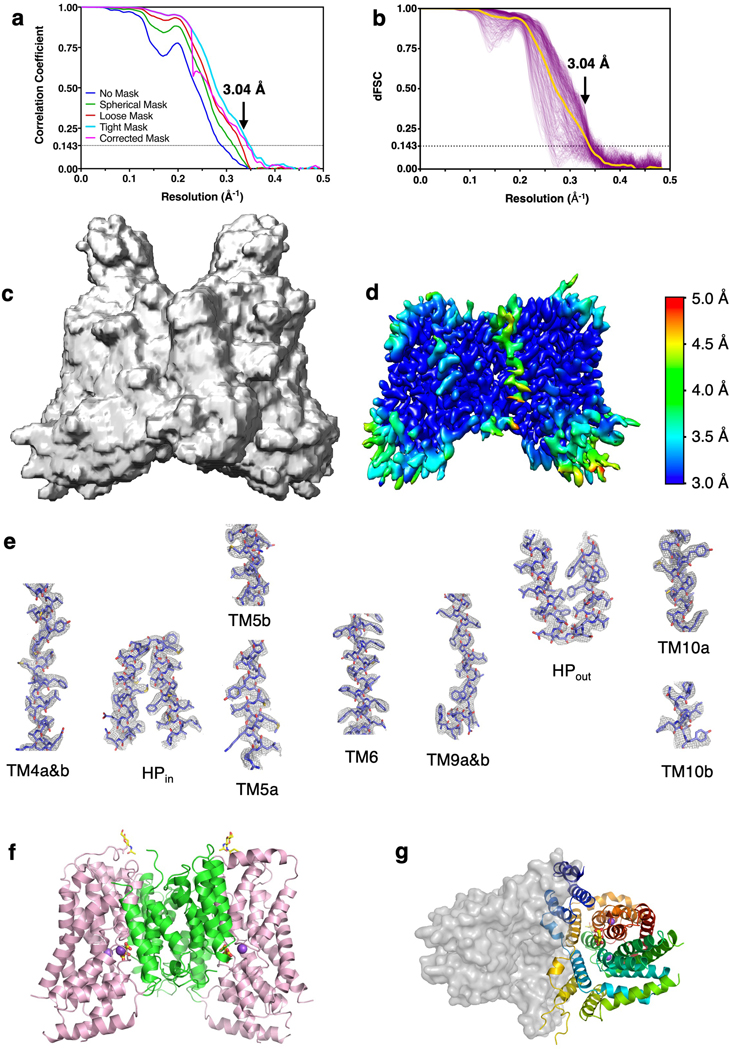
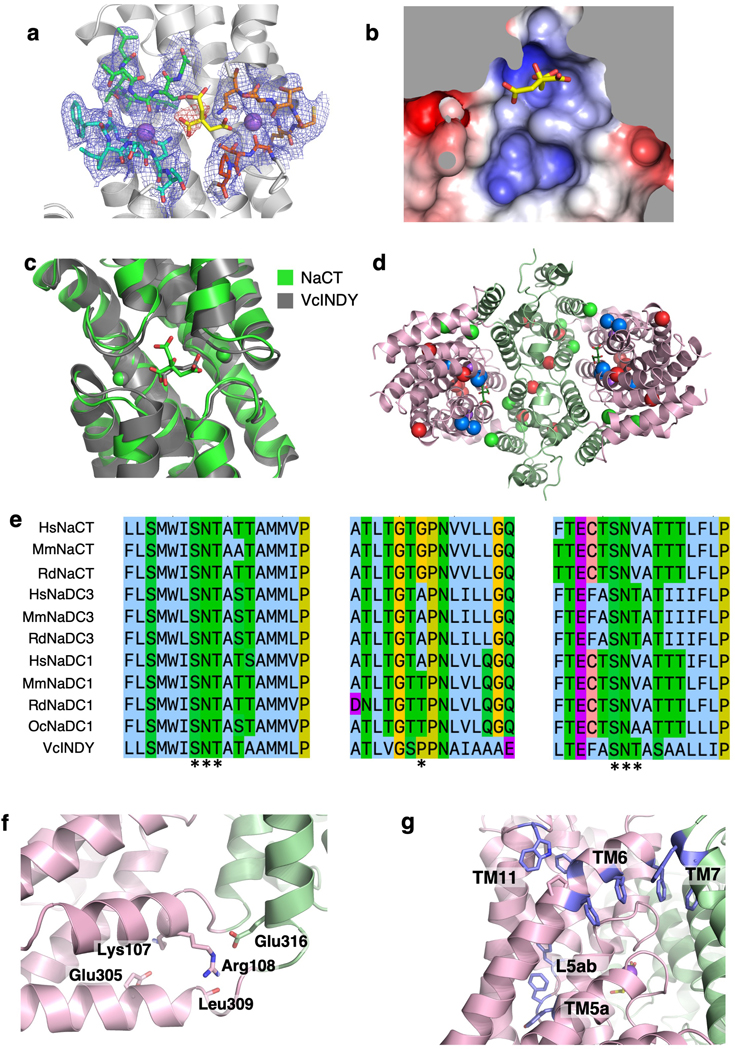
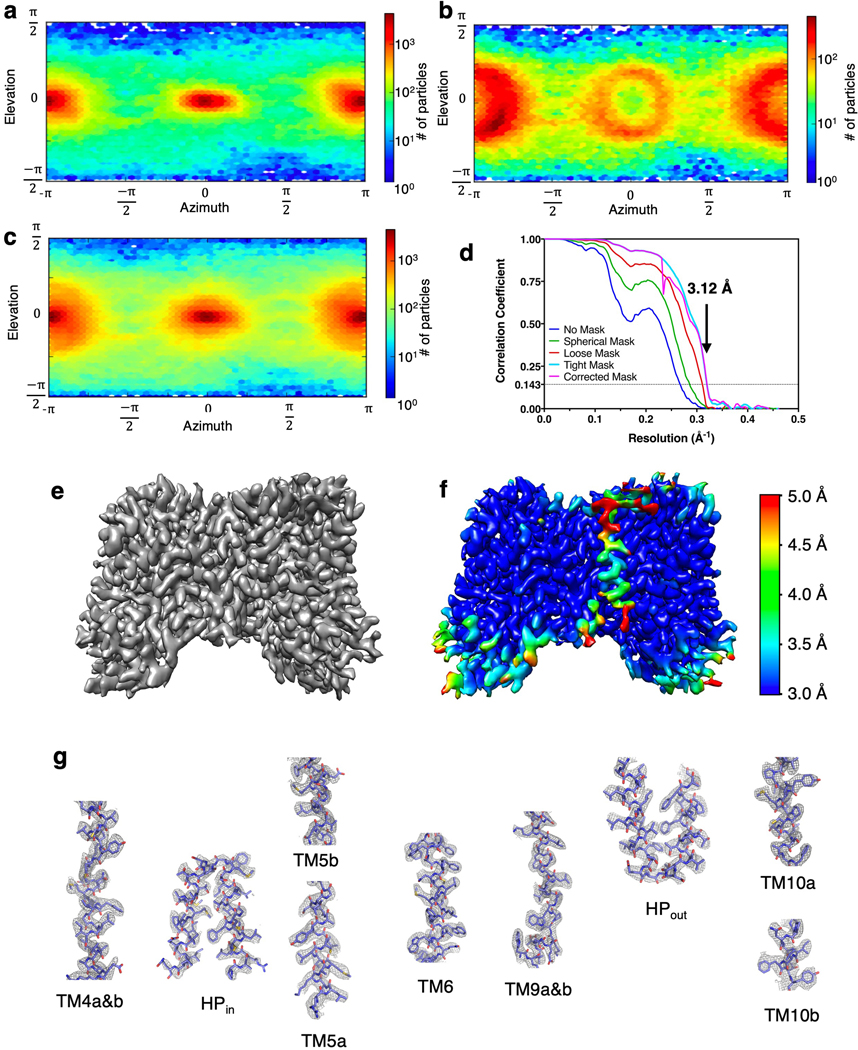
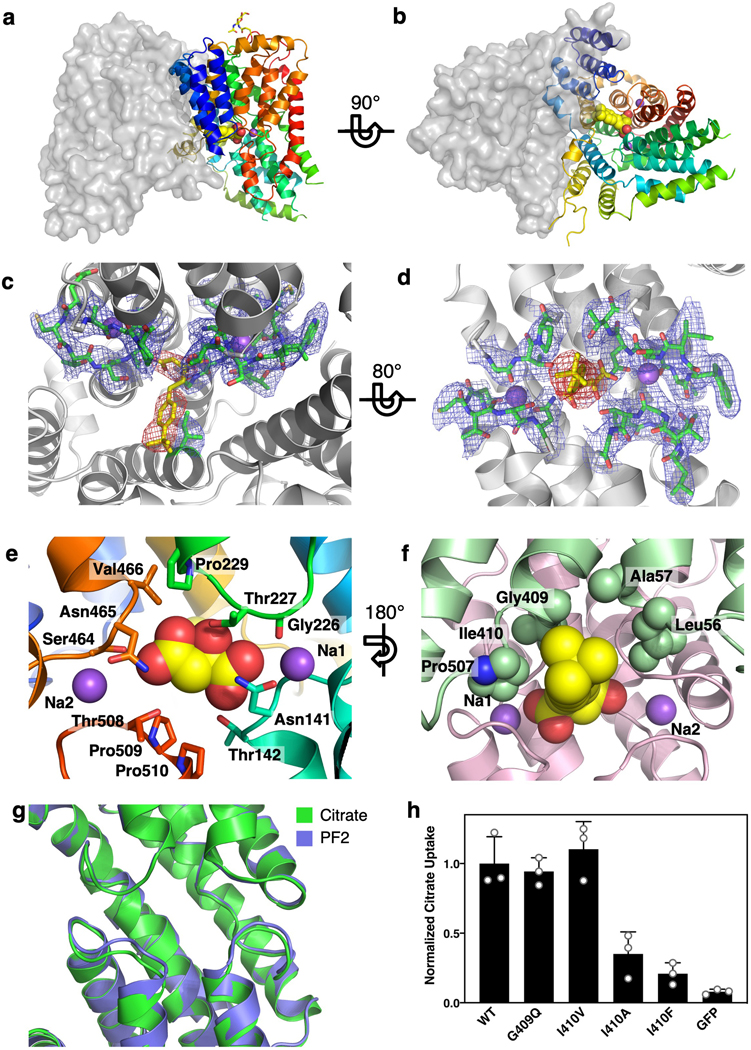
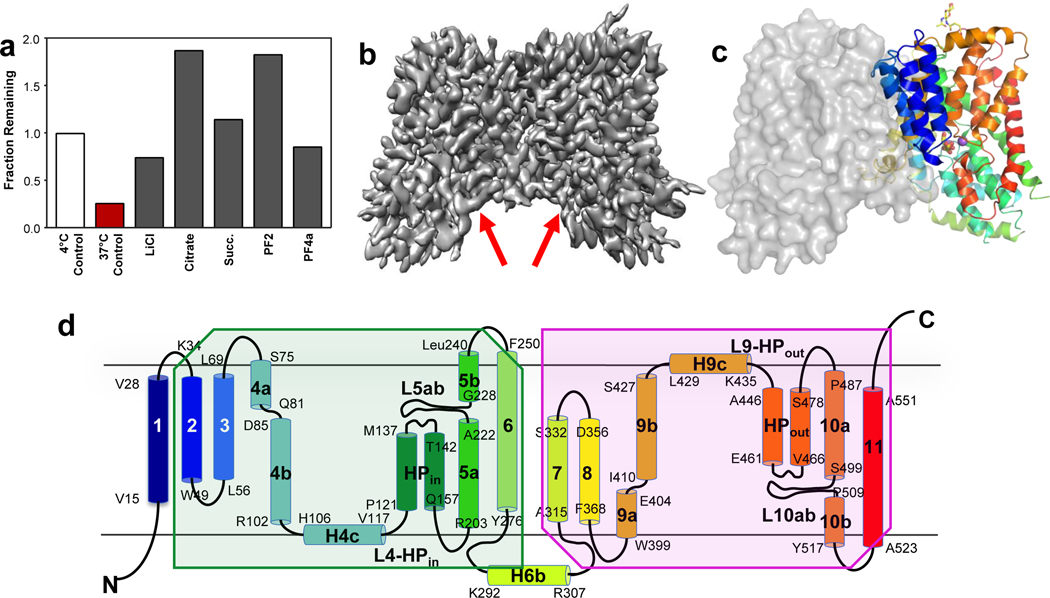
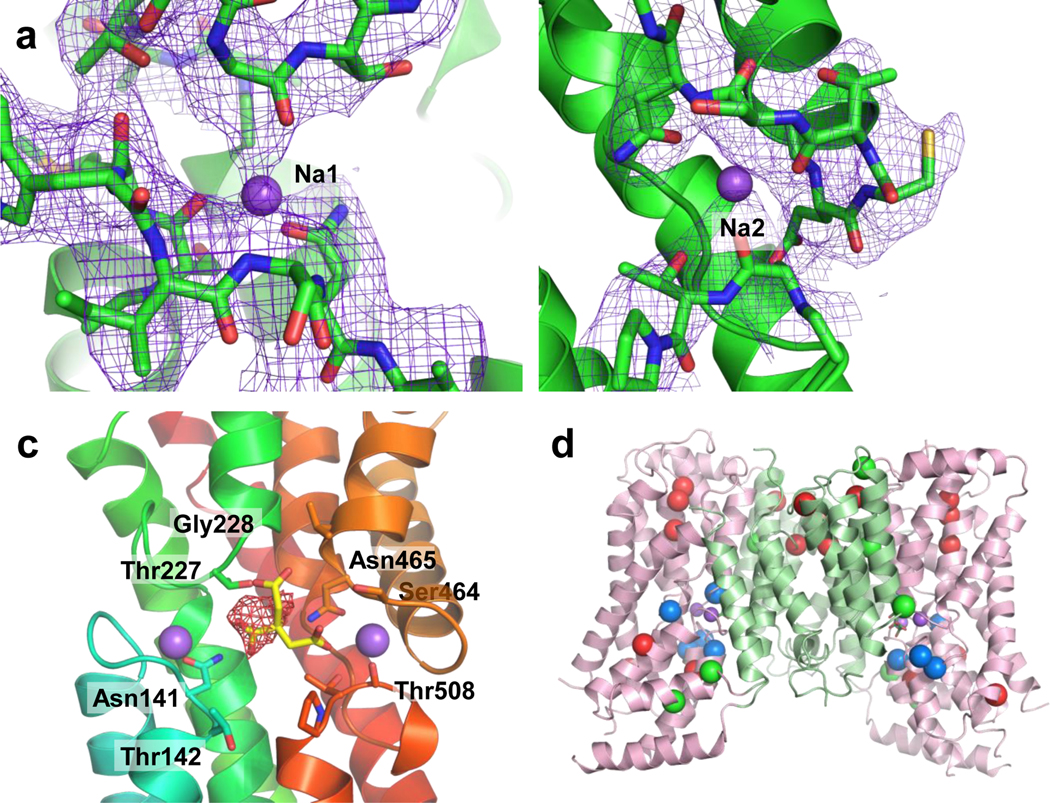
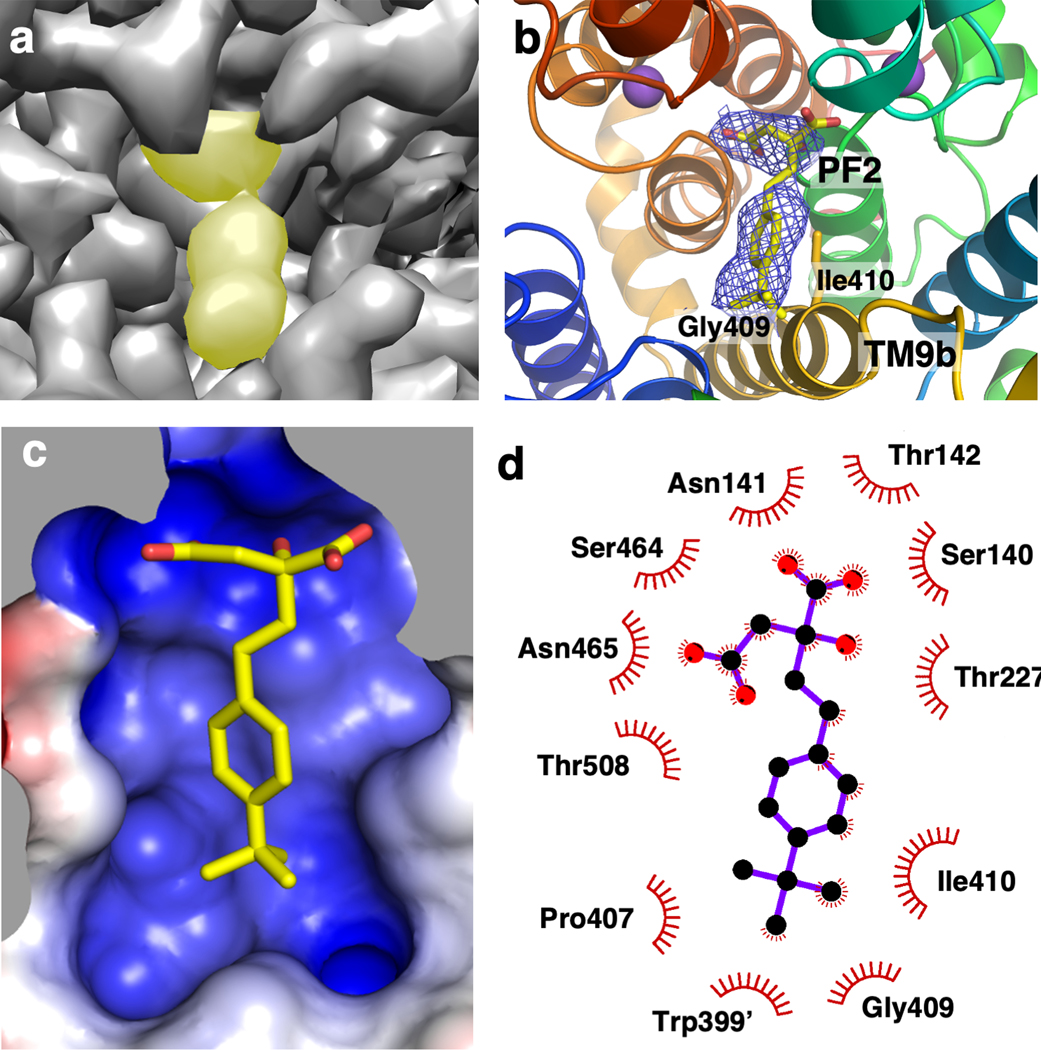
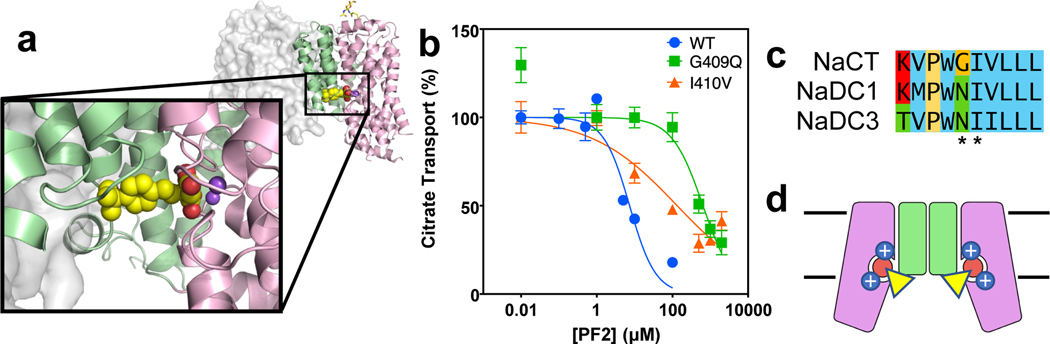
Citrate is best known as an intermediate in the tricarboxylic acid cycle of the cell. In addition to this essential role in energy metabolism, the tricarboxylate anion also acts as both a precursor and a regulator of fatty acid synthesis1-3. Thus, the rate of fatty acid synthesis correlates directly with the cytosolic concentration of citrate4,5. Liver cells import citrate through the sodium-dependent citrate transporter NaCT (encoded by SLC13A5) and, as a consequence, this protein is a potential target for anti-obesity drugs. Here, to understand the structural basis of its inhibition mechanism, we determined cryo-electron microscopy structures of human NaCT in complexes with citrate or a small-molecule inhibitor. These structures reveal how the inhibitor-which binds to the same site as citrate-arrests the transport cycle of NaCT. The NaCT-inhibitor structure also explains why the compound selectively inhibits NaCT over two homologous human dicarboxylate transporters, and suggests ways to further improve the affinity and selectivity. Finally, the NaCT structures provide a framework for understanding how various mutations abolish the transport activity of NaCT in the brain and thereby cause epilepsy associated with mutations in SLC13A5 in newborns (which is known as SLC13A5-epilepsy)6-8.


Conflict of interest statement

Competing interests

The authors declare no competing interest

Figures

Extended Data Fig. 1.
Extended Data Fig. 1.. Kinetic cycle of NaCT and molecular structures of its substrates and inhibitors.
a, Kinetic cycle and, b, schematic model of the SLC13 transport cycle cycle. Co: outward-facing conformation; Ci: inward-facing conformation; S: substrate. The number of co-transported Na+ for different SLC13 transporters varies between 3 and 4, but only two are shown here. All available biochemistry evidence indicates that sodium ions bind before and release after the substrate. c, Molecular structures of the NaCT substrate, citrate, and various inhibitors. d, Inhibitory concentrations (IC50) of inhibitors for NaCT and the dicarboxylate transporters NaDC1 and NaDC3 . Whereas PF2 is highly selective towards NaCT, PF4 and PF4a inhibit all three human di-/tricarboxylate transporters.
Extended Data Fig. 2.
Extended Data Fig. 2.. Purification and functional characterization of human NaCT.
a, Michaelis-Menten plot showing the citrate dependence of Na+-driven radioactive citrate uptake into HEK293 cells that expressed EGFP-NaCT. HEK293 cells transfected with a EGFP vector were used as a control. All points include 6 biological replicates from two independent experiments, with error bars indicating the standard deviation. Insert: Representative confocal image of HEK293 cells transfected with the EGFP-NaCT construct, from four biological replicates. Scale bar indicates 10 μm. b, Analytical fluorescence size-exclusion chromatography (FSEC) of detergent-solubilized cell lysate of Hi5 cells overexpressing an EGFP-NaCT construct. Peak height represents the protein concentration, while the peak sharpness indicates the protein homogeneity. The cell lysate was solubilized in DDM detergent, incubated with various compounds at 37 °C, and loaded onto an analytical SEC column on HPLC. c, Preparative size-exclusion chromatography (SEC) of NaCT following Ni2+-NTA affinity purification. d, Representative SDS-PAGE of purified NaCT, from twenty biological replicates. Source data are provided as a Source Data file. e, NaCT binding to citrate in detergent solution as measured by tryptophan fluorescence quenching. All points include three biological replicates, with error bars indicating the standard deviation. The Kd was found to be 148 ± 28 mM. f, Molecular mass measurements of DDM-purified NaCT using multiangle light scattering. The measured mass of 125 ± 2 kDa agrees with the molecular weight of a dimeric NaCT of 126.124 kDa calculated from the protein sequence.
Extended Data Fig. 3.
Extended Data Fig. 3.. Characterization of the NaCT-citrate cryo-EM specimens and flow chart of image processing.
a, Violin plot showing the distribution of ice thickness in electron micrographs from specimens tilted at 0°, 20°, 40° and 50°. The plot widths correspond to ice thickness distribution. Theoretically, the ice thickness at 20°, 40° and 50° tilts would increase from 0° by 6%, 30% and 56%, respectively. The actual number of electron micrographs with ultra thin ice (5 nm – 20 nm) decreased significantly with the tilt angle. b, Violin plot showing the distribution of the average horizontal particle displacements from the first five frames of each electron micrograph. The beam-induced particle displacements increased with the tilt angle. c, Violin plot showing the distribution of micrograph CTF fit resolution of the micrographs. The image quality dramatically deteriorated for those recorded from 50° tilted specimens. d, Flow chart of image processing of the NaCT-citrate images. Only images collected from specimens tilted at 0°, 20° and 40° were included in the processing and the generation of the finals maps.
Extended Data Fig. 4.
Extended Data Fig. 4.. Cryo-EM data collection from 0°, 20° and 40° tilted specimens and image processing of the NaCT-citrate complex.
a, Orientation distribution of particles from a NaCT-citrate complex reconstruction using only particles from 0° tilt micrographs. At 0° sample tilt most of the particles are top views (viewed along the membrane normal). Side views (viewed from within the membrane plane) are relatively rare. The number of side views and top views differ at three orders of magnitude, indicating a serious degree of preferred orientation. Orientation distribution of particles from a NaCT-citrate complex reconstruction using particles from, b, 40° specimen tilt and, c, all micrographs at 0°, 20° and 40° specimen tilts. With tilting the orientation distribution of particles becomes much more isotropic, alleviating the preferred orientation problem. The 30 most populous classes from 2D classification of particles from the, d, 0° and, e, 40° tilted specimens. The 0° classes are dominated by top-views, with few side- and oblique-views. In contrast, the 40° micrographs include clear side- and oblique-view classes.
Extended Data Fig. 5.
Extended Data Fig. 5.. Structure determination of NaCT-citrate complex.
a, Cryo-EM map Fourier shell coefficient curve of the NaCT-citrate complex reconstruction using all micrographs. Arrows indicate the nominal map resolution of 3.04 Å, based on a FSC = 0.143 threshold. b, Directional Fourier shell correlation curves of the NaCT-citrate complex reconstruction. Each purple trace is an individual FSC calculated from a conical wedge of the overall spherical shell, sampled on a 500-point Fibonacci spherical grid. The global FSC curve (the yellow trace), as calculated by averaging all directional FSC curves, also indicates a resolution of 3.04 Å. c, Mask used for refinement using cryoSPARC. d, Local resolution of the map. e, Exemplary cryo-EM densities showing the quality of the NaCT-citrate model’s chain tracing. All the key helices that are involved in citrate and sodium ion binding are shown. The density for peripheral helix TM1 is poorly resolved, with the helix loosely attached to the rest of the protein. f, Model of NaCT dimer. The scaffold domain and the transport domain in each protomer is colored green and pink, respectively. g, Model of the NaCT protomer as viewed from the cytosol. C1 symmetry was used for the image reconstruction and model refinement. The two protomers are identical, with an r.m.s.d. of 0.002 Å.
Extended Data Fig. 6.
Extended Data Fig. 6.. Features of the NaCT-citrate structure.
a, Cryo-EM density map around the citrate binding sites. All the densities are shown at the same contour levels. The density for citrate is colored red. b, Electrostatic surface of the citrate binding site. The sodium ions at Na1 and Na2 were included in the calculations. c, Overlay of the NaCT-citrate and VcINDY-succinate (5UL7) structures, along with their respective substrates, shown in green and grey, respectively. d, Locations of the SLC13A5-Epilepsy missense mutations within the NaCT structure as viewed the cytosol. e, Sequence alignments of the first SNT motif (left), L5ab – TM5b (center), and second SNT motif (right) from SLC13 family proteins and bacterial homologs. The second SNT motif in NaCT has a sequence of Ser-Asn-Val. f, Interaction of Lys107 and Arg108 on H4c with other residues on H6b and TM7. g, Aromatic clusters near TM6.
Extended Data Fig. 7.
Extended Data Fig. 7.. Cryo-EM data collection from tilted specimens and reconstruction FSC curve of the NaCT-PF2 complex.
a, Orientation distribution of particles from a NaCT-PF2 complex reconstruction using only particles from images of 0° tilt specimens. At 0° sample tilt most of the particles are top views, while side views are relatively rare. The number of side views and top views differ by up to three orders of magnitude, indicating a serious degree of preferred orientation. Orientation distribution of particles from a NaCT-PF2 complex reconstruction using particles from, b, 40° tilt and, c, all micrographs collected at 0°, 20° and 40° tilts. With tilting the particle views become much more isotropic, alleviating the preferred orientation problem. d, Cryo-EM map Fourier shell correlation curve of the NaCT-PF2 complex reconstruction using all micrographs. e, Cryo-EM map of the NaCT-PF2 complex to 3.12 Å resolution. f, Local resolution of the map. g, Exemplary cryo-EM densities showing the quality of the NaCT-PF2 model’s chain tracing. All the key helices that are involved in PF2 and sodium ion binding are shown.
Extended Data Fig. 8.
Extended Data Fig. 8.. Map and structural model of the NaCT-PF2 complex.
Structure of the NaCT-PF2 complex as viewed from, a, the membrane plane and, b, the cytosol. c&d, Cryo-EM density map around the PF2 binding sites. All the densities are shown at the same contour levels. The density for PF2 is colored red. e, PF2 binding site as viewed from within the transport domain. f, Packing of scaffold domain side chains around PF2. The scaffold and transport domains are colored green and pink, respectively. Residues Leu56, Ala57, Gly409 and Ile410 are shown as spheres. g, Overlay of the NaCT-citrate and NaCT-PF2 structures in green and blue, respectively. The loops enclosing Na1 and Na2 sodium binding sites move by ~1 Å, more tightly enclosing both sites in the NaCT-PF2 complex. h, Na+-driven citrate uptake into HEK293 cells transfected with various EGFP-tagged NaCT mutants. Each point includes three biological replicates, with error bars indicating the standard deviation. G409Q and I410V mutants retained wildtype level activity and were used to measure inhibition by PF2 in Fig 4b.
Fig. 1.
Fig. 1.. Biochemical characterization and structure determination of human NaCT.
a, Thermostabilization of NaCT by various compounds. Residual fluorescence (fractional fluorescence that remains after 37°C thermal stress) of EGFP-NaCT after incubation with substrates and ligands. b, Cryo-EM map of NaCT-citrate at 3.04 Å resolution. Arrows indicate the Na+ and citrate binding sites. c, NaCT-citrate dimer structure viewed from within the membrane plane. The citrate is shown as sticks and the two Na+ ions are shown as purple balls. d, Transmembrane topology of NaCT. The beginning and end of each helix are numbered. Shaded regions indicate the inverted repeats of the protein.
Fig. 2.
Fig. 2.. Na+ and substrate binding sites in human NaCT and mapping of mutations that cause SLC13A5-Epilepsy.
The, a, Na1, b, Na2, c, and citrate binding sites. Columbic potential maps are shown in mesh. The calculated valence of Na1 and Na2 is 2.3 and 0.6 respectively in the NaCT-citrate complex, and 0.5 and 0.8 in the NaCT-PF2 complex, indicating reasonable coordination for sodium ions. d, Locations of the SLC13A5-Epilepsy missense mutations within the NaCT structure as viewed from the membrane plane. We hypothesize that Type Ib mutations (red) affect NaCT protein stability or folding, Type IIa mutations (blue) hinder substrate or Na+ binding, and Type IIb mutations (green) block conformational changes of the transport domain needed for substrate transport.
Fig. 3.
Fig. 3.. PF2 binding site in human NaCT.
a, Cryo-EM map in surface representation of the PF2 binding site at 3.12 Å resolution. The density for the PF2 molecule is indicated in yellow. b, The PF2 binding site structure. Columbic potential map is shown in mesh. The isobutyl group of PF2 interacts with Gly409 and Ile410 from the N-terminus of TM9b of the scaffold domain. c, PF2 binding site shown as electrostatic surface, colored by electrostatic potential of the protein atomic model. d, Contact map for PF2’s interactions with residues of NaCT within 4.2 Å.
Fig. 4.
Fig. 4.. Inhibition mechanism of PF2.
a, PF2 binding site viewed from within the membrane. The dicarboxylate moiety of PF2 binds at the citrate site in the transport domain (pink), whereas PF2’s benzene ring and isobutyl group interact with the scaffold domain (green) of NaCT. b, Transport activity and PF2 inhibition measurements of NaCT and mutants in HEK293 cells. The IC50 of PF2 to the wildtype protein is 5 μM, while for the G409Q and I410V mutants, the IC50 has increased to 300 μM and 20 μM, respectively (N = 6, error bars as SEM). c, Sequence alignment of the human SLC13 transporters. Positions of the two residues in NaCT that interact with the isobutyl group of PF2 are indicated. The equivalent of NaCT’s Gly409 is asparagine in both NaDC3 and NaDC1. d, Schematic drawing showing the proposed inhibition mechanism of PF2. The dicarboxylate moiety of PF2 (circle) binds to the citrate site of NaCT in its inward-facing, Ci-Na+-S state, and blocks sodium release from the Na1 and Na2 sites. At the same time, the modified benzene ring of PF2 (triangle) interacts with the scaffold domain, preventing the transition of the transport domain to an outward-facing conformation. Together, the two types of interactions arrest the transporter in its Ci-Na+-S state and inhibit transport.

Similar articles

Cited by

References

    1. Spencer AF & Lowenstein JM, Supply of precursors for synthesis of fatty acids. J Biol Chem 237, 3640–3648 (1962). - PubMed
    1. Ruderman NB, Saha AK, Vavvas D, & Witters LA, Malonyl-CoA, fuel sensing, and insulin resistance. Am J Physiol-Endoc M 276, E1–E18 (1999). - PubMed
    1. Sul HS & Smith S, Fatty acid synthesis in eukaryotes in Biochemistry of Lipids, Lipoproteins and Membranes, edited by Vance DE & Vance JE (Elsevier, New York, 2008), pp. 155–190.
    1. Fang M. & Lowenstein JM, Citrate and the conversion of carbohydrate into fat. The regulation of fatty acid synthesis by rat liver extracts. Biochem J 105, 803–811 (1967). - PMC - PubMed
    1. Shrago E, Spennetta T, & Gordon E, Fatty acid synthesis in human adipose tissue. J Biol Chem 244, 2761–2766 (1969). - PubMed

Additional references

    1. Law CJ, Yang Q, Soudant C, Maloney PC, & Wang DN, Kinetic evidence is consistent with the rocker-switch mechanism of membrane transport by GlpT. Biochemistry 46, 12190–12197 (2007). - PMC - PubMed
    1. Law CJ, Enkavi G, Wang DN, & Tajkhorshid E, Structural basis of substrate selectivity in the glycerol-3-phosphate:phosphate antiporter. Biophys J 97, 1346–1353 (2009). - PMC - PubMed
    1. Slotboom DJ, Duurkens RH, Olieman K, & Erkens GB, Static light scattering to characterize membrane proteins in detergent solution. Methods 46, 73–82 (2008). - PubMed
    1. Waight AB, Love J, & Wang DN, Structure and mechanism of a pentameric formate channel. Nature structural & molecular biology 17, 31–37 (2010). - PMC - PubMed
    1. Kendrick BS, Kerwin BA, Chang BS, & Philo JS, Online size-exclusion high-performance liquid chromatography light scattering and differential refractometry methods to determine degree of polymer conjugation to proteins and protein-protein or protein-ligand association states. Anal Biochem 299, 136–146 (2001). - PubMed

Publication types

MeSH terms