. 2021 Feb;590(7847):660-665.
doi: 10.1038/s41586-021-03193-z. Epub 2021 Feb 17.

Loop extrusion as a mechanism for formation of DNA damage repair foci

Affiliations

Loop extrusion as a mechanism for formation of DNA damage repair foci

Coline Arnould et al. Nature. 2021 Feb.

Abstract

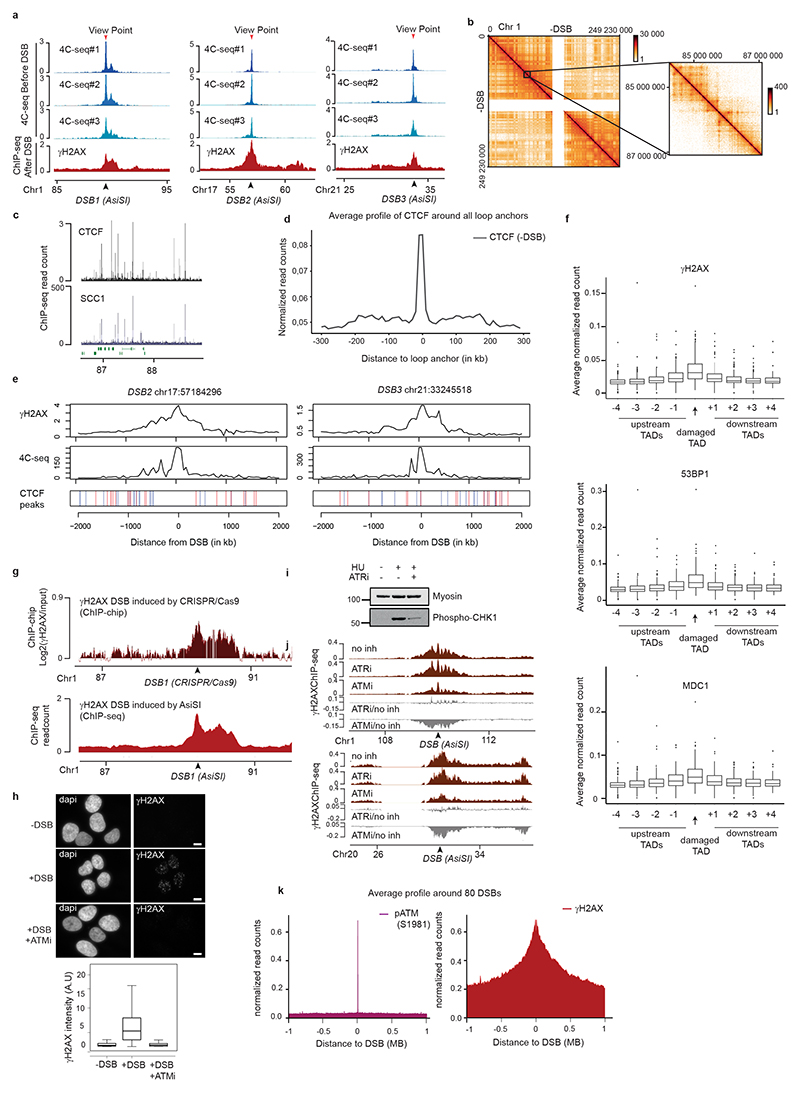
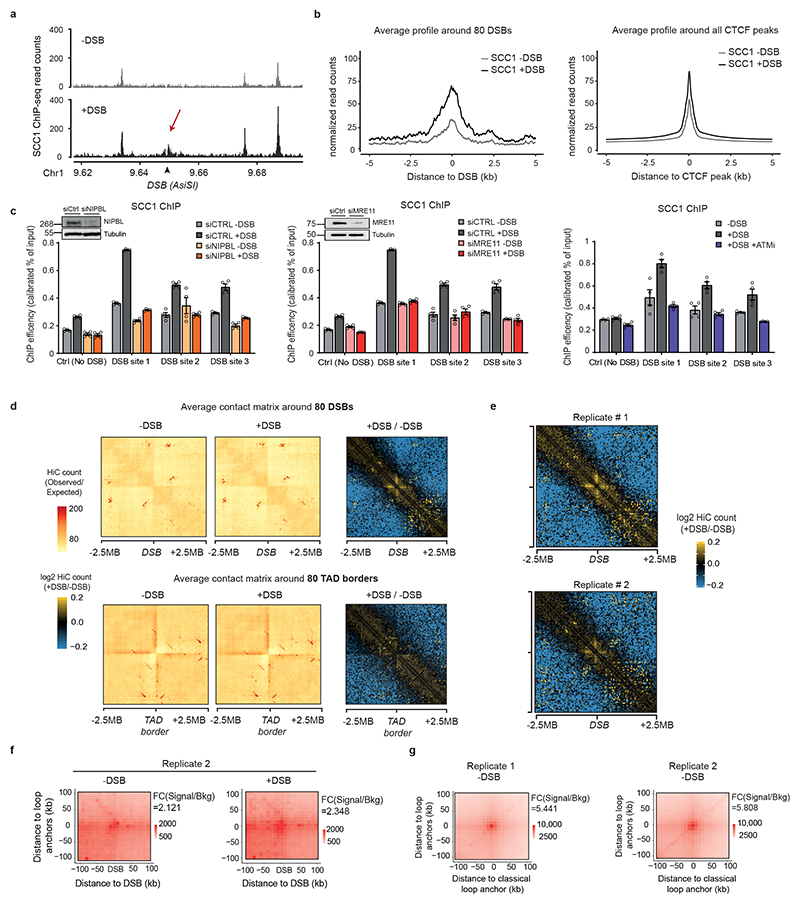
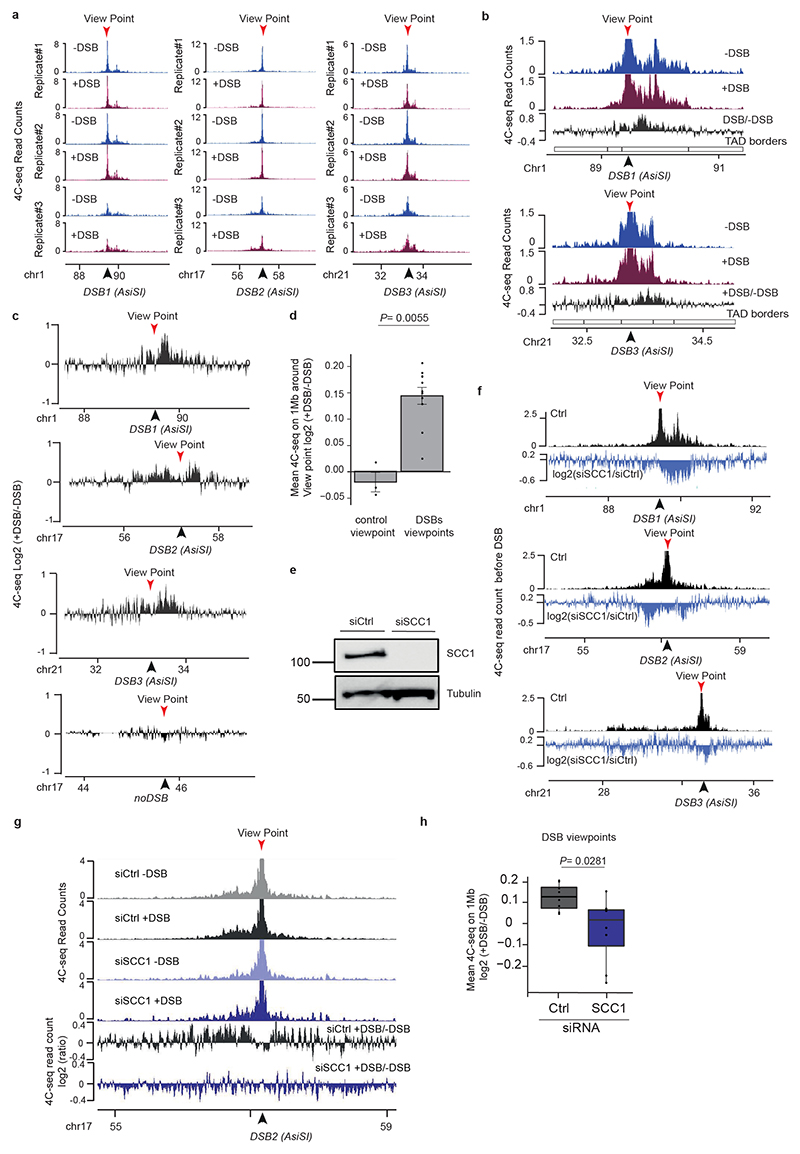
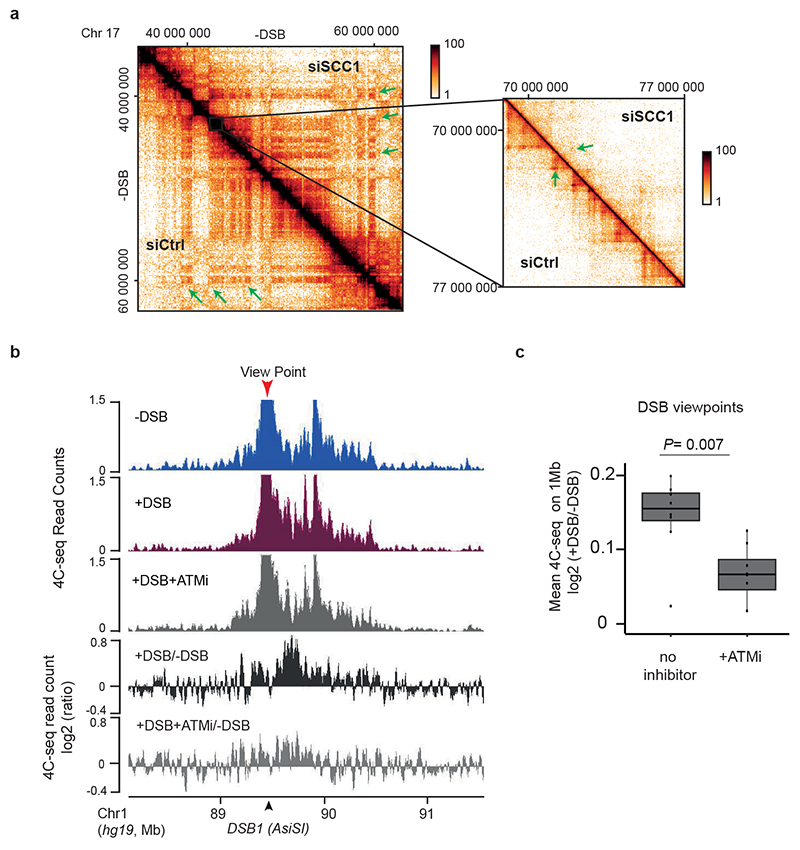
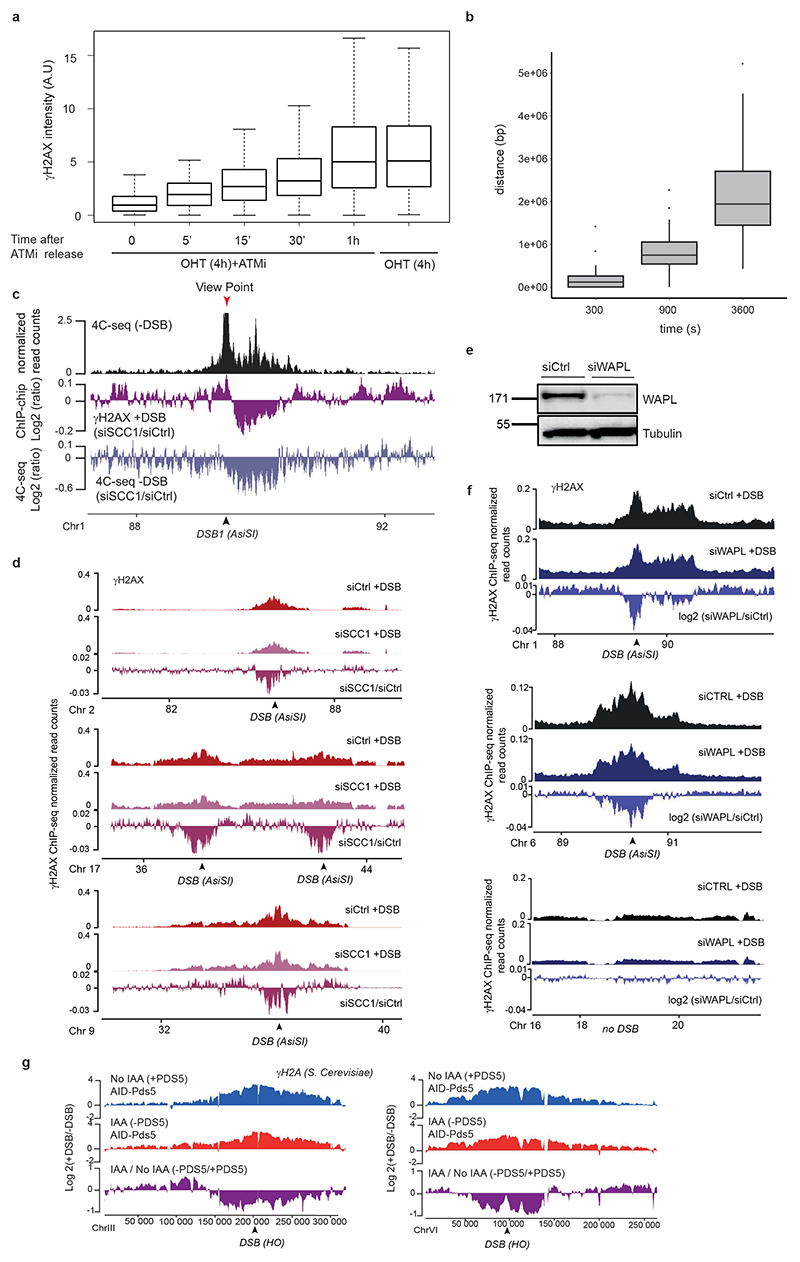
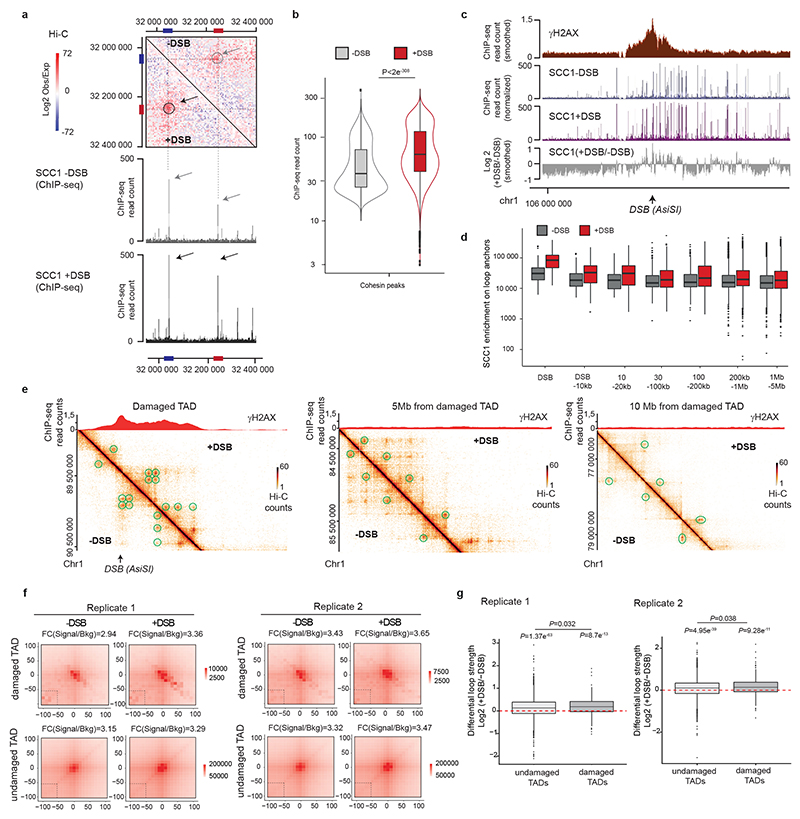
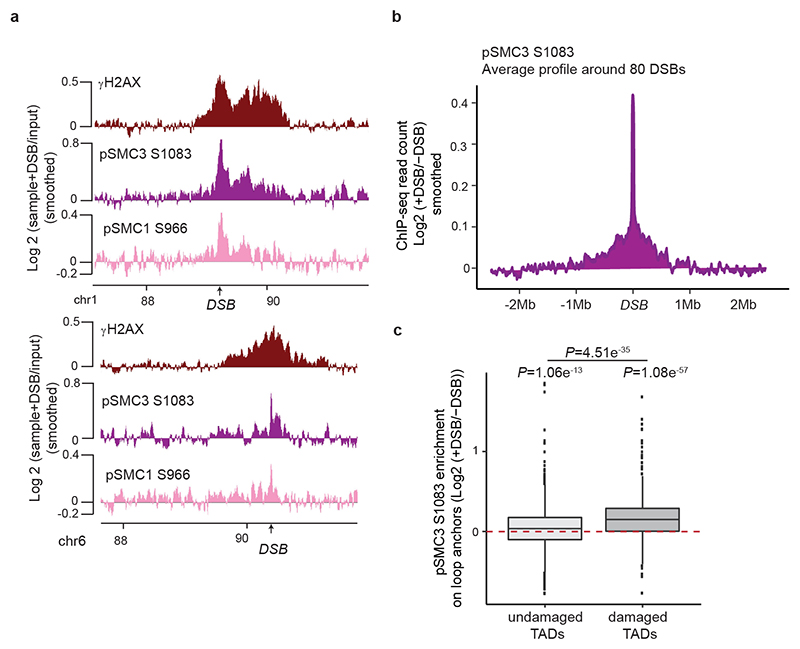
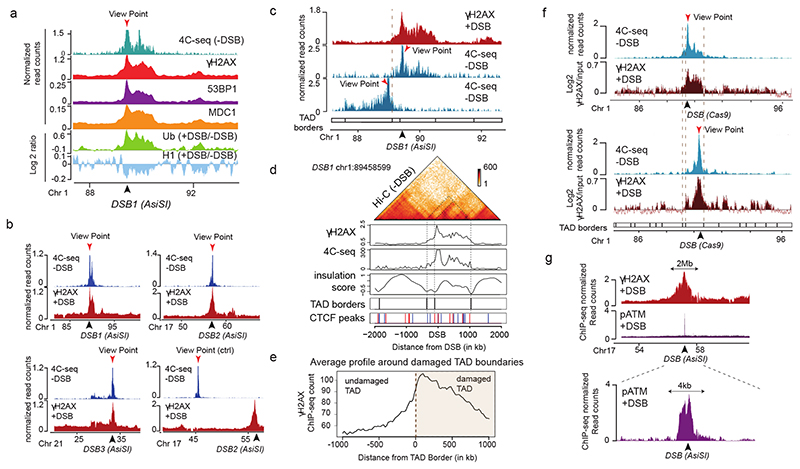
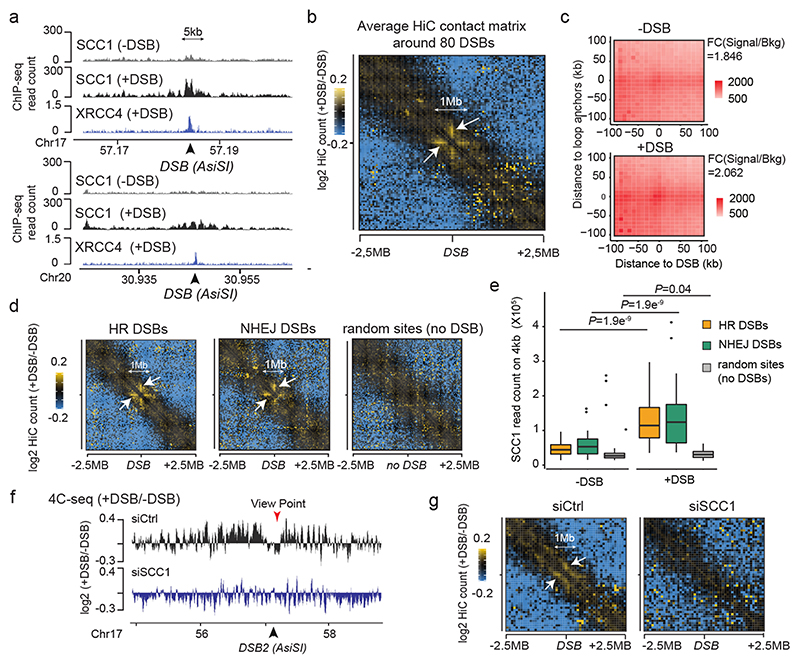
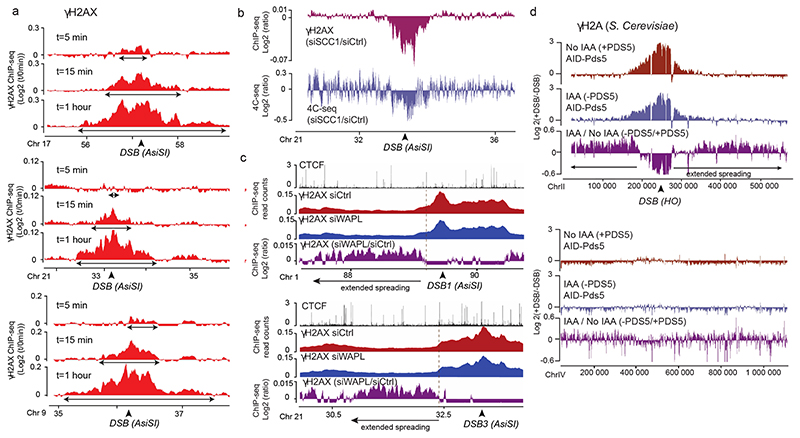
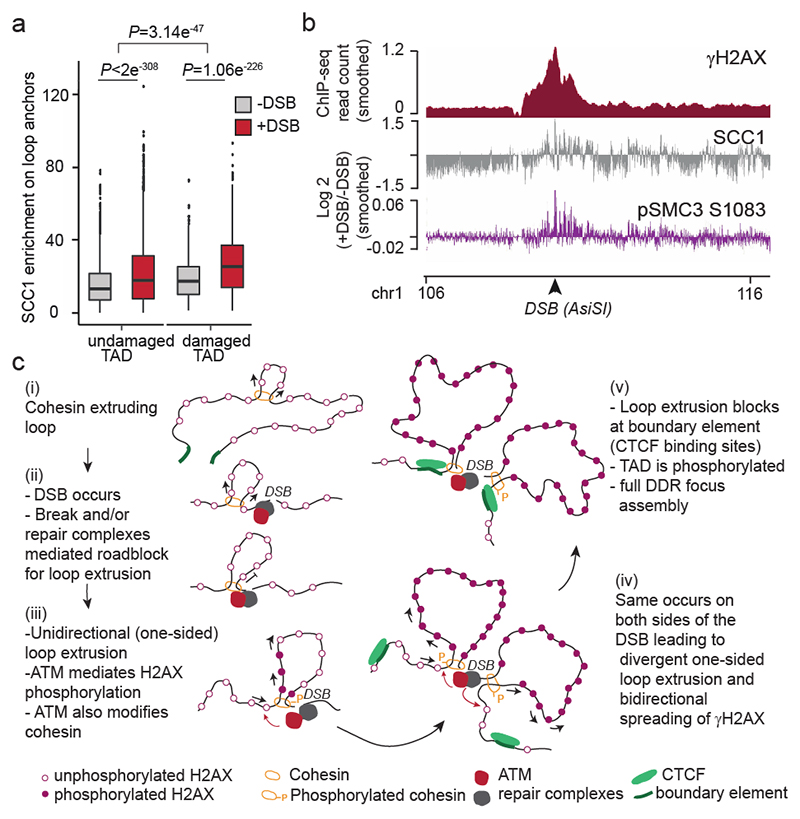
The repair of DNA double-strand breaks (DSBs) is essential for safeguarding genome integrity. When a DSB forms, the PI3K-related ATM kinase rapidly triggers the establishment of megabase-sized, chromatin domains decorated with phosphorylated histone H2AX (γH2AX), which act as seeds for the formation of DNA-damage response foci1. It is unclear how these foci are rapidly assembled to establish a 'repair-prone' environment within the nucleus. Topologically associating domains are a key feature of 3D genome organization that compartmentalize transcription and replication, but little is known about their contribution to DNA repair processes2,3. Here we show that topologically associating domains are functional units of the DNA damage response, and are instrumental for the correct establishment of γH2AX-53BP1 chromatin domains in a manner that involves one-sided cohesin-mediated loop extrusion on both sides of the DSB. We propose a model in which H2AX-containing nucleosomes are rapidly phosphorylated as they actively pass by DSB-anchored cohesin. Our work highlights the importance of chromosome conformation in the maintenance of genome integrity and demonstrates the establishment of a chromatin modification by loop extrusion.


Conflict of interest statement

Competing interest statement

The authors declare no competing interests.

Figures

Extended Data Figure 1
Extended Data Figure 1. γH2AX spreads within prior TAD as revealed by 4C-seq
(a) 4C-seq tracks before DSB induction obtained for three independent biological replicates and γH2AX ChIP-seq track after DSB induction for different viewpoints (red arrows) localized at three AsiSI sites (black arrows). ChIP-seq data are smoothed using 100 kb span, 4C-seq using a 50 kb span. (b) Example of the Hi-C pattern obtained on chromosome 1 at a 500kb resolution (left) together with a magnification at a 10kb resolution (right). (c) CTCF and calibrated-SCC1 ChIP-seq tracks. (d) Average profile of CTCF ChIP-seq around all loop anchors on the genome (determined using this Hi-C dataset, see Methods), validating both CTCF ChIP-seq and Hi-C datasets. (e) γH2AX ChIP-seq after DSB induction, 4C-seq and CTCF ChIP-seq peak position before DSB induction are shown (peaks in blue contain a CTCF motif in the forward orientation and peaks in red a CTCF motif in the reverse orientation). (f) Box plot showing γH2AX (top), 53BP1 (middle) and MDC1 (bottom) ChIP-seq quantification within the damaged TAD and neighboring TADs for the best cleaved DSBs in DIvA cells (see methods). Center line: median; Box limits: 1st and 3rd quartiles; Whiskers: Maximum and minimum without outliers; Points: outliers. (n=153). (g) γH2AX tracks around a DSB induced by CRISPR/Cas9 (upper panel, ChIP-chip, expressed as the log2 sample/input, smoothed using 100 probes windows) and by AsiSI at the same position (lower panel, ChIP-seq, 50kb smoothed). (h) Top: Immunofluorescence experiment showing γH2AX and DAPI staining before and after DSB induction with or without ATM inhibitor as indicated (scale bar, 10μm). Bottom: Quantification of γH2AX intensity (expressed in A.U: Arbitrary Unit) in the above conditions. One representative experiment is shown (out of n=3 biological replicates. Center line: median; Box limits: 1st and 3rd quartiles; Whiskers: Maximum and minimum without outliers; Points: outliers. (−DSB n=117 nuclei; +DSB n=97 nuclei; +DSB+ATMi n=95 nuclei) (i) Validation of the ATR inhibitor efficiency: Western Blot showing the effect of ATRi on the phosphorylation of CHK1 following a treatment with hydroxyurea (HU) (n=2). For gel source data, see Supplementary Figure 1. (j) γH2AX ChIP-seq tracks after DSB induction in untreated cells or in cells treated with an inhibitor of ATM or ATR at two DSB sites (20kb smoothed). The differential γH2AX signal obtained after DSB induction (expressed as the log2 ratio ATMi/untreated or ATRi/untreated, grey tracks) is also shown. (k) Average profile of pATM (S1981) (left panel) and γH2AX (right panel) ChIP-seq on a 2 Mb window around the eighty best-cleaved DSBs in DIvA cells.
Extended Data Figure 2
Extended Data Figure 2. Cohesin recruitment and loop extrusion occurs at DSBs
(a) Calibrated SCC1 ChIP-seq tracks before (grey) and after (black) DSB induction. SCC1 enrichment at DSB site is indicated by a red arrow. (b) Average profile of SCC1 ChIP-seq signal centered on 80 best-induced DSBs (left panel) or centered on all CTCF peaks of the genome (right panel) on a 10 kb window. (c) Calibrated ChIP-qPCR of SCC1 in the indicated conditions at three DSB sites or a control negative region. Western Blot validating the depletion of the proteins NIPBL (n=1) and MRE11 (n=2) by the corresponding siRNA are shown. For gel source data, see Supplementary Figure 1. S.e.m and mean for technical replicates (n=4) of a representative experiment is shown (out of n=2 biological replicates). (d) Averaged Hi-C matrix before (-DSB) and after DSB induction (+DSB) (observed/expected) and of the log2 ratio between damaged versus undamaged cells centered on the eighty best-induced DSBs (top panels) or centered on eighty random TAD borders (bottom panels) (50 kb resolution, 5 Mb window) (combined replicates). (e) Averaged Hi-C contact matrix of the log2 +DSB/-DSB centered on the eighty best-induced DSBs in the two independent biological replicates. (f) Aggregate Peak Analysis (APA) plot on a 200kb window (10 kb resolution) before (-DSB) and after DSB induction (+DSB) in the biological replicate #2 (replicate#1 shown as main Fig.2c). APA are calculated between the DSBs and loops anchors (n=552 pairs). The fold change between the signal (central pixel) and the background (upper left corner 5x5 pixels) is indicated. (g) For comparison with ED. Fig. 2f, APA plot on a 200kb window (10 kb resolution) before DSB induction were computed between classical loop anchors that are near DSB sites (<500kb) (n=674 pairs for replicate 1 and n=737 pairs for replicate 2). The fold change between the signal (central pixel) and the background (upper left corner 5x5 pixels) is indicated. The loop strength (quantified by the FC between signal and background on APA plot) is higher at loop anchors (ED Fig. 2g, Rep#1 FC=5.4 and Rep#2 FC=5.8) than the loop strength observed at DSB post break induction (Fig. 2c, Rep#1, FC=2 and ED Fig. 2f, Rep#2 FC=2.3).
Extended Data Figure 3
Extended Data Figure 3. Loop extrusion at DSBs detected by 4C-seq
(a) 4C-seq tracks (10 kb smoothed) before and after DSB induction as indicated, obtained for three biological replicates using viewpoints localized at three DSB sites. The DSBs are indicated by arrows. (b) 4C-seq tracks before (blue) and after (purple) DSB induction, at two DSB viewpoints. Differential 4C-seq (Log2 +DSB/-DSB) is also shown (black). (c) Differential 4C-seq (log2 +DSB/-DSB) is shown for three viewpoints located at DSB sites and on a Ctrl region as indicated. (d) Bar plot showing the differential 4C-seq signal (log2 +DSB/-DSB) computed on 1 Mb around four independent viewpoints located at DSBs (“DSBs viewpoints”, n=11) and one control region (“Control viewpoint”, n=3), across four independent biological experiments (see Methods). P value between control and DSBs viewpoints is indicated (two-sided Wilcoxon test). S.e.m and mean values are plotted. (e) Western Blot showing the depletion of SCC1 by siRNA (n=3). For gel source data, see Supplementary Figure 1. (f) Differential (log2) 4C-seq track in SCC1 siRNA treated cells versus control siRNA-treated cells (in undamaged conditions) for three viewpoints. (g) Genomics tracks showing the 4C-seq signals before and after DSB induction in siRNA Ctrl-or SCC1-treated cells and the differential 4C-seq signal in Ctrl or SCC1 siRNA treated cells (log2 +DSB/-DSB) (10kb smoothed). (h) Boxplot showing the average Log2 +DSB/-DSB 4C-seq, on 1 Mb around four DSBs viewpoints (two biological experiments) upon control or SCC1 depletion by siRNA (see Methods) (n=8). P value: two-sided Wilcoxon test. Center line: median; Box limits: 1st and 3rd quartiles; Whiskers: Maximum and minimum without outliers.
Extended Data Figure 4
Extended Data Figure 4. ATM activity is required for loop extrusion at DSB
(a) Hi-C maps before DSB induction of a region of the chromosome 17 in Ctrl- and SCC1-depleted cells. Left panel: 100kb resolution, right panel (magnification): 25kb resolution. (b) Genomic tracks of 4C-seq before and after DSB induction in untreated or ATM inhibitor treated cells and of differential 4C-seq signal (log2 +DSB/-DSB or +DSB+ATMi/-DSB) (10kb smoothed). (c) cis interactions computed as in ED. Fig. 3h for four DSBs viewpoints across three biological experiments, in control condition or upon ATM inhibition. P value: two-sided Wilcoxon test. Center line: median; Box limits: 1st and 3rd quartiles; Whiskers: Maximum and minimum without outliers; (n=8)
Extended Data Figure 5
Extended Data Figure 5. Altered loop extrusion modifies γH2AX spreading
(a) Quantification of γH2AX intensity (expressed in A.U: Arbitrary Unit) after DSB induction (OHT 4h) and upon ATM inhibition followed by different time points after ATMi release (0min n=172 nuclei; 5min n=183 nuclei, 15 min n=171 nuclei; 30min n=197 nuclei; 1h n=189 nuclei). Treatment with OHT for 4h without ATMi is also shown (n=182 nuclei). One representative experiment is shown (out of n=2 biological replicates). Center line: median; Box limits: 1st and 3rd quartiles; Whiskers: Maximum and minimum without outliers. (b) boxplot showing the spread of γH2AX (in bp) at the indicated time points after release from ATMi around the best cleaved DSBs (n=71). Center line: median; Box limits: 1st and 3rd quartiles; Whiskers: Maximum and minimum; points: outliers. (c) Black: 4C-seq track before DSB induction using a DSB viewpoint (DSB is indicated by a black arrow, Viewpoint by a red arrow). Purple (middle) track shows the differential γH2AX signal obtained after DSB induction by ChIP-chip in SCC1-depleted versus control cells (expressed as the γH2AX log2 ratio siSCC1/ siCtrl). Light blue track (bottom) shows the differential 4C-seq signal obtained in SCC1-depleted versus control cells before DSB induction (log2 siSCC1/ siCtrl). (d) Genomic tracks of γH2AX ChIP-seq signal after DSB induction in Ctrl (red) or SCC1 (pink) depleted cells and of the differential γH2AX signal obtained after DSB induction (expressed as the log2 ratio siSCC1/siCtrl, purple) at two DSB sites. (e) Western blot validating the effect of the siRNA targeting WAPL on the WAPL protein level (n=2). For gel source data, see Supplementary Figure 1. (f) Genomics tracks of γH2AX ChIP-seq after DSB induction in Ctrl or WAPL depleted cells and of the differential γH2AX signal obtained after DSB induction (expressed as the log2 ratio siWAPL/siCtrl) at two DSB sites and one control (bottom panel) genomic locus (no DSB) (20kb smoothed). (g) Genomics tracks of the differential γH2A ChIP-seq signal (log2 +DSB/-DSB) before (no IAA) or after PDS5 degradation (IAA) at two DSB sites (HO sites) in S. Cerevisiae (SacCer3, coordinates in bp).
Extended Data Figure 6
Extended Data Figure 6. Increased genome-wide, DSB-induced, cohesin binding is enhanced within damaged TADs
(a) Upper panel: Contact matrix (5kb resolution) showing the log2 (observed/expected) before or after DSB induction as indicated, on a region showing a loop on chromosome 20 and devoid of AsiSI site (no DSB). Loops anchors are circled and indicated by red and blue bars. Lower panel: Genome browser screenshot showing the SCC1 calibrated ChIP-seq on the same region before and after DSB induction as indicated. Cohesin enrichment at the loop anchors (blue and red bars) is increased after DSB (black arrows) compared to before DSB (grey arrows) in agreement with an increased loop strength (grey and black circles). (b) Violin plots showing the SCC1 enrichment at cohesin peaks (n=46194) before and after DSB induction as indicated. P values are indicated (paired one-sided Wilcoxon test). (c) Genomic tracks of γH2AX (red) and SCC1 ChIP-seq signal before (blue) and after (purple) DSB 862 induction. The ratio between before and after DSB induction (grey) is also shown (expressed 863 as the log2 +DSB/-DSB) (10kb smoothed). (d) Boxplot showing the quantification of SCC1 864 recruitment on loop anchors, at different distances from DSB sites as indicated (from left to 865 right, n=1610, 3161, 1930, 3232, 4786, 25263, 114461). Center line: median; Box limits: 1st and 3rd quartiles; Whiskers: Maximum and minimum; points: outliers. (e) γH2AX ChIP-seq signal and Hi-C signal at different distances from a damaged TAD of the chromosome 1 before (-DSB) and after DSB induction (+DSB). Green circles represent the chromatin loops. (f) Aggregate Peak Analysis (APA) plot on a 200 kb window (10 kb resolution) before (-DSB) and after DSB induction (+DSB) calculated for all loop anchors, in damaged and undamaged TAD as indicated. The fold change between the signal (central pixel) and the background (lower left corner 5x5 pixels) is indicated. (g) Boxplots showing the differential loops strength in undamaged or damaged TADs as indicated (see methods), computed from Hi-C data obtained before and after DSB, from replicate #1 (left panel) ad replicate #2 (right panel). P values between before and after DSB are indicated (Wilcoxon 876 test, μ=0). The increased loop strength following DSB is significantly higher in damaged TADs as compared to undamaged TADs (paired two-sided Wilcoxon test) in both Hi-C replicates experiments. Replicate #1: undamaged n=2936; damaged n=264. Replicate #2, undamaged n=3181, damaged n=302. Center line: median; Box limits: 1st and 3rd quartiles; Whiskers: Maximum and minimum without outliers; Points: outliers.
Extended Data Figure 7
Extended Data Figure 7. DSB-induced phosphorylation of cohesin occurs in damaged TADs
(a) Genomic tracks showing γH2AX, phosphorylated SMC3 (pSMC3 S1083) and phosphorylated SMC1 (pSMC1 S966) ChIP-chip signal expressed as the log2 ratio sample/input after DSB induction. Two damaged genomic locations are shown. (b) Average profile of pSMC3 S1083 (expressed as the log2 (+DSB/-DSB) ChIP-seq signal) around the eighty best-induced DSBs on a 4Mb window. (c) Boxplot showing the quantification of pSMC3 S1083 signal on loop anchors, within damaged or undamaged TADs as indicated. P values between before and after DSB are indicated (paired two-sided Wilcoxon test). The increased pSMC3 S1083 enrichment on loop anchors following DSB is significantly higher in damaged TADs as compared to undamaged TADs (two-sided Wilcoxon test). undamaged n=9040; damaged n=1626. Center line: median; Box limits: 1st and 3rd quartiles; Whiskers: Maximum and minimum without outliers; Points: outliers.
Figure 1
Figure 1. TADs are functional units governing DDR chromatin domains establishment
(a) 4C-seq track in undamaged cells (-DSB) and ChIP-seq tracks of histone H1 (H1.2) and Ubiquitin (FK2) (log2 (+DSB/-DSB)) as well as γH2AX, MDC1 and 53BP1 (+DSB) as indicated. ChIP-seq data were smoothed using 50kb span, 4C-seq using a 10kb span. The AsiSI site is indicated by an arrow. (b) 4C-seq before DSB induction (-DSB) and γH2AX ChIP-seq after DSB induction (+DSB) tracks (smoothed using a 50kb span) for different viewpoints localized at three AsiSI sites or a Control region. One representative experiment is shown (out of n=3). Arrows: AsiSI sites. (c) γH2AX ChIP-seq (+DSB) and 4C-seq (-DSB) tracks (10 kb smoothed) for two viewpoints localized at the AsiSI site or 470 kb upstream of the AsiSI site. Viewpoints: red arrows, DSB: black arrows. (d) Hi-C contact matrix of a region of the chromosome 1 in DIvA cells before DSB induction (top panel). γH2AX ChIP-seq after DSB induction, 4C-seq signal, TAD borders computed from Hi-C data and CTCF ChIP-seq peaks position before DSB induction are shown. Peaks in blue contain a CTCF motif in the forward orientation and peaks in red a CTCF motif in the reverse orientation. (e) Average profile of γH2AX ChIP-seq after DSB induction centered on the closest TAD border to the 174 best-induced DSBs (damaged TAD on the right). (f) 4C-seq track (10 kb smoothed) before DSB induction (-DSB) (in blue) using view points as indicated (red arrows). γH2AX ChIP-chip tracks (log2 sample/input, smoothed using 500 probes span) after DSB induction with CRISPR/Cas9 (black arrows) are shown in red. (g) γH2AX and pATM (S1981) ChIP-seq tracks after DSB induction (+DSB) on an 8 Mb window (top panel) and a 15 kb window (bottom panel) around an AsiSI site (black arrow).
Figure 2
Figure 2. DSB-anchored cohesin mediates loop extrusion.
(a) Genomic tracks of SCC1 and XRCC4 ChIP-seq at two DSBs, indicated by black arrows. (b) Averaged Hi-C contact matrix of the log2 (+DSB/-DSB) (n=2 biological replicates) centered on the 80 best-induced DSBs (50 kb resolution, 5 Mb window). Stripes are indicated by white arrows. (c) Mean aggregate Peak Analysis (APA) plot on a 200kb window (10 kb resolution) before and after DSB induction, calculated between the DSBs and nearby loops anchors (n=525 pairs). The fold change between the signal (central pixel) and the background (upper left corner 5×5 pixels) is indicated. (d) Averaged differential Hi-C contact matrix (+DSB/-DSB) (n=2 biological replicates) around 30 HR-repaired DSBs, 30 NHEJ-repaired DSBs and 30 random undamaged sites. (e) Box plot of the SCC1 ChIP-seq enrichment before and after DSB on 4 kb around DSBs repaired by HR (yellow), NHEJ (green) and random undamaged sites (grey) (n=30). P values are indicated (paired two-sided Wilcoxon test). Center line: median; Box limits: 1st and 3rd quartiles; Whiskers: Maximum and minimum without outliers; Points: outliers. (f) Differential 4C-seq track in control (black) or in SCC1 siRNA condition (blue). (g) Averaged log2 (+DSB/-DSB) Hi-C matrix upon CTRL or SCC1 siRNA, around eighty best-induced DSBs (100 kb resolution).
Figure 3
Figure 3. DSB-anchored loop extrusion mediates γH2AX spreading.
(a) γH2AX ChIP-seq tracks at three DSB sites upon DSB induction at different time points after ATMi release (expressed as log2 (+DSB+ATMi+time after washes/ +DSB+ATMi+0min after washes)) (20 kb smoothed). (b) Genomic track showing differential (log2 ratio siSCC1/ siCtrl) γH2AX enrichment obtained after DSB induction (purple) (20kb smoothed). Light blue track shows the differential 4C-seq signal obtained in SCC1-depleted versus control cells before DSB induction (log2 siSCC1/siCtrl). (c) Genomic tracks showing the CTCF signal before DSB induction, the γH2AX ChIP-seq signal after DSB induction in Ctrl or WAPL-depleted cells and the differential γH2AX signal obtained after DSB induction (expressed as the log2 ratio siWAPL/siCtrl, 20kb smoothed) at two DSB sites. (d) Genomic tracks showing the differential γH2A ChIP-seq signal (log2 +DSB/-DSB) before (no IAA) or after PDS5 degradation (IAA) at one DSB site (HO site) (top panel) and in a control region (without DSB) (bottom panel) in S.Cerevisiae PDS5-AID. The differential signal between after and before PDS5 degradation (IAA / No IAA) is also shown (purple). Data are smoothed with a 2kb span.
Figure 4
Figure 4. DSBs trigger modifications of cohesin biology at a genome-wide scale and accentuated in damaged TADs.
(a) Boxplot showing the quantification of SCC1 recruitment on loop anchors before (grey) and after (red) DSB induction, within damaged (n=1456) or undamaged TADs (n=7804). Center line: median; Box limits: 1st and 3rd quartiles; Whiskers: Maximum and minimum without outliers; Points: outliers. P values are indicated (two-sided Wilcoxon test). The increased SCC1 enrichment on loop anchors following DSB is significantly higher in damaged TADs as compared to undamaged TADs (two-sided Wilcoxon test). (b) Genomics tracks showing the γH2AX ChIP-seq signal (50kb smoothed), SCC1 and phosphorylated SMC3 (pSMC3 S1083) ChIP-seq signal expressed as the log2 ratio (+DSB/-DSB) (20kb smoothed). (c) Model: Cohesin-mediated loop extrusion ensures γH2AX establishment on the entire damaged TAD. (i) Loop extrusion constantly occurs on the genome. (ii) The occurrence of a DSB creates a roadblock for cohesin-mediated loop extrusion leading to accumulation of cohesin at the site of damage. (iii) Cohesin blocked at DSB continues to mediate loop extrusion in a unidirectional manner (i.e. one-sided loop extrusion, arrows). ATM, recruited at the immediate vicinity of the break, phosphorylates H2AX-containing nucleosomes as they are extruded. Meanwhile, cohesin are also phosphorylated by ATM. (iv) The same process takes place on both sides of the DSB, leading to divergent one-sided loop extrusion at either side of the break ensuring a bidirectional spreading of γH2AX. (v) Loop extrusion triggers enlargement of γH2AX modified chromatin and halt at boundary elements such as CTCF-bound loci, that demarcate TAD borders. The speed of loop extrusion (measured in vitro as 0.5-2kb/s) ensures that the entire damaged TAD is phosphorylated in 10-30 minutes, giving rise to a DDR focus. NB: here the cohesin is shown as a ring encircling DNA for graphical reasons, but it is not known yet, whether and how cohesin ring entraps DNA during the loop extrusion process.

Comment in

Similar articles

Cited by

References

    1. Clouaire T, Marnef A, Legube G. Taming Tricky DSBs: ATM on duty. DNA Repair (Amst) 2017;56:84–91. - PubMed
    1. McCord RP, Kaplan N, Giorgetti L. Chromosome conformation capture and beyond: toward an integrative view of chromosome structure and function. Mol Cell. 2020;77:688–708. - PMC - PubMed
    1. Arnould C, Legube G. The Secret Life of Chromosome Loops upon DNA Double-Strand Break. J Mol Biol. 2020;432:724–736. - PMC - PubMed
    1. Rogakou EP, Boon C, Redon C, Bonner WM. Megabase chromatin domains involved in DNA double-strand breaks in vivo. J Cell Biol. 1999;146:905–916. - PMC - PubMed
    1. Clouaire T, et al. Comprehensive Mapping of Histone Modifications at DNA Double-Strand Breaks Deciphers Repair Pathway Chromatin Signatures. Mol Cell. 2018;72:250–262.e6. - PMC - PubMed

Publication types

MeSH terms