. 2021 Feb 1:14:616906.
doi: 10.3389/fnins.2020.616906. eCollection 2020.

Searchlight Classification Informative Region Mixture Model (SCIM): Identification of Cortical Regions Showing Discriminable BOLD Patterns in Event-Related Auditory fMRI Data

Affiliations

Searchlight Classification Informative Region Mixture Model (SCIM): Identification of Cortical Regions Showing Discriminable BOLD Patterns in Event-Related Auditory fMRI Data

Annika Urbschat et al. Front Neurosci. .

Abstract

The investigation of abstract cognitive tasks, e.g., semantic processing of speech, requires the simultaneous use of a carefully selected stimulus design and sensitive tools for the analysis of corresponding neural activity that are comparable across different studies investigating similar research questions. Multi-voxel pattern analysis (MVPA) methods are commonly used in neuroimaging to investigate BOLD responses corresponding to neural activation associated with specific cognitive tasks. Regions of significant activation are identified by a thresholding operation during multivariate pattern analysis, the results of which are susceptible to the applied threshold value. Investigation of analysis approaches that are robust to a large extent with respect to thresholding, is thus an important goal pursued here. The present paper contributes a novel statistical analysis method for fMRI experiments, searchlight classification informative region mixture model (SCIM), that is based on the assumption that the whole brain volume can be subdivided into two groups of voxels: spatial voxel positions around which recorded BOLD activity does convey information about the present stimulus condition and those that do not. A generative statistical model is proposed that assigns a probability of being informative to each position in the brain, based on a combination of a support vector machine searchlight analysis and Gaussian mixture models. Results from an auditory fMRI study investigating cortical regions that are engaged in the semantic processing of speech indicate that the SCIM method identifies physiologically plausible brain regions as informative, similar to those from two standard methods as reference that we compare to, with two important differences. SCIM-identified regions are very robust to the choice of the threshold for significance, i.e., less "noisy," in contrast to, e.g., the binomial test whose results in the present experiment are highly dependent on the chosen significance threshold or random permutation tests that are additionally bound to very high computational costs. In group analyses, the SCIM method identifies a physiologically plausible pre-frontal region, anterior cingulate sulcus, to be involved in semantic processing that other methods succeed to identify only in single subject analyses.

Keywords: GMM; MVPA; SVM; fMRI; p-values; searchlight classification.


Conflict of interest statement

The authors declare that the research was conducted in the absence of any commercial or financial relationships that could be construed as a potential conflict of interest.

Figures

Figure 1
Figure 1
Proposed searchlight classification informative region (SCIM) algorithm procedure. Subsequent to fMRI data classification with the searchlight algorithm, the resulting area-under-curve (AUC) performance values are spatially smoothed and decomposed into a non-informative and an informative searchlight distribution using a two-component GMM. Searchlights with a-posteriori probability for the informative distribution above threshold, equivalent to the non-informative distribution posterior below threshold, define the informative region map (IRM).
Figure 2
Figure 2
The histogram of searchlight area under the curve (AUC) values in an example map from single-subject results analysis is overlain with the respective GMM and the corresponding informative and non-informative searchlight distributions. Additionally means and variances of distributions as basis of metrics for separation criteria are displayed.
Figure 3
Figure 3
Results obtained from simulated data on smoothed AUC maps. Template map (A) for comparison with simulation result maps obtained from analysis with SCIM method (B), random permutation test (C), and binomial test (D) of spatially smoothed AUC maps. Due to spatial smearing effects based on the searchlight algorithm, results obtained from all methods show larger spatial extent than the template map. The map based on SCIM analysis is most similar to the template map. The map obtained from random permutation test shows larger smearing effects, while binomial test results in informative regions that are not present in the template map. The locations of the transversal slices are depicted on a sagittal slice (x = 0).
Figure 4
Figure 4
Results obtained from simulated data on unsmoothed AUC maps. The SCIM result maps (B) are comparable to those obtained with spatial smoothing (Figure 3) while in the permutation test results (C) and in the binomial test results (D) numerous small informative regions can be found that are not in line with the template map (A).
Figure 5
Figure 5
Overlap of simulation result maps with underlying ground truth map obtained from SCIM analysis, random permutation test and binomial test for 10 repetitions of simulation analysis and different applied significance p-value thresholds, respectively. (A) depicts the results with FDR correction and (B) depicts the results without correction for multiple comparison. Median values across 10 repetitions are presented as lines, inter-quartile ranges are displayed as semi-transparent plane but not visible due to the very small variance across repetitions. For very small p-values, SCIM and binomial test results show comparable overlap with ground truth maps. However, overlap decreases for binomial results with increasing p-values, while SCIM results stay almost constant. Result maps obtained from random permutation test show minimum p-values of prp = 0.01 (resulting from 100 repetitions) and exhibit no informative regions for lower p-value thresholds. For p-values higher than 0.5, both reference methods, random permutation test and binomial test, are limited by the additional criterion of AUC> 0.5 for searchlights to be informative and overlap values converge to a constant value. For results obtained with the SCIM method, this value is achieved for p-value threshold close to 1.
Figure 6
Figure 6
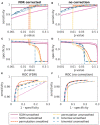
Comparison of the sensitivity (A,B), specificity (C,D), and ROC curves (E,F) for the different methods SCIM, permutation test and binomial test. All methods were tested with smoothed and unsmoothed AUC maps. The results with FDR correction are depicted in the left panels and results without correction for multiple comparison are depicted in the right panels.
Figure 7
Figure 7
Spatial distribution of a-posteriori probabilities pSCIM (SCIM) and p-values (random permutation test and binomial test) across a single slice (z = 6 mm, single subject, evaluation measure AUC, spatial smoothing for SCIM, random permutation, and binomial) of single subject results from three different subjects. (A) depicts the results for subject 1, (B) shows the results for subject 2, and (C) shows the results for subject 3. Left panels: distribution of pSCIM-values resulting from the Searchlight Classification Informative Region Mixture Model (SCIM, semi-transparent plane located at pSCIM = 0.05) has plateaus of high significance levels for informative searchlight regions and a low noise floor across non-informative areas. Center panels: p-values resulting from random permutation analysis (semi-transparent plane located at pperm = 0.05). Right panels: The distribution of binomial-test p-values (semi-transparent plane located at pbin = 0.05) shows gradual transition from informative to non-informative searchlight areas in a narrow p-value interval. Differences between informative and non-informative areas are best delineated by the SCIM method and less pronounced with random permutation and binomial methods.
Figure 8
Figure 8
Single slice (at z = 6 mm) of subject informative region maps (IRMs). (A) depicts the results for subject 1, (B) shows the results for subject 2, and (C) shows the results for subject 3. IRMs obtained from single subject results with SCIM methods (first column), Permutation test (second column) and binomial test(third column) for three different subjects at a significance level pSCIM < 0.05, prp < 0.05, and pbin < 0.05, without correction for multiple comparison (red) and with FDR correction (orange), respectively. For subjects 2 and 3, no informative voxels can be found when FDR correction is applied. For the SCIM method and binomial method, maps obtained with FDR correction exhibit slightly smaller informative regions. Right panels show the results' distribution across voxels. A histogram of AUC values is presented as bar-plot. A-posteriori probabilities obtained from SCIM analysis (red circles) and p-values obtained from permutation test (black dots) and binomial test (dark red dashed line) are displayed, as well as underlying assumed Null-distributions for the different tests, SCIM method (dark blue line) and permutation test with one distribution for a voxel with high (blue), middle (green), and low (red) performance, respectively. For subject 1 the distribution peaks for AUC values lower than 50%, while for the other subjects the maximum is located at chance level AUC = 50%.
Figure 9
Figure 9
Quantitative analysis of single subject maps across subjects. (A,C) Cumulative histograms of fraction on searchlight volumes (in %, abscissa) whose pSCIM-value is below a chosen threshold pthr-value (ordinate), i.e., which are considered informative. Curves indicate group median for SCIM method, random permutation method and binomial method with area-under-curve (AUC) and accuracy (acc) measures, respectively. Semi-transparent areas depict the inter-quartile range. (B,D) Average inverse slopes of curves in (A,C) within the interval 0.05 > pthr > 0.01. (A,B) Show FDR corrected results, (C,D) show respective non-corrected results. Results indicate that the SCIM method is characterized by a strong separation of informative and non-informative searchlight volumes, both for FDR corrected and non-corrected maps, while results obtained with AUC measurement and random permutation test are highly dependent on the applied thresholds. Binomial test results show this dependency in all cases.
Figure 10
Figure 10
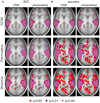
Single slices (z = 6 mm, respectively) of group maps with AUC measure (A) and accuracy measures (B). First and third column show results with FDR correction, second and fourth column respective results without correction for multiple comparison. Group results obtained with the proposed SCIM methods are displayed in the first row, random permutation test results in the second row. Third row represents results from binomial test group results. Informative regions at a threshold with p < 0.05 are colored in red, respective results for thresholds p < 0.01 in dark violet and p < 0.01 in light violet.
Figure 11
Figure 11
Spatial distribution of a-posteriori probabilities pSCIM (SCIM) and p-values (random permutation test and binomial test) across a single slice from group result maps [z = 6 mm, group results, evaluation measure AUC (A–C) and accuracy (D–F), spatial smoothing]. (A,D) Distribution of pSCIM-values resulting from the Searchlight Classification Informative Region Mixture Model (SCIM, semi-transparent plane located at pSCIM = 0.001) has plateaus of high significance levels for informative searchlight regions and a low noise floor across non-informative areas. (B,E) P-values resulting from random permutation analysis (semi-transparent plane located at pperm = 0.001). (C,F) Distribution of binomial-test p-values (semi-transparent plane located at pbin = 0.001) in a very narrow p-value interval. Differences between informative and non-informative areas are best delineated by the SCIM method, however, very similar to those in results obtained from random permutation test. For accuracy measure, the random permutation test exhibits sub-threshold non-informative regions, that are not as well-separated from informative regions as compared to results map from AUC analysis or SCIM analysis. Results obtained from the binomial method are almost non-separable into informative and non-informative regions, since the range of emerging p-values is very small.
Figure 12
Figure 12
Statistical evaluation of group results based on (A) AUC measures and (B) accuracy measures. Histograms show the distribution of classification performance results emerging in group mean maps. Red circles show a-posteriori probabilities obtained from SCIM analysis for respective classification performance values and the blue line the underlying Null-distribution. In random permutation test p-values are calculated independently for all voxels that are shown with black dots. p-values obtained with the binomial test result from the binomial distribution that also represents the assumed Null-distribution for this test.
Figure 13
Figure 13
Group result maps for the contrast semantic speech vs. non-semantic speech, with proposed SCIM method on (A) AUC maps, (B) accuracy maps, random permutation test on (C) AUC and (D) accuracy maps in five transversal slices and one sagittal slice to display location of transversal slices. Informative regions for group results obtained with random permutation test and SCIM method on AUC maps are qualitatively consistent, however spatial extent of informative regions from random permutation test is slightly larger compared to those obtained from SCIM method analysis. While SCIM result maps based on accuracy measure show spatially smaller informative regions with less reliability, corresponding maps obtained from random permutation test seem to be too optimistic and lead to non-interpretable informative regions. For AUC measures informative regions are located in primary and secondary auditory cortex, namely in Heschl's gyrus (HG) and superior temporal gyrus (sts) as well as adjacent regions, Broca's area and Wernicke's area, that have been associated previously with speech processing. Additional informative regions can be found outside of temporal cortex, in anterior and posterior cingulate gyrus, previously being associated to semantic processing.

Similar articles

Cited by

References

    1. Abrams D. A., Ryali S., Chen T., Balaban E., Levitin D. J., Menon V. (2012). Multivariate activation and connectivity patterns discriminate speech intelligibility in Wernicke's, Broca's and Geschwind's area. Cereb. Cortex 23, 1703–1714. 10.1093/cercor/bhs165 - DOI - PMC - PubMed
    1. Adank P., Devlin J. T. (2010). On-line plasticity in spoken sentence comprehension: adapting to time-compressed speech. Neuroimage 49, 1124–1132. 10.1016/j.neuroimage.2009.07.032 - DOI - PMC - PubMed
    1. Akama H., Murphy B., Lei M. M., Poesio M. (2014). Cross-participant modelling based on joint or disjoint feature selection: an fMRI conceptual decoding study. Appl. Inform. 1, 1–21. 10.1186/2196-0089-1-1 - DOI
    1. Akama H., Murphy B., Na L., Shimizu Y., Poesio M. (2012). Decoding semantics across fMRI sessions with different stimulus modalities: a practical MVPA study. Front. Neuroinform. 6:24. 10.3389/fninf.2012.00024 - DOI - PMC - PubMed
    1. Allefeld C., Görgen K., Haynes J.-D. (2016). Valid population inference for information-based imaging: from the second-level t-test to prevalence inference. Neuroimage 141, 378–392. 10.1016/j.neuroimage.2016.07.040 - DOI - PubMed

LinkOut - more resources