. 2021 Feb 1:14:623148.
doi: 10.3389/fnmol.2021.623148. eCollection 2021.

Single-Cell Transcriptomic Reveals Dual and Multi-Transmitter Use in Neurons Across Metazoans

Affiliations

Single-Cell Transcriptomic Reveals Dual and Multi-Transmitter Use in Neurons Across Metazoans

Clarisse Brunet Avalos et al. Front Mol Neurosci. .

Abstract

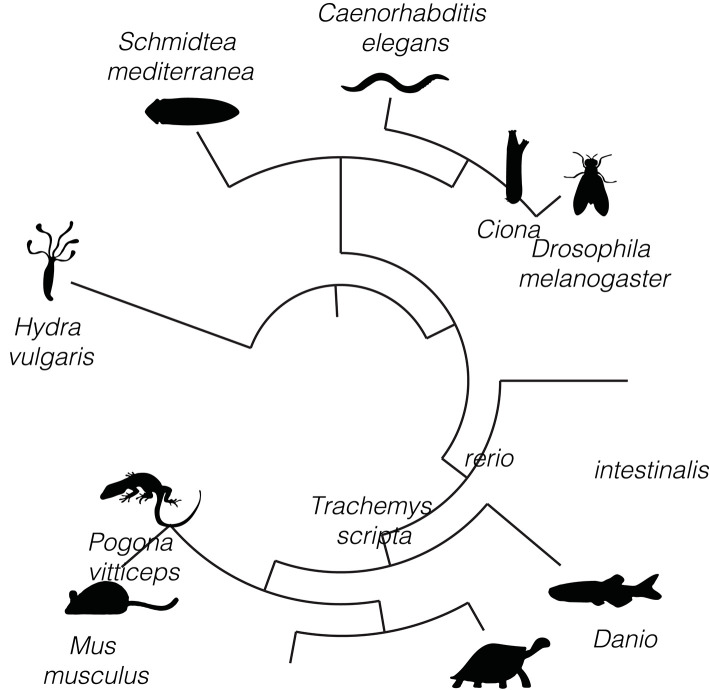
Neurotransmitter expression is widely used as a criterion for classifying neurons. It was initially thought that neurons express a single type of neurotransmitter, a phenomenon commonly recognized as Dale's principle: "one neuron, one transmitter." Consequently, the expression of a single neurotransmitter should determine stable and distinguishable neuronal characteristics. However, this notion has been largely challenged and increasing evidence accumulates supporting a different scenario: "one neuron, multiple neurotransmitters." Single-cell transcriptomics provides an additional path to address coexpression of neurotransmitters, by investigating the expression of genes involved in the biosynthesis and transmission of fast-acting neuromodulators. Here, we study neuronal phenotypes based on the expression of neurotransmitters, at single-cell resolution, across different animal species representing distinct clades of the tree of life. We take advantage of several existing scRNAseq datasets and analyze them in light of neurotransmitter plasticity. Our results show that while most neurons appear to predominantly express a single type of neurotransmitter, a substantial number of neurons simultaneously expresses a combination of them, across all animal species analyzed.

Keywords: Dale's principle; metazoans; neurons; neurotransmitter; scRNAseq.


Conflict of interest statement

The authors declare that the research was conducted in the absence of any commercial or financial relationships that could be construed as a potential conflict of interest.

Figures

Figure 1
Figure 1
Conserved dual and multi-transmitter neurons across metazoans. (A) Circular phylogenetic tree displaying the different species analyzed to study neuronal composition of the brain, or neuronal networks, in terms of their neurotransmitter phenotypes. The species are listed (clockwise) in the order of appearance in the manuscript. Silhouettes are only illustrative.
Figure 2
Figure 2
Hydra vulgaris neurons. (A) UMAP plots showing marker genes expression. PNPO labels GABAergic neurons, while ChT labels cholinergic ones. PNPO, pyridoxine-5'-phosphate oxidase and ChT, choline transporter. (B) Upset plot displaying number of cells expressing marker genes used to identified neuronal cell types and their coexpression. Groups are color coded.
Figure 3
Figure 3
Schmidtea mediterranea neurons. (A) UMAP plots showing marker gene expression. VGlut, ChAT, Vmat, Gad, and GlyT label glutamatergic, cholinergic, aminergic, GABAergic and glycinergic neurons, respectively. (B) Upset plot displaying the number of cells in each neuronal category. Coexpression was calculated based on the coexpression of above-mentioned marker genes. Groups are color coded. (C) Heatmap illustrating the expression and coexpression of some neurotransmitter receptors. GLRA2: glycine receptor, alpha 2. GRIK3: glutamate receptor, ionotropic, kainate 3. GABARAP: GABA(A) receptor-associated protein. CHRNA3: cholinergic receptor, nicotinic, alpha 3.DRD3: dopamine receptor D3. Each vertical line represents a cell. Expression is color coded.
Figure 4
Figure 4
Caenorhabditis elegans neurons. (A) Expression of marker genes used to identify neurons based on their neurotransmitter phenotype represented in UMAP plots. VAChT, VGlut, Gad and Vmat label cholinergic, glutamatergic, GABAergic and aminergic neurons, respectively. (B) Upset plot displaying number of cells in each neuronal category. Coexpression was calculated based on the coexpression of above-mentioned marker genes. Groups are color coded.
Figure 5
Figure 5
Drosophila melanogaster neurons. (A) Expression of marker genes used to identify neurons based on their neurotransmitter phenotype in the Drosophila larval brain represented in UMAP plots. Gad1, VGlut, VAChT and Vmat label GABAergic, glutamatergic, cholinergic and aminergic neurons, respectively. (B) Upset plot displaying number of cells in each neuronal category. Neurotransmitter coexpression was calculated based on the overlaps of marker genes mentioned above. Groups are color coded. (C) Expression of the above-mentioned marker genes in the adult brain of D. melanogaster represented in UMAP plots. (D) Upset plot displaying number of cells in each neuronal category. Coexpression was calculated based on the coexpression of above-mentioned marker genes. Groups are color coded. (E) Dual-transmitter neurons are less frequent in the adult brain in comparison to the larval one. Cell numbers are represented as percentages calculated from the total of neurons for each dataset.
Figure 6
Figure 6
Ciona intestinalis neurons. (A) Expression of marker genes used to identify neurons based on their neurotransmitter phenotype represented in UMAP plots. Gad1/2, VAChT and CHAT, and VGlut label GABAergic, cholinergic and glutamatergic neurons, respectively. (B) Neuronal quantification based on the expression of the above-mentioned marker genes shows neurotransmitter coexpression. Upset plot illustrates number of cells for each neuronal category. Groups are color coded.
Figure 7
Figure 7
Danio rerio neurons. (A) Zebrafish neurons can be classified based on the expression of marker genes involved in the biosynthesis and transmission of neurotransmitters. UMAP plot showing the expression of Gad1b, ChT2, VGlut 2a and GlyT1, which label GABAergic, cholinergic, glutamatergic and glycinergic neurons, respectively. (B) Neuronal quantification based on the expression of the above-mentioned marker genes shows neurotransmitter coexpression in the zebrafish brain. Upset plot illustrates number of cells for each neuronal category. Groups are color coded.
Figure 8
Figure 8
Reptile neurons. (A) UMAP plots showing the expression of marker genes used to classify neurons according to their neurotransmitter phenotype in the lizard brain. Gad2 and VGlut1 label GABAergic and glutamatergic neurons, respectively. (B) Neuronal quantification based on the expression of the above-mentioned marker genes shows neurotransmitter coexpression in the lizard brain. Upset plot illustrates number of cells for each neuronal category. Groups are color coded. (C) UMAP plots showing the expression of marker genes used to classify neurons according to their neurotransmitter phenotype in the turtle brain. Gad2 and VGlut1 label GABAergic and glutamatergic neurons, respectively. (D) Neuronal quantification based on the expression of the above-mentioned marker genes shows neurotransmitter coexpression in the turtle brain. Upset plot illustrates number of cells for each neuronal category. Groups are color coded.
Figure 9
Figure 9
Mus musculus neurons. (A) UMAP plots showing the expression of marker genes used to classify neurons according to their neurotransmitter phenotype in the young adult mouse brain. Gad1, Slc17a7 (VGlut1), Gm5741 and Th label GABAergic, glutamatergic, cholinergic and aminergic neurons, respectively. (B) Cell quantification based on the expression of the above-mentioned marker genes shows neurotransmitter coexpression in the young adult mouse brain. Upset plot illustrates number of cells for each neuronal category. Groups are color coded. (C) Expression of the above-mentioned marker genes in the aging mouse brain represented in UMAP plots. (D) Upset plot displaying number of cells in each neuronal category for the aging mouse brain. Coexpression was calculated based on the coexpression of above-mentioned marker genes. Groups are color coded. (E) Dual-transmitter neurons comparison between the young and aging mouse brains indicate that there is no substantial change in terms of dual-transmitter neurons composition, with the sole exception of GABAergic/aminergic neurons that seem to be increase with aging. Cell numbers are represented as percentages calculated from the total of neurons for each dataset.

Similar articles

Cited by

References

    1. Arendt D., Musser J. M., Baker C. V. H., Bergman A., Cepko C., Erwin D. H., et al. . (2016). The origin and evolution of cell types. Nat. Rev. Genet. 17, 744–757. 10.1038/nrg.2016.127 - DOI - PubMed
    1. Beltrán J. Q., Gutiérrez R. (2012). Co-release of glutamate and GABA from single, identified mossy fibre giant boutons. J. Physiol. 590, 4789–4800. 10.1113/jphysiol.2012.236372 - DOI - PMC - PubMed
    1. Brauth S. E., Kitt C. A., Price D. L., Wainer B. H. (1985). Cholinergic neurons in the telencephalon of the reptile Caiman crocodilus. Neurosci. Lett. 58, 235–240. 10.1016/0304-3940(85)90170-3 - DOI - PubMed
    1. Brunet Avalos C., Maier G. L., Bruggmann R., Sprecher S. G. (2019). Single cell transcriptome atlas of the Drosophila larval brain. eLife 8:e50354. 10.7554/eLife.50354 - DOI - PMC - PubMed
    1. Burnstock G. (1976). Do some nerve cells release more than one transmitter? Neuroscience 1, 239–248. 10.1016/0306-4522(76)90054-3 - DOI - PubMed

LinkOut - more resources