

Serum Metabolomics Study of Papillary Thyroid Carcinoma Based on HPLC-Q-TOF-MS/MS
- PMID: 33598460
- PMCID: PMC7882692
- DOI: 10.3389/fcell.2021.593510
Serum Metabolomics Study of Papillary Thyroid Carcinoma Based on HPLC-Q-TOF-MS/MS
Abstract
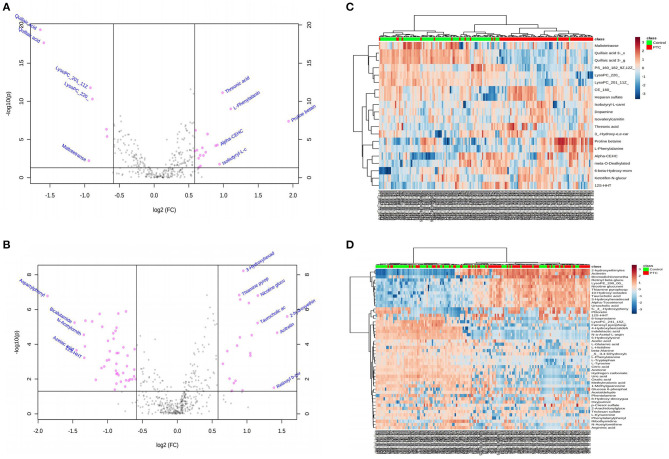
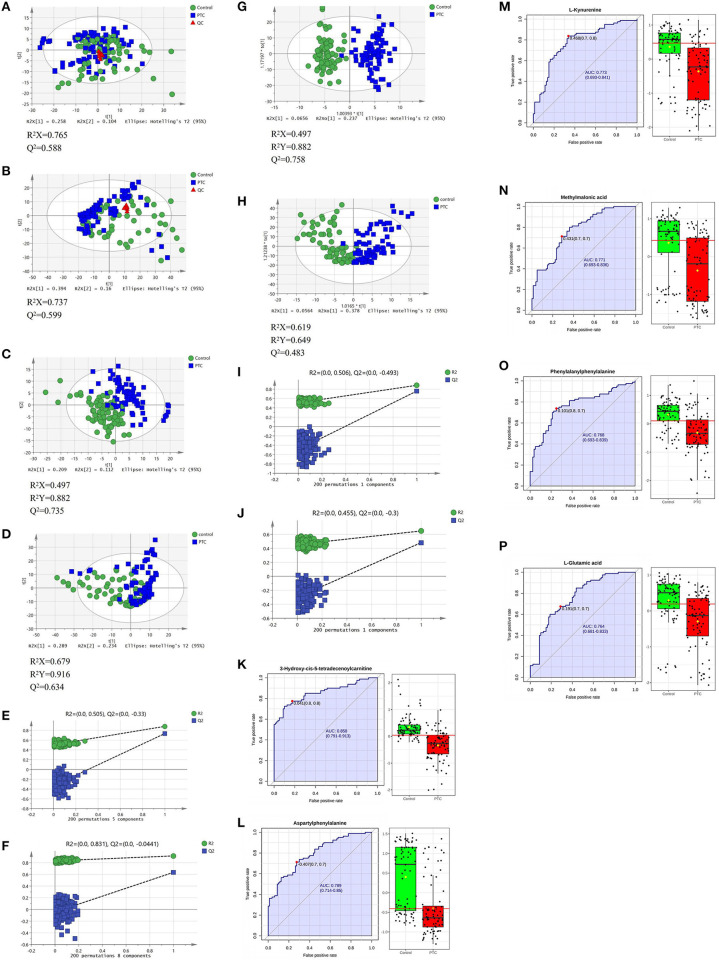
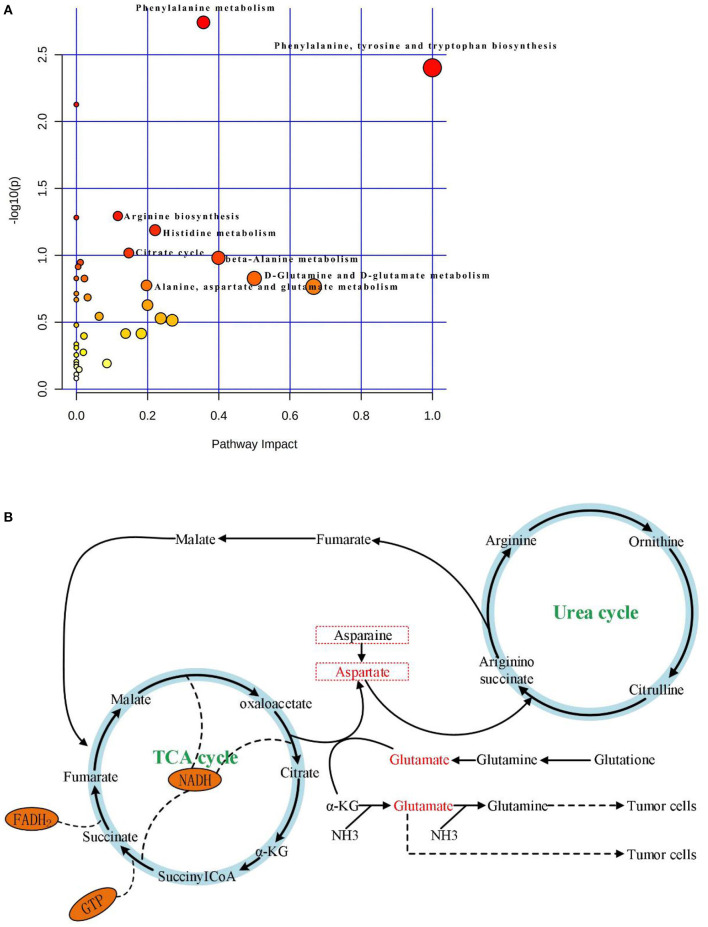
This study examined metabolite profile differences between serum samples of thyroid papillary carcinoma (PTC) patients and healthy controls, aiming to identify candidate biomarkers and pathogenesis pathways in this cancer type. Serum samples were collected from PTC patients (n = 80) and healthy controls (n = 80). Using principal component analysis (PCA), partial least squares discrimination analysis(PLS-DA), orthogonal partial least square discriminant analysis (OPLS-DA), t-tests, and the volcano plot, a model of abnormal metabolic pathways in PTC was constructed. PCA, PLS-DA, and OPLS-DA analysis revealed differences in serum metabolic profiles between the PTC and control group. OPLS-Loading plot analysis, combined with Variable importance in the projection (VIP)>1, Fold change (FC) > 1.5, and p < 0.05 were used to screen 64 candidate metabolites. Among them, 22 metabolites, including proline betaine, taurocholic acid, L-phenylalanine, retinyl beta-glucuronide, alpha-tocotrienol, and threonine acid were upregulated in the PTC group; meanwhile, L-tyrosine, L-tryptophan, 2-arachidonylglycerol, citric acid, and other 42 metabolites were downregulated in this group. There were eight abnormal metabolic pathways related to the differential metabolites, which may be involved in the pathophysiology of PTC. Six metabolites yielded an area under the receiver operating curve of >0.75, specifically, 3-hydroxy-cis-5-tetradecenoylcarnitine, aspartylphenylalanine, l-kynurenine, methylmalonic acid, phenylalanylphenylalanine, and l-glutamic acid. The Warburg effect was observed in PTC. The levels of 3-hydroxy-cis-5-tetradecenoylcarnitine, aspartylphenylalanine, l-kynurenine, methylmalonic acid, phenylalanine, and L-glutamic acid may help distinguish PTC patients from healthy controls. Aspartic acid metabolism, glutamic acid metabolism, urea cycle, and tricarboxylic acid cycle are involved in the mechanism of PTC.
Keywords: metabolite profile; orthogonal partial least square discriminant analysis; principal component analysis; serum samples; thyroid papillary carcinoma.
Copyright © 2021 Du, Fan, Zou, Jiang, Gu, Yu and Zhang.
Conflict of interest statement
The authors declare that the research was conducted in the absence of any commercial or financial relationships that could be construed as a potential conflict of interest.
Figures
Similar articles
-
Experimental study on changes in metabolic mechanism of papillary thyroid carcinoma complicated with Hashimoto's thyroiditis.Heliyon. 2023 Oct 5;9(10):e20661. doi: 10.1016/j.heliyon.2023.e20661. eCollection 2023 Oct. Heliyon. 2023. PMID: 37860538 Free PMC article.
-
Metabolomics of papillary thyroid carcinoma tissues: potential biomarkers for diagnosis and promising targets for therapy.Tumour Biol. 2016 Aug;37(8):11163-75. doi: 10.1007/s13277-016-4996-z. Epub 2016 Mar 2. Tumour Biol. 2016. PMID: 26935059
-
Metabolic changes associated with papillary thyroid carcinoma: A nuclear magnetic resonance-based metabolomics study.Int J Mol Med. 2018 May;41(5):3006-3014. doi: 10.3892/ijmm.2018.3494. Epub 2018 Feb 16. Int J Mol Med. 2018. PMID: 29484373
-
[Screening of serum oxysterol biomarkers for colon cancer by liquid chromatography-tandem mass spectrometry].Se Pu. 2022 Jun;40(6):541-546. doi: 10.3724/SP.J.1123.2022.01001. Se Pu. 2022. PMID: 35616199 Free PMC article. Chinese.
-
Targeted metabolomics analysis for serum Helicobacter pylori-positive based on liquid chromatography-tandem mass spectrometry.Biomed Chromatogr. 2023 Jun;37(6):e5622. doi: 10.1002/bmc.5622. Epub 2023 Apr 9. Biomed Chromatogr. 2023. PMID: 36898359
Cited by
-
Untargeted metabolomic profiling of sepsis-induced cardiac dysfunction.Front Endocrinol (Lausanne). 2023 Feb 16;14:1060470. doi: 10.3389/fendo.2023.1060470. eCollection 2023. Front Endocrinol (Lausanne). 2023. PMID: 36875476 Free PMC article.
-
Differential Chemical Components Analysis of Periplocae Cortex, Lycii Cortex, and Acanthopanacis Cortex Based on Mass Spectrometry Data and Chemometrics.Molecules. 2024 Aug 11;29(16):3807. doi: 10.3390/molecules29163807. Molecules. 2024. PMID: 39202886 Free PMC article.
-
Experimental study on changes in metabolic mechanism of papillary thyroid carcinoma complicated with Hashimoto's thyroiditis.Heliyon. 2023 Oct 5;9(10):e20661. doi: 10.1016/j.heliyon.2023.e20661. eCollection 2023 Oct. Heliyon. 2023. PMID: 37860538 Free PMC article.
-
Integrated proteogenomic and metabolomic characterization of papillary thyroid cancer with different recurrence risks.Nat Commun. 2024 Apr 12;15(1):3175. doi: 10.1038/s41467-024-47581-1. Nat Commun. 2024. PMID: 38609408 Free PMC article.
-
Integrated Metabolomics and Network Pharmacology Study on the Mechanism of Rehmanniae radix Extract for Treating Thrombosis.Drug Des Devel Ther. 2024 Oct 31;18:4859-4875. doi: 10.2147/DDDT.S475838. eCollection 2024. Drug Des Devel Ther. 2024. PMID: 39497835 Free PMC article.
References
LinkOut - more resources
Full Text Sources
Other Literature Sources