. 2021 Feb 1:9:623829.
doi: 10.3389/fcell.2021.623829. eCollection 2021.

ALMS1 Regulates TGF-β Signaling and Morphology of Primary Cilia

Affiliations

ALMS1 Regulates TGF-β Signaling and Morphology of Primary Cilia

María Álvarez-Satta et al. Front Cell Dev Biol. .

Abstract

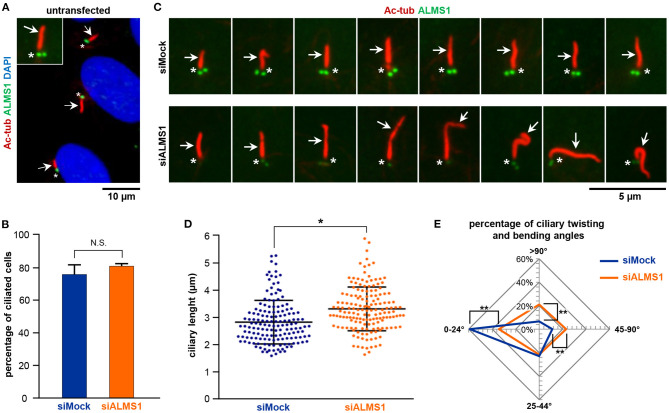
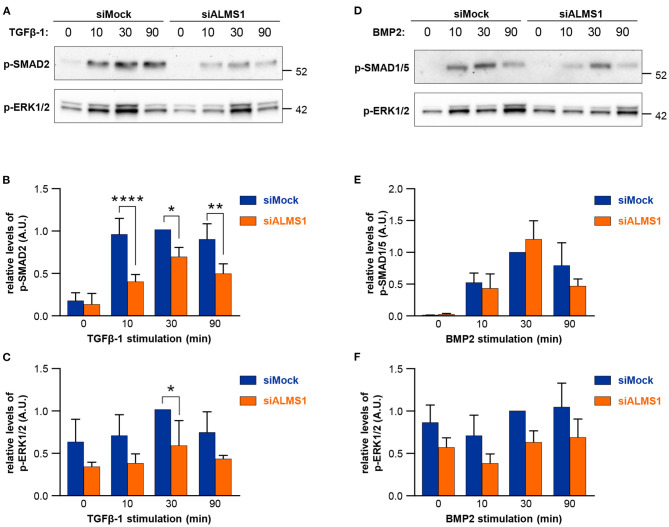
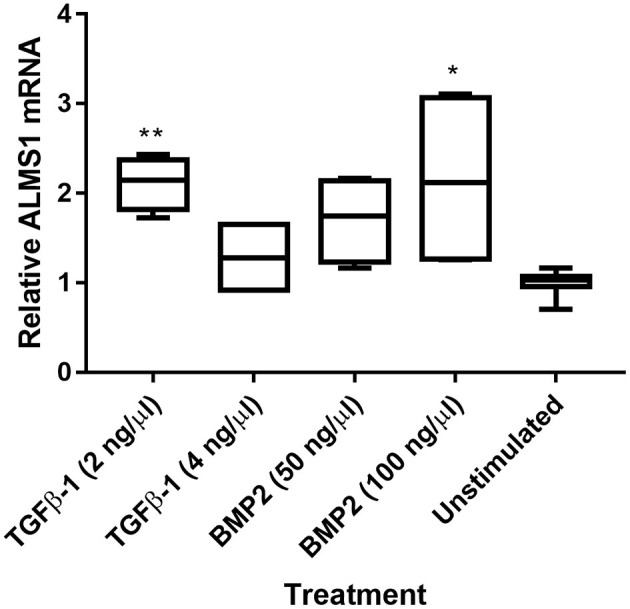
In this study, we aimed to evaluate the role of ALMS1 in the morphology of primary cilia and regulation of cellular signaling using a knockdown model of the hTERT-RPE1 cell line. ALMS1 depletion resulted in the formation of longer cilia, which often displayed altered morphology as evidenced by extensive twisting and bending of the axoneme. Transforming growth factor beta/bone morphogenetic protein (TGF-β/BMP) signaling, which is regulated by primary cilia, was similarly affected by ALMS1 depletion as judged by reduced levels of TGFβ-1-mediated activation of SMAD2/3. These results provide novel information on the role of ALMS1 in the function of primary cilia and processing of cellular signaling, which when aberrantly regulated may underlie Alström syndrome.

Keywords: ALMS1; Alström syndrome (AS); TGF-β/BMP signaling; ciliary length; ciliary morphology; ciliopathies; hTERT RPE-1 cells; primary cilium.


Conflict of interest statement

The authors declare that the research was conducted in the absence of any commercial or financial relationships that could be construed as a potential conflict of interest.

Figures

Figure 1
Figure 1
ALMS1 knockdown increases the number of aberrant cilia and ciliary length. (A) Representative immunofluorescence image of primary cilia in untransfected cells. Primary cilia (arrows) are stained in red, ALMS1 protein (asterisks) in green and cell nuclei in blue (DAPI). A zoomed cilium is also shown. (B) Percentage of ciliated cells in control (siMock) and silenced (siALMS1) cells (n = 3). (C) Representative immunofluorescence images of primary cilia in control and silenced cells showing different aberrant morphologies (n = 3). (D) Dot plot representing each of the measurements of ciliary length for control and silenced cells; n = 3 with at least 50 cilia measured per biological replicate. (E) Radar plot of the percentage of ciliary twisting and its bending angles between control and silenced cells (n = 3). Error bars represent mean ± SD (*p < 0.05, **p < 0.01).
Figure 2
Figure 2
Transient ALMS1 knockdown is associated with a decrease in SMAD2 phosphorylation following TGF-β1 stimulation and a decrease in ERK1/2 phosphorylation after BMP-2 treatment. (A) Representative immunoblot for p-SMAD2 and p-ERK1/2 proteins in control (siMock) and silenced (siALMS1) RPE-1 cells after TGF-β1 stimulation at 0, 10, 30, and 90 min (n = 4). (B) Bar plot of the pSMAD2 normalized protein levels after TGF-β1 stimulation (n = 4). (C) Bar plot of the normalized p-ERK1/2 protein levels after TGF-β1 stimulation (n = 4). (D) Representative immunoblot for p-SMAD1/5 and p-ERK1/2 proteins in control (siMock) and silenced (siALMS1) RPE-1 cells after BMP-2 stimulation at 0, 10, 30, and 90 min (n = 3). (E). Bar plot of the pSMAD1/5 normalized protein levels after BMP-2 stimulation (n = 3). (F) Bar plot of the normalized pERK1/2 protein levels after BMP-2 stimulation (n = 3). All protein quantification data are presented as Arbitrary Units (AU) (*p < 0.05, **p < 0.01, ****p < 0.0001).
Figure 3
Figure 3
ALMS1 expression is enhanced upon stimulation with TGF-B/BMP in HeLa cells. Treatments with TGFβ-1 (2 ng/Ml, p = 0.0073, n = 2) and BMP2 (100 ng/mL, p = 0.02, n = 2) showed statistical significance after a Kruskal-Wallis test with Dunn's correction in comparison with the unstimulated cells (n = 4). *p < 0.05, **p < 0.01.

References

    1. Álvarez-Satta M., Castro-Sánchez S., Valverde D. (2015). Alström syndrome: current perspectives. App. Clin. Genet. 8, 171–179. 10.2147/TACG.S56612 - DOI - PMC - PubMed
    1. Balogh P., Katz S., Kiss A. L. (2013). The role of endocytic pathways in TGF-β signaling. Pathol. Oncol. Res. 19, 141–148. 10.1007/s12253-012-9595-8 - DOI - PubMed
    1. Bradford M. M. (1976). A rapid and sensitive method for the quantitation of microgram quantities of protein utilizing the principle of protein-dye binding. Anal. Biochem. 72, 248–254. 10.1016/0003-2697(76)90527-3 - DOI - PubMed
    1. Chen J. H., Geberhiwot T., Barrett T. G., Paisey R., Semple R. K. (2017). Refining genotype-phenotype correlation in Alström syndrome through study of primary human fibroblasts. Mol. Genet. Genomic. Med. 5, 390–404. 10.1002/mgg3.296 - DOI - PMC - PubMed
    1. Christensen S. T., Morthorst S. K., Mogensen J. B., Pedersen L. B. (2017). Primary cilia and coordination of receptor tyrosine kinase (RTK) and transforming growth factor b (TGF-b) signaling. Cold Spring Harb. Perspect. Biol. 9:a028167. 10.1101/cshperspect.a028167 - DOI - PMC - PubMed

LinkOut - more resources