. 2021 Feb 1:8:624714.
doi: 10.3389/fcvm.2021.624714. eCollection 2021.

Identification of Potential Biomarkers and Immune Infiltration Characteristics in Idiopathic Pulmonary Arterial Hypertension Using Bioinformatics Analysis

Affiliations

Identification of Potential Biomarkers and Immune Infiltration Characteristics in Idiopathic Pulmonary Arterial Hypertension Using Bioinformatics Analysis

Haowei Zeng et al. Front Cardiovasc Med. .

Abstract

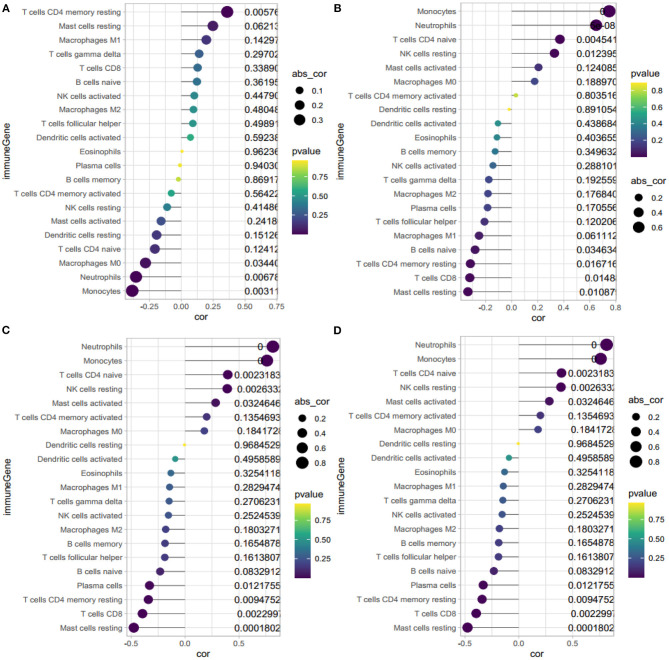
Objectives: Idiopathic pulmonary arterial hypertension (IPAH) is a rare but severe lung disorder, which may lead to heart failure and early mortality. However, little is known about the etiology of IPAH. Thus, the present study aimed to establish the differentially expressed genes (DEGs) between IPAH and normal tissues, which may serve as potential prognostic markers in IPAH. Furthermore, we utilized a versatile computational method, CIBERSORT to identify immune cell infiltration characteristics in IPAH. Materials and Methods: The GSE117261 and GSE48149 datasets were obtained from the Gene Expression Omnibus database. The GSE117261 dataset was adopted to screen DEGs between IPAH and the control groups with the criterion of |log2 fold change| ≥ 1, adjusted P < 0.05, and to further explore their potential biological functions via Gene Ontology analysis, Kyoto Encyclopedia of Genes and Genomes Pathway analysis, and Gene Set Enrichment Analysis. Moreover, the support vector machine (SVM)-recursive feature elimination and the least absolute shrinkage and selection operator regression model were performed jointly to identify the best potential biomarkers. Then we built a regression model based on these selected variables. The GSE48149 dataset was used as a validation cohort to appraise the diagnostic efficacy of the SVM classifier by receiver operating characteristic (ROC) analysis. Finally, immune infiltration was explored by CIBERSORT in IPAH. We further analyzed the correlation between potential biomarkers and immune cells. Results: In total, 75 DEGs were identified; 40 were downregulated, and 35 genes were upregulated. Functional enrichment analysis found a significantly enrichment in heme binding, inflammation, chemokines, cytokine activity, and abnormal glycometabolism. HBB, RNASE2, S100A9, and IL1R2 were identified as the best potential biomarkers with an area under the ROC curve (AUC) of 1 (95%CI = 0.937-1.000, specificity = 100%, sensitivity = 100%) in the discovery cohort and 1(95%CI = 0.805-1.000, specificity = 100%, sensitivity = 100%) in the validation cohort. Moreover, immune infiltration analysis by CIBERSORT showed a higher level of CD8+ T cells, resting memory CD4+ T cells, gamma delta T cells, M1 macrophages, resting mast cells, as well as a lower level of naïve CD4+ T cells, monocytes, M0 macrophages, activated mast cells, and neutrophils in IPAH compared with the control group. In addition, HBB, RNASE2, S100A9, and IL1R2 were correlated with immune cells. Conclusion: HBB, RNASE2, S100A9, and IL1R2 were identified as potential biomarkers to discriminate IPAH from the control. There was an obvious difference in immune infiltration between patient with IPAH and normal groups.

Keywords: bioinformatics; biomarkers; idiopathic pulmonary arterial hypertension; immune infiltration; inflammation.


Conflict of interest statement

The authors declare that the research was conducted in the absence of any commercial or financial relationships that could be construed as a potential conflict of interest.

Figures

Figure 1
Figure 1
The box diagram of expression profile before and after normalization. GSE117261 expression profile before (A) and after (B) normalization; GSE48149 expression profile before (C) and after (D) normalization.
Figure 2
Figure 2
The volcano map of DEGs. The plot compared the DEGs between IPAH patients and controls from the GSE117261 dataset. The red dots represent the down-regulated DEGs; the green dots represent up-regulated DEGs; gray dots indicate the remaining genes that were not significantly changed. Genes signed in the plot are the top ten genes with the most significant logFC.
Figure 3
Figure 3
The functional enrichment analysis of DEGs. (A) The GO enrichment; (B) The KEGG enrichment; (C,D) The GSEA enrichmen analysis.
Figure 4
Figure 4
Establishment of prognostic genes signature by LASSO regression analysis and SVM-RFE algorithm. (A) LASSO coefficient profiles of five genes. The dotted vertical line is the value selected using the 10-fold cross-validation in (B), for which the optimal lambda λ) resulted in five non-zero coefficients. (B) Identification of the optimal penalization coefficient (λ) in the Lasso model used 10-fold cross-validation and the minimum absolute contraction criterion. (C) A plot of feature gene selection by SVM-RFE. The blue dot represents the best eight variables; (D) The Venn plot of overlapped feature genes between LASSO regression analysis and SVM-RFE algorithm.
Figure 5
Figure 5
The receiver operating characteristic (ROC) curve of the diagnostic effectiveness of the feature genes. (A–E) ROC curve of HBB, RNASE2, S100A9, IL1R2, and support vector machine (SVM) classifier in GSE117261; (F–J) ROC curve of HBB, RNASE2, S100A9, IL1R2, and SVM classifier in GSE48149.
Figure 6
Figure 6
The heat map of DEGs in discovery cohort (A) and validation cohort (B) between IPAH and the control group. The selected four genes were marked as red color; (C) The expression value of the identified four genes in the validation cohort.
Figure 7
Figure 7
The landscape of immune infiltration between IPAH and normal controls. (A) The relative percentage of 22 types of immune cells; (B) The heat map of 22 types of immune cells; (C) The difference of immune infiltration between IPAH and normal controls. The normal control group was marked as blue color and IPAH group was marked as red color. P-values < 0.05 were considered as statistically significant; (D) Correlation heatmap of the 22 types of immune cells. Blue presents a negative correlation, red represents a positive correlation, the darker the color, the stronger the correlation.
Figure 8
Figure 8
Correlation between HBB, RNASE2, S100A9, IL1R2 and immune cells. (A) Correlation between HBB and immune cells. (B) Correlation between RNASE2 and immune cells. (C) Correlation between S100A9 and immune cells. (D) Correlation between IL1R2 and immune cells. The size of the dots represents the strength of correlation between gene biomarkers and immune cells. The color of the dots represents the P-value.

References

    1. Nazzareno G, Marc H, Jean-Luc V, Simon G, Irene L, Adam T, et al. 2015 ESC/ERS guidelines for the diagnosis and treatment of pulmonary hypertension. Rev Esp Cardiol. (2016) 69:177 10.1016/j.rec.2016.01.002 - DOI - PubMed
    1. Kanwar M, Raina A, Passineau M, Benza R. Idiopathic pulmonary arterial hypertension: evolving therapeutic strategies. Semin Respir Crit Care Med. (2017) 38:606–8. 10.1055/s-0037-1606317 - DOI - PubMed
    1. Cao JY, Wales KM, Cordina R, Lau EMT, Celermajer DS. Pulmonary vasodilator therapies are of no benefit in pulmonary hypertension due to left heart disease: a meta-analysis. Int J Cardiol. (2018) 273:213–20. 10.1016/j.ijcard.2018.09.043 - DOI - PubMed
    1. Spiekerkoetter E, Kawut SM, de Jesus Perez VA. New and emerging therapies for pulmonary arterial hypertension. Annu Rev Med. (2019) 70:45–59. 10.1146/annurev-med-041717-085955 - DOI - PMC - PubMed
    1. Aldred MA, Vijayakrishnan J, James V, Soubrier F, Gomez-Sanchez MA, Martensson G, et al. BMPR2 gene rearrangements account for a significant proportion of mutations in familial and idiopathic pulmonary arterial hypertension. Hum Mutat. (2006) 27:212–3. 10.1002/humu.9398 - DOI - PubMed