

Evaluation of SUVlean consistency in FDG and PSMA PET/MR with Dixon-, James-, and Janma-based lean body mass correction
- PMID: 33598849
- PMCID: PMC7889776
- DOI: 10.1186/s40658-021-00363-w
Evaluation of SUVlean consistency in FDG and PSMA PET/MR with Dixon-, James-, and Janma-based lean body mass correction
Abstract
Purpose: To systematically evaluate the consistency of various standardized uptake value (SUV) lean body mass (LBM) normalization methods in a clinical positron emission tomography/magnetic resonance imaging (PET/MR) setting.
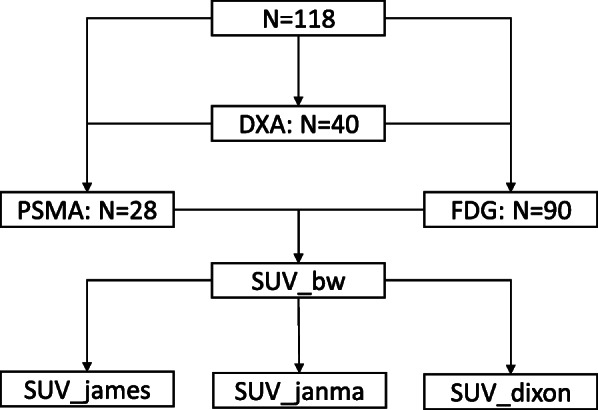
Methods: SUV of brain, liver, prostate, parotid, blood, and muscle were measured in 90 18F-FDG and 28 18F-PSMA PET/MR scans and corrected for LBM using the James, Janma (short for Janmahasatian), and Dixon approaches. The prospective study was performed from December 2018 to August 2020 at Shanghai East Hospital. Forty dual energy X-ray absorptiometry (DXA) measurements of non-fat mass were used as the reference standard. Agreement between different LBM methods was assessed by linear regression and Bland-Altman statistics. SUV's dependency on BMI was evaluated by means of linear regression and Pearson correlation.
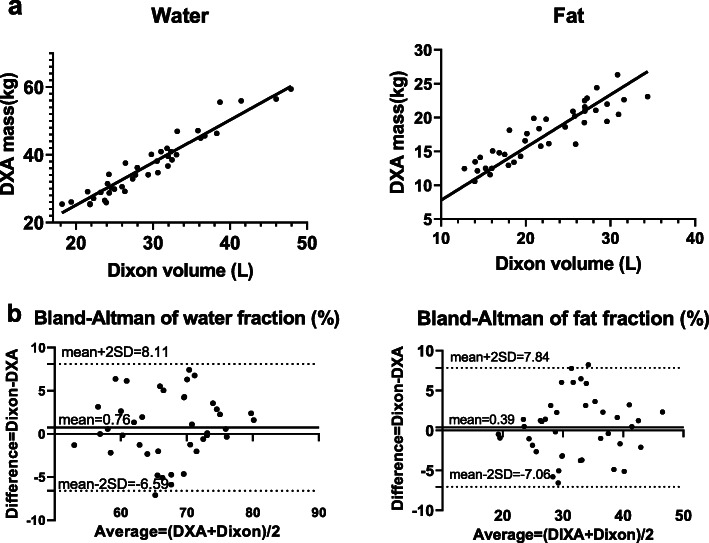
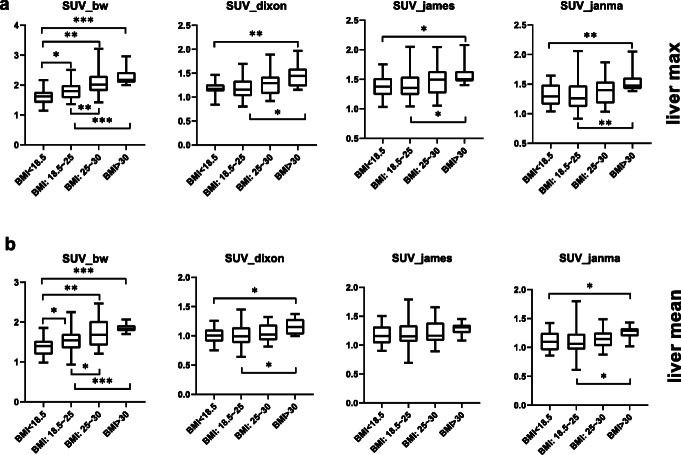
Results: Compared to DXA, the Dixon approach presented the least bias in LBM/weight% than James and Janma models (bias 0.4±7.3%, - 8.0±9.4%, and - 3.3±8.3% respectively). SUV normalized by body weight (SUVbw) was positively correlated with body mass index (BMI) for both FDG (e.g., liver: r = 0.45, p < 0.001) and PSMA scans (r = 0.20, p = 0.31), while SUV normalized by lean body mass (SUVlean) revealed a decreased dependency on BMI (r = 0.22, 0.08, 0.14, p = 0.04, 0.46, 0.18 for Dixon, James, and Janma models, respectively). The liver SUVbw of obese/overweight patients was significantly larger (p < 0.001) than that of normal patients, whereas the bias was mostly eliminated in SUVlean. One-way ANOVA showed significant difference (p < 0.001) between SUVlean in major organs measured using Dixon method vs James and Janma models.
Conclusion: Significant systematic variation was found using different approaches to calculate SUVlean. A consistent correction method should be applied for serial PET/MR scans. The Dixon method provides the most accurate measure of LBM, yielding the least bias of all approaches when compared to DXA.
Keywords: Lean body mass; PET/MR; SUV.
Conflict of interest statement
Qiaoyi Xue, Zhe Wang, Jianmin Yuan, Hui Liu, and Lingzhi Hu are the employees of United Imaging Healthcare. The other authors declare that they have no conflict of interest.
Figures
References
-
- Hoekstra CJ, Paglianiti I, Hoekstra OS, Smit EF, Postmus PE, Teule GJJ, et al. Monitoring response to therapy in cancer using [18F]-2-fluoro-2-deoxy-d-glucose and positron emission tomography: an overview of different analytical methods. Eur J Nucl Med. 2000;27:731–743. doi: 10.1007/s002590050570. - DOI - PubMed
Grants and funding
LinkOut - more resources
Full Text Sources
Other Literature Sources
Miscellaneous
