. 2021 Mar;25(6):3124-3135.
doi: 10.1111/jcmm.16377. Epub 2021 Feb 17.

Bortezomib suppresses self-renewal and leukemogenesis of leukemia stem cell by NF-ĸB-dependent inhibition of CDK6 in MLL-rearranged myeloid leukemia

Affiliations

Bortezomib suppresses self-renewal and leukemogenesis of leukemia stem cell by NF-ĸB-dependent inhibition of CDK6 in MLL-rearranged myeloid leukemia

Bin Zhou et al. J Cell Mol Med. 2021 Mar.

Abstract

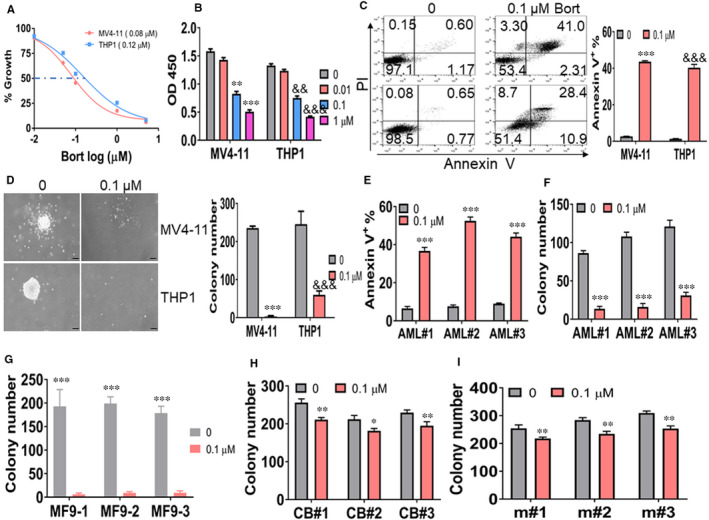
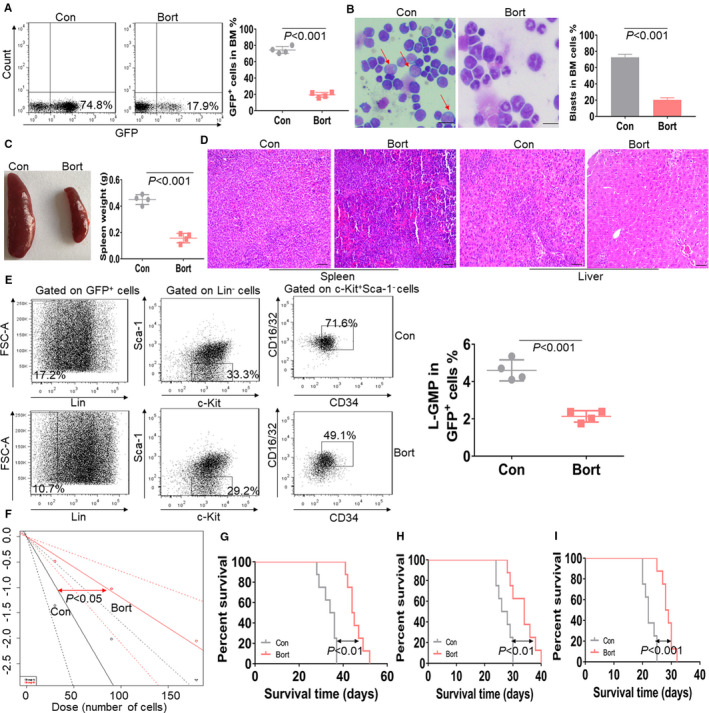
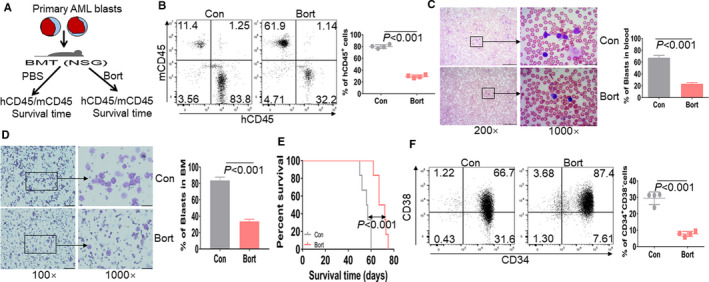
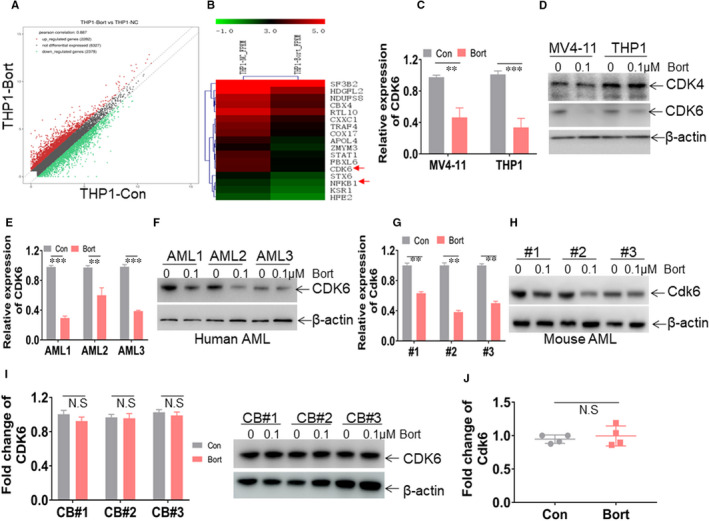
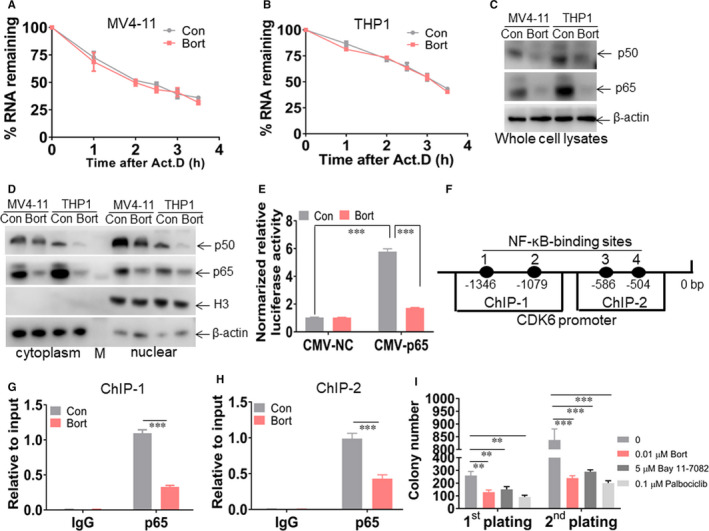
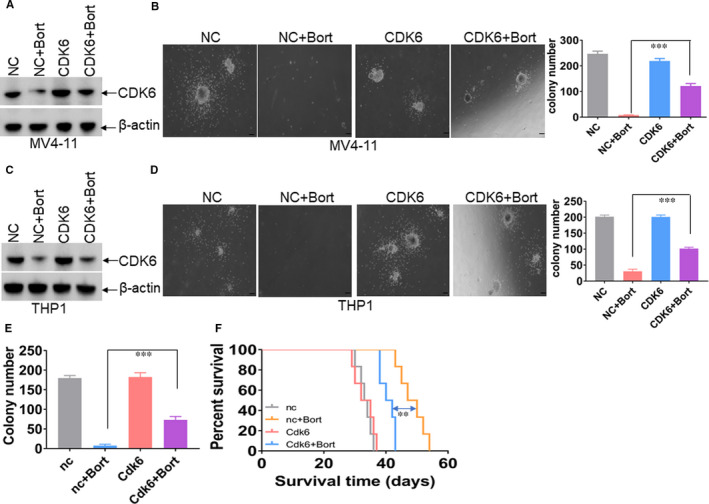
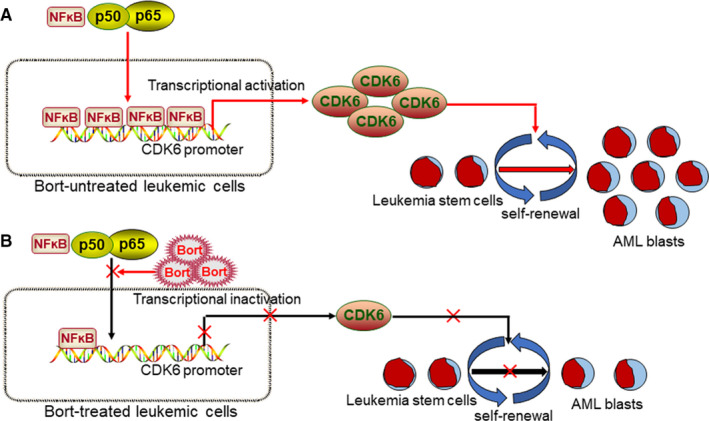
Acute myeloid leukaemia (AML) with chromosomal rearrangements involving the H3K4 methyltransferase mixed-lineage leukaemia (MLL) is an aggressive subtype with low overall survival. Bortezomib (Bort) is first applied in multiple myeloma. However, whether bort possesses anti-self-renewal and leukemogenesis of leukaemia stem cell (LSC) in AML with MLL rearrangements is still unclear. Here, we found that bort suppressed cell proliferation and decreased colony formation in human and murine leukaemic blasts. Besides, bort reduced the frequency and function of LSC, inhibited the progression, and extended the overall survival in MLL-AF9 (MF9) -transformed leukaemic mice. Furthermore, bort decreased the percentage of human LSC (CD34+ CD38- ) cells and extended the overall survival in AML blasts-xenografted NOD/SCID-IL2Rγ (NSG) mice. Mechanistically, cyclin dependent kinase 6 (CDK6) was identified as a bort target by RNA sequencing. Bort reduced the expressions of CDK6 by inhibiting NF ĸB recruitment to the promoter of CDK6, leading to the abolishment of NF ĸB DNA-binding activity for CDK6 promoter. Overexpression of CDK6 partially rescued bort-induced anti-leukemogenesis. Most importantly, bort had little side-effect against the normal haematological stem and progenitor cell (HSPC) and did not affect CDK6 expression in normal HSPC. In conclusion, our results suggest that bort selectively targets LSC in MLL rearrangements. Bort might be a prospective drug for AML patients bearing MLL rearrangements.

Keywords: Bortezomib; MLL rearrangements; cyclin dependent kinase 6; leukaemia stem cell.


Conflict of interest statement

The authors declare that they have no competing interests.

Figures

FIGURE 1
FIGURE 1
Anti‐leukemogenesis by bortezomib (bort) in leukaemic cells. A, MV4‐11 and THP1 cells were treated with different concentrations of bort for 24 h. Cell growth was assessed by CCK‐8 assay. A 50% inhibitory concentration (IC50) of bort was calculated. B, MV4‐11 and THP1 cells were incubated with indicated concentrations of bort for 24 h. CCK‐8 assay was performed to assess cell proliferation. C, Apoptosis was measured by Annexin V/PI staining in MV4‐11 and THP1 cells, treated with 0.1 µmol/L bort for 24 h. Shown are the representative plots (left) and statistical analysis of Annexin V+ cells (right). *** and &&& < .001 vs untreated cells. (D) MV4‐11 and THP1 cells (2 × 103) were incubated with or without bort (0.1 µmol/L) and were plated on methylcellulose medium. Colony formation was counted after ten days. Shown are representative pictures of colonies (left) and statistical analysis of colony number (right). The bar represents 10 µm, and these images were amplified 100 folds. *** and &&& < .001 vs untreated cells. (E) Apoptosis was measured in three primary blasts from AML patients with positive MLL‐AF9, which were treated with or without 0.1 µmol/L bort for 24 h. *** < .001 vs untreated cells. (F) CD34+ cells (4 × 103) were isolated from BM of three AML patients in Figure 1D, followed by treatment with or without bort (0.1 µmol/L) and plating on methylcellulose medium. Colony formation was counted after ten days. *** < .001 vs untreated cells. G, BM GFP+ cells were isolated from MLL‐AF9 (MF9)‐induced leukaemic mice and were treated with or without bort (0.1 µmol/L). GFP+ cells (2 × 103) were plated on methylcellulose medium, and colony formation was counted after ten days. *** < .001 vs untreated cells. H, Human CD34+ cells (4 × 103) were isolated from three cord blood, followed by treatment with or without bort (0.1 µmol/L) and plating on methylcellulose medium. Colony formation was counted after ten days. (I) Murine c‐Kit+ cells were isolated from BM of three normal C57/B6 mice. c‐Kit+ cells (4 × 103) were plated on methylcellulose medium treated with or without bort (0.1 µmol/L), and colony formation was counted after ten days
FIGURE 2
FIGURE 2
Anti‐self‐renewal and leukemogenesis abilities by bort in MLL‐AF9‐transformed mice model. A, GFP+ cells were measured in BM mononuclear cells isolated from bort‐treated (n = 4) or not‐treated MLL‐AF9‐transformed mice (n = 4), when the control mice developed full‐blown leukaemia. Shown are the representative plots (left) and statistical analysis of GFP+ cells (right). B, A representative image of BM smear by Wright‐Giemsa stain in MLL‐AF9‐transformed mice treated with or without bort (left) and statistical analysis of average leukaemia blasts (right). The bar represents 10 µm, and these images were amplified 200 folds. ** P <.01 vs vehicle mice. C, A representative image of the spleen (left) and statistical analysis of spleen weight (right) in the control mice (n = 4) and bort‐treated mice (n = 4). D, The representative images of spleen and liver tissues from the control mice and bort‐treated mice. The bar represents 10 µm. E, The frequencies of L‐GMP cells were measured in the control mice (n = 4) and bort‐treated mice (n = 4). Shown are the representative plots (left) and statistical analysis of L‐GMP cells (right). (F) Limiting dilution assay of BM GFP+ cells from control (n = 8) and bort‐treated mice (n = 8). The frequency of L‐GMP cells and P‐value were calculated by L‐calc software. G–I, Overall survival was analysed in the primary BMT (G, n = 8), second BMT (H, n = 8), and tertiary BMT (I, n = 8) of MLL‐AF9‐induced leukaemic mice treated with bort or not
FIGURE 3
FIGURE 3
Anti‐leukemogenesis by bort in primary AML blasts‐xenografted mice. A, A schematic outline of the in vivo experiment using AML blasts‐xenografted NSG mice treated with bort or not. B, Human CD45 cells (hCD45) and murine CD45 (mCD45) were measured in peripheral blood from AML blasts‐transplanted NSG mice treated with (n = 4) or without bort (n = 4). Shown are the representative plots (Left) and statistical analysis of hCD45+ cells/(hCD45++mCD45+) (Right). C and D, Leukaemic blasts were evaluated by Wright‐Giemsa stain in peripheral blood (C) and BM (D) when the control mice became moribund. The bar represents 10 µm. E, Overall survival for THP1‐xenografted NSG mice treated with (n = 6) or without bort (n = 6). F, CD34+ CD38 cells gated on hCD45 were measured in peripheral blood from AML blasts‐transplanted NSG mice treated with (n = 4) or without bort (n = 4). Shown are the representative plots (Left) and statistical analysis of CD34+ CD38 cells (Right)
FIGURE 4
FIGURE 4
CDK6 is a target by bort. A, RNA sequencing from THP1 cells treated with or without bort was performed for selecting potential target genes by bort. Scatter plots were indicated for the up‐regulated genes (red plots) and down‐regulated genes (green plots) above 2‐fold or below 2‐fold by bort. B, Heatmap representation of down‐regulated genes by bort. Shown is CDK6, which is negatively regulated by bort. C and D, The transcript (C) and protein expressions (D) of CDK6 were measured in MV4‐11 and THP1 cells treated with bort (0.1 µmol/L) or not for 24 h. ** < .01 and *** < .001 vs untreated cells. (E and F) The transcript (E) and protein expressions (F) of CDK6 were assessed in BM blasts from the same three AML patients in Figure 1D. ** < .01 and*** P<0.001 vs untreated cells. (G and H) BM GFP+ cells were isolated from three MLL‐AF9‐transformed leukaemia mice treated with or without bort for the evaluation of transcript (G) and protein expressions (H) of Cdk6. ** < .01 vs untreated cells. (I) CDK6 transcripts and protein expressions were measured in human CD34+ cells from cord blood (CB), treated with or without bort (0.1 µmol/L) for 24 h. (J) Normal C57/B6 mice were intraperitoneally injected with 100 μL PBS as the control group (n = 4) and with bort as the experimental group (n = 4). After treatment for four weeks, Cdk6 transcripts were measured in BM c‐Kit+ cells
FIGURE 5
FIGURE 5
Bort inhibits NF‐ĸB p65 recruitment to CDK6 promoter. A and B, MV4‐11 and THP1 cells were treated with or without bort at 24 h, followed by incubation of actinomycin D (2 µg/mL) for the indicated times. Cellular mRNA was extracted, and qRT‐PCR was performed to assess the half‐lives of CDK6 mRNA. C, Western blot for p65 and p50 in the whole‐cell lysates from MV4‐11 and THP1 cells, which were incubated with or without 0.1 µmol/L bort for 24 h. D, Western blot for p65 and p50 in the cytoplasm and nucleus from MV4‐11 and THP1 cells, which were incubated with or without 0.1 µmol/L bort for 24 h. E, 293T cells were transduced with pCMV‐p65 (0.5 µg) or pCMV‐NC (0.5 µg), together with pProUTR‐Reporter plasmid carrying five NF ĸB binding motifs. After transfection for 24 h, 293T cells were treated with or without bort for 24 h. Both firefly and renilla luciferase activities were measured in these cells. Histograms illustrate firefly luciferase activities normalized to renilla luciferase activities. Normalized luciferase activity of NC‐transfected cells was arbitrarily set to 1.0. F, A schematic representation of the CDK6 promoter with four potential NF‐ĸB‐binding sites indicated by a dark oval. ChIP‐1 and ChIP‐2 represent the sequence for different primers. G and H, Soluble chromatin from THP1 cells treated with or without bort was immunoprecipitated with an anti‐p65 antibody. Immunoprecipitated DNA was analysed by qPCR. ChIP‐1 and ChIP‐2 represent two different primers to amplify immunoprecipitated DNA. (I) THP1 cells (2 × 103) incubated with bort (0.01 μmol/L), CDK6 inhibitor Palbociclib (0.1 μmol/L), and NF‐ĸB inhibitor Bay 11‐7082 (5.0 μmol/L) were seeded in methylcellulose medium. Colony formation was counted after ten days. After first plating, untreated and treated THP1 cells (1 × 103) were seeded in methylcellulose medium for second assay. ** < .01 and *** < .001 vs untreated cells
FIGURE 6
FIGURE 6
Overexpression of CDK6 partially blocks bort‐induced anti‐leukemogenesis. A and C, Western blot was performed to measure the protein expressions of CDK6 in MV4‐11 and THP1 cells, which were transduced with lentiviral vector overexpressing CDK6 (LVX‐CDK6) or negative control (LVX‐NC), followed by puromycin selection. B and D, Colony formation was counted in CDK6‐or NC‐transduced MV4‐11 (2,000) and THP1 cells (2,000), followed by the treatment of bort (0.1 µmol/L) or not. *** P <.001 vs untreated cells. E, BM GFP+ cells were isolated from MLL‐AF9‐transformed mice and then were transduced with lentiviral vector overexpressing Cdk6 or NC, followed by puromycin selection. Colony formation was counted in Cdk6‐or nc‐transduced GFP+ cells (2,000), which were treated by bort (0.1 µmol/L) or not. *** P <.001 vs untreated cells. F, The same amounts of Cdk6‐or nc‐transduced GFP+ cells plus a radioprotective dose of whole BM cells were transplanted in lethally irradiated C57BL/6J mice, which were intraperitoneally injected with bort or not (n = 6 for each group). Overall survival time was counted in Cdk6‐or nc‐transduced leukaemic mice treated with or without bort. ** P < .01 vs untreated cells
FIGURE 7
FIGURE 7
Bort reduces the expression of CDK6 by inhibiting NF ĸB p65 recruitment to CDK6 promoter. A, Without bort, NF ĸB p65 is recruited to CDK6 promoter to activate the expression of CDK6 in leukaemic cells. CDK6 facilitates the proliferation and self‐renewal of LSC. B, Bort treatment inhibits NF ĸB p65 recruitment to CDK6 promoter, resulting in the reduction of CDK6 and finally suppressing the proliferation and self‐renewal of LSC

Similar articles

Cited by

References

    1. Zheng PZ, Wang KK, Zhang QY, et al. Systems analysis of transcriptome and proteome in retinoic acid/arsenic trioxide‐induced cell differentiation/apoptosis of promyelocytic leukemia. Proc Natl Acad Sci U S A. 2005;102:7653‐7658. - PMC - PubMed
    1. Krivtsov AV, Armstrong SA. MLL translocations, histone modifications and leukaemia stem‐cell development. Nat Rev Cancer. 2007;7:823‐833. - PubMed
    1. Krivtsov AV, Twomey D, Feng Z, et al. Transformation from committed progenitor to leukaemia stem cell initiated by MLL‐AF9. Nature. 2006;442:818‐822. - PubMed
    1. Kumar AR, Hudson WA, Chen W, et al. Hoxa9 influences the phenotype but not the incidence of Mll‐AF9 fusion gene leukemia. Blood. 2004;103:1823‐1828. - PubMed
    1. Kumar AR, Sarver AL, Wu B, et al. Meis1 maintains stemness signature in MLL‐AF9 leukemia. Blood. 2010;115:3642‐3643. - PMC - PubMed

Publication types

MeSH terms