Review
. 2021 Jul 1;101(3):1371-1426.
doi: 10.1152/physrev.00026.2020. Epub 2021 Feb 18.

Regulation and metabolic functions of mTORC1 and mTORC2

Affiliations
Review

Regulation and metabolic functions of mTORC1 and mTORC2

Angelia Szwed et al. Physiol Rev. .

Abstract

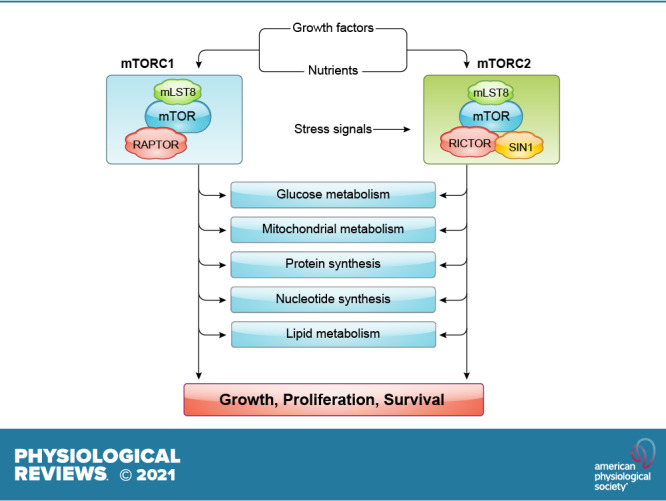
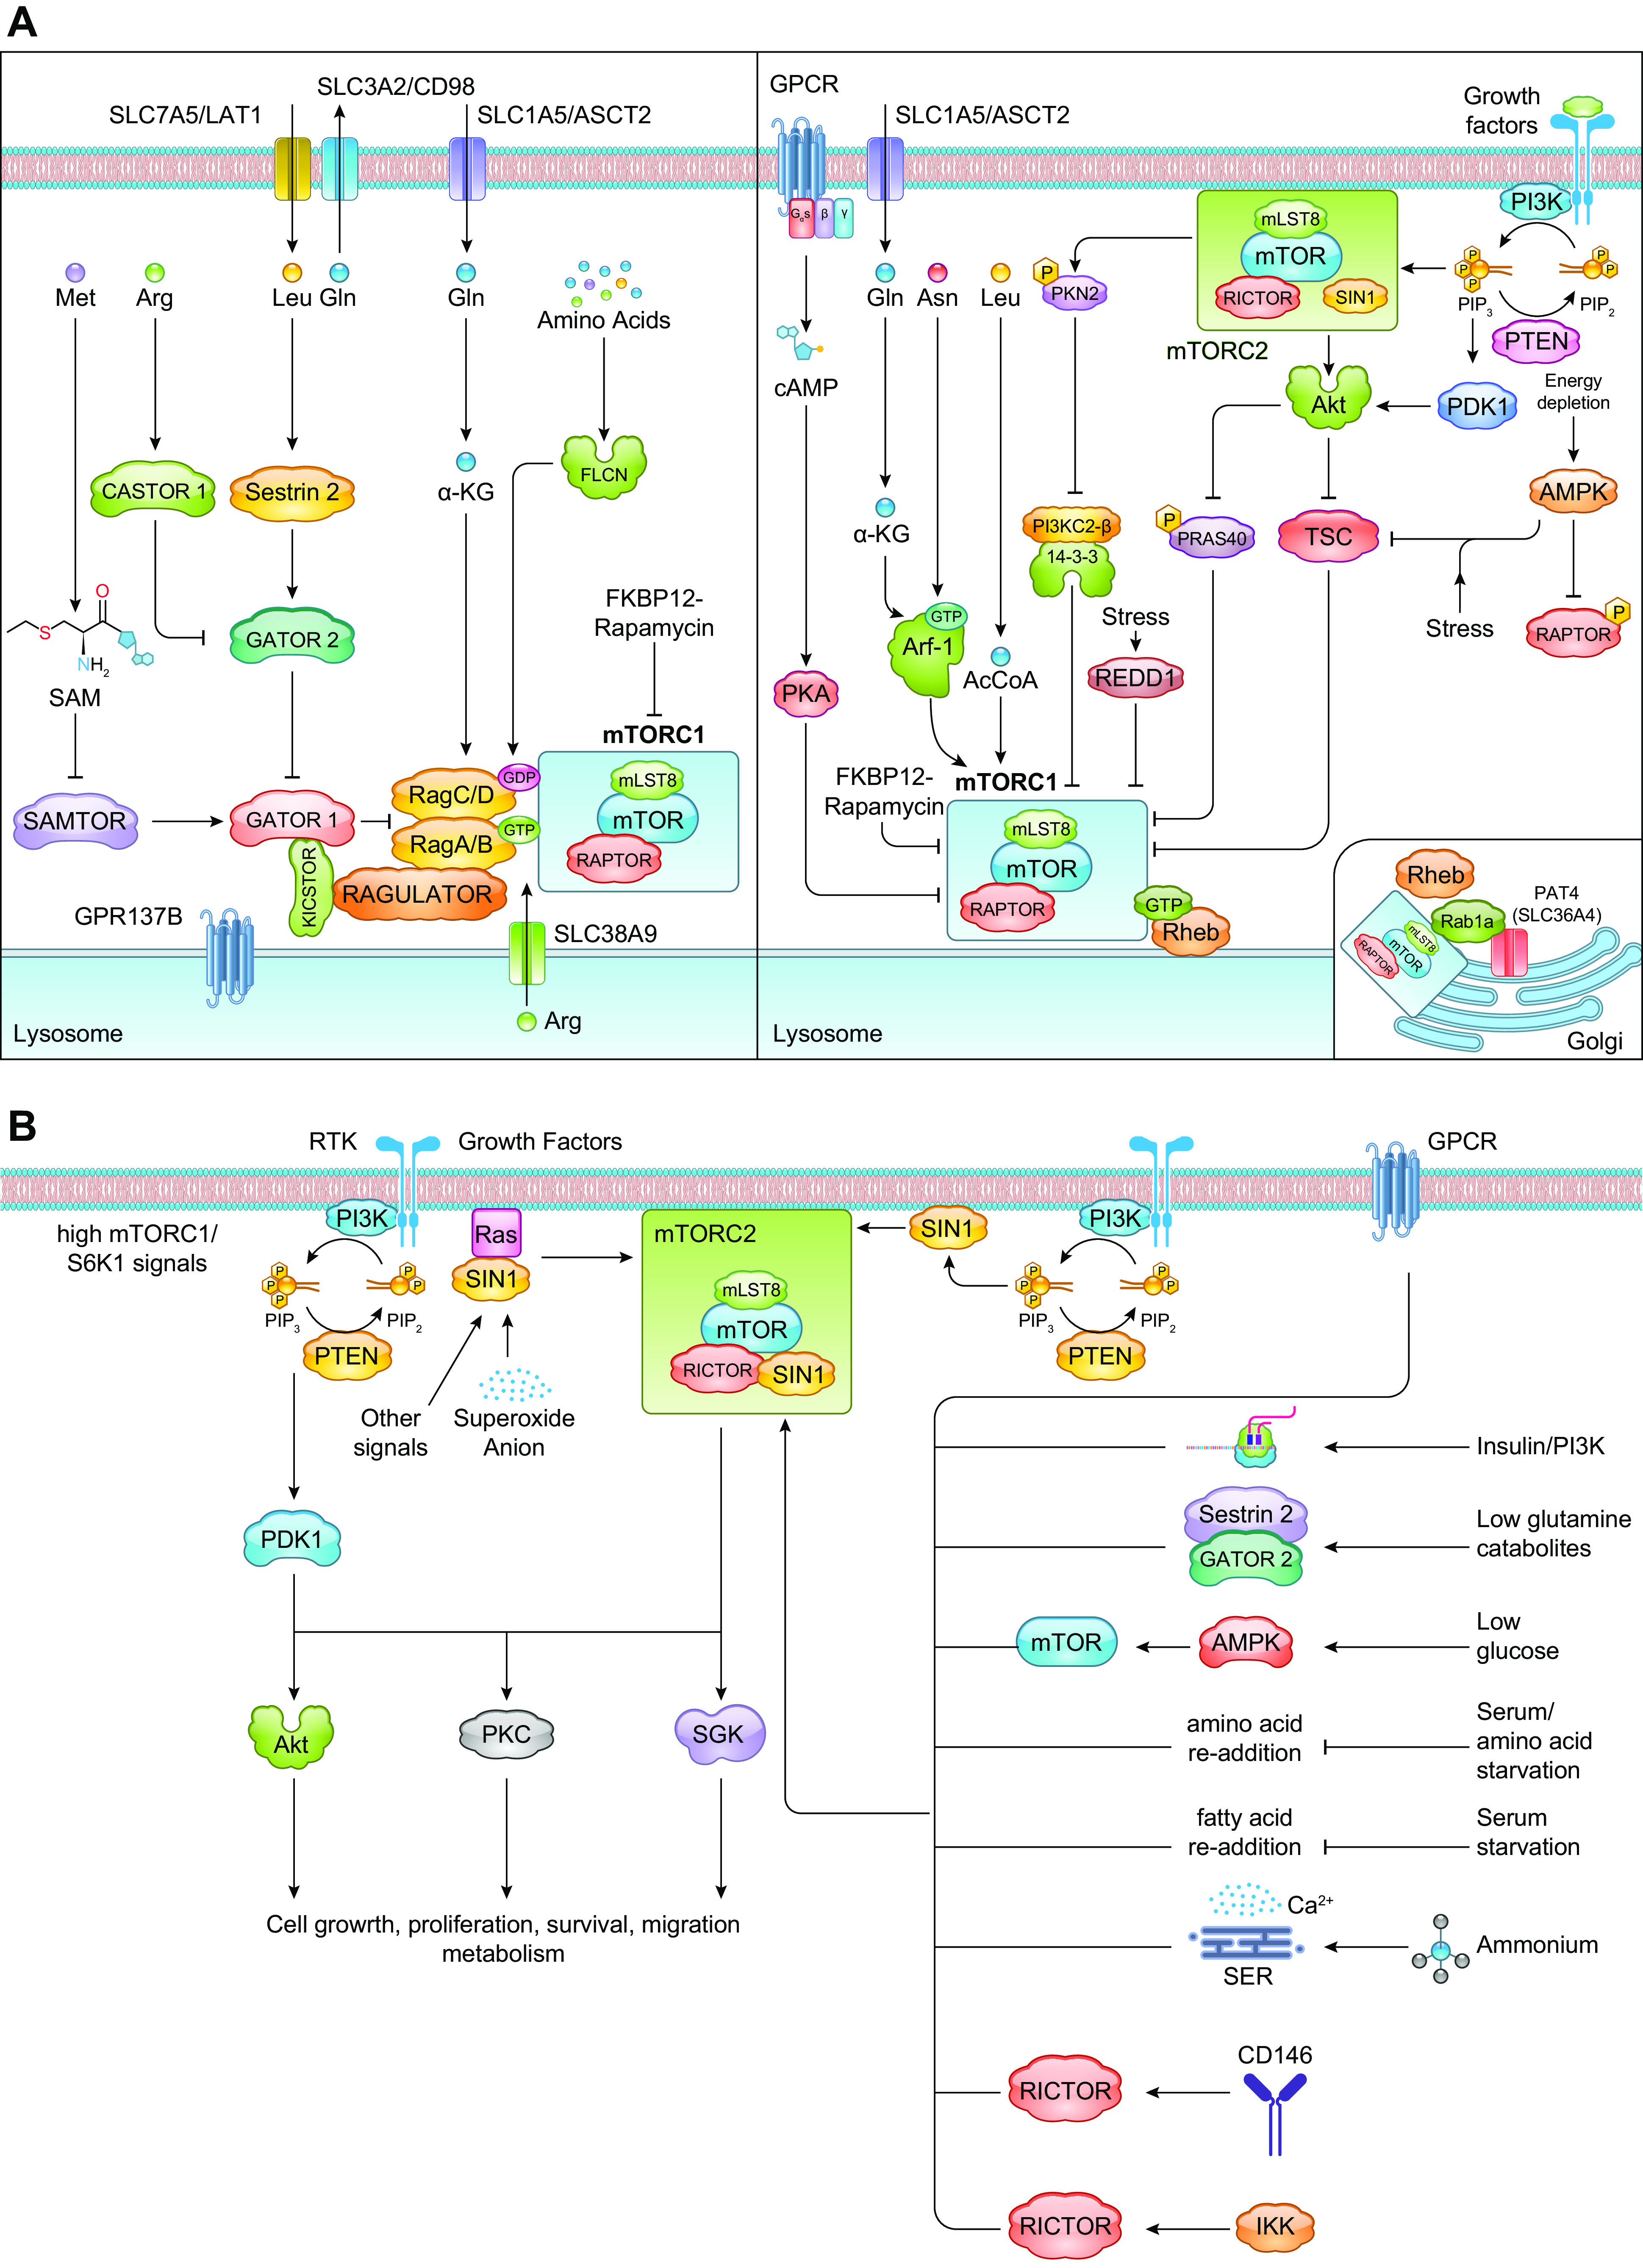
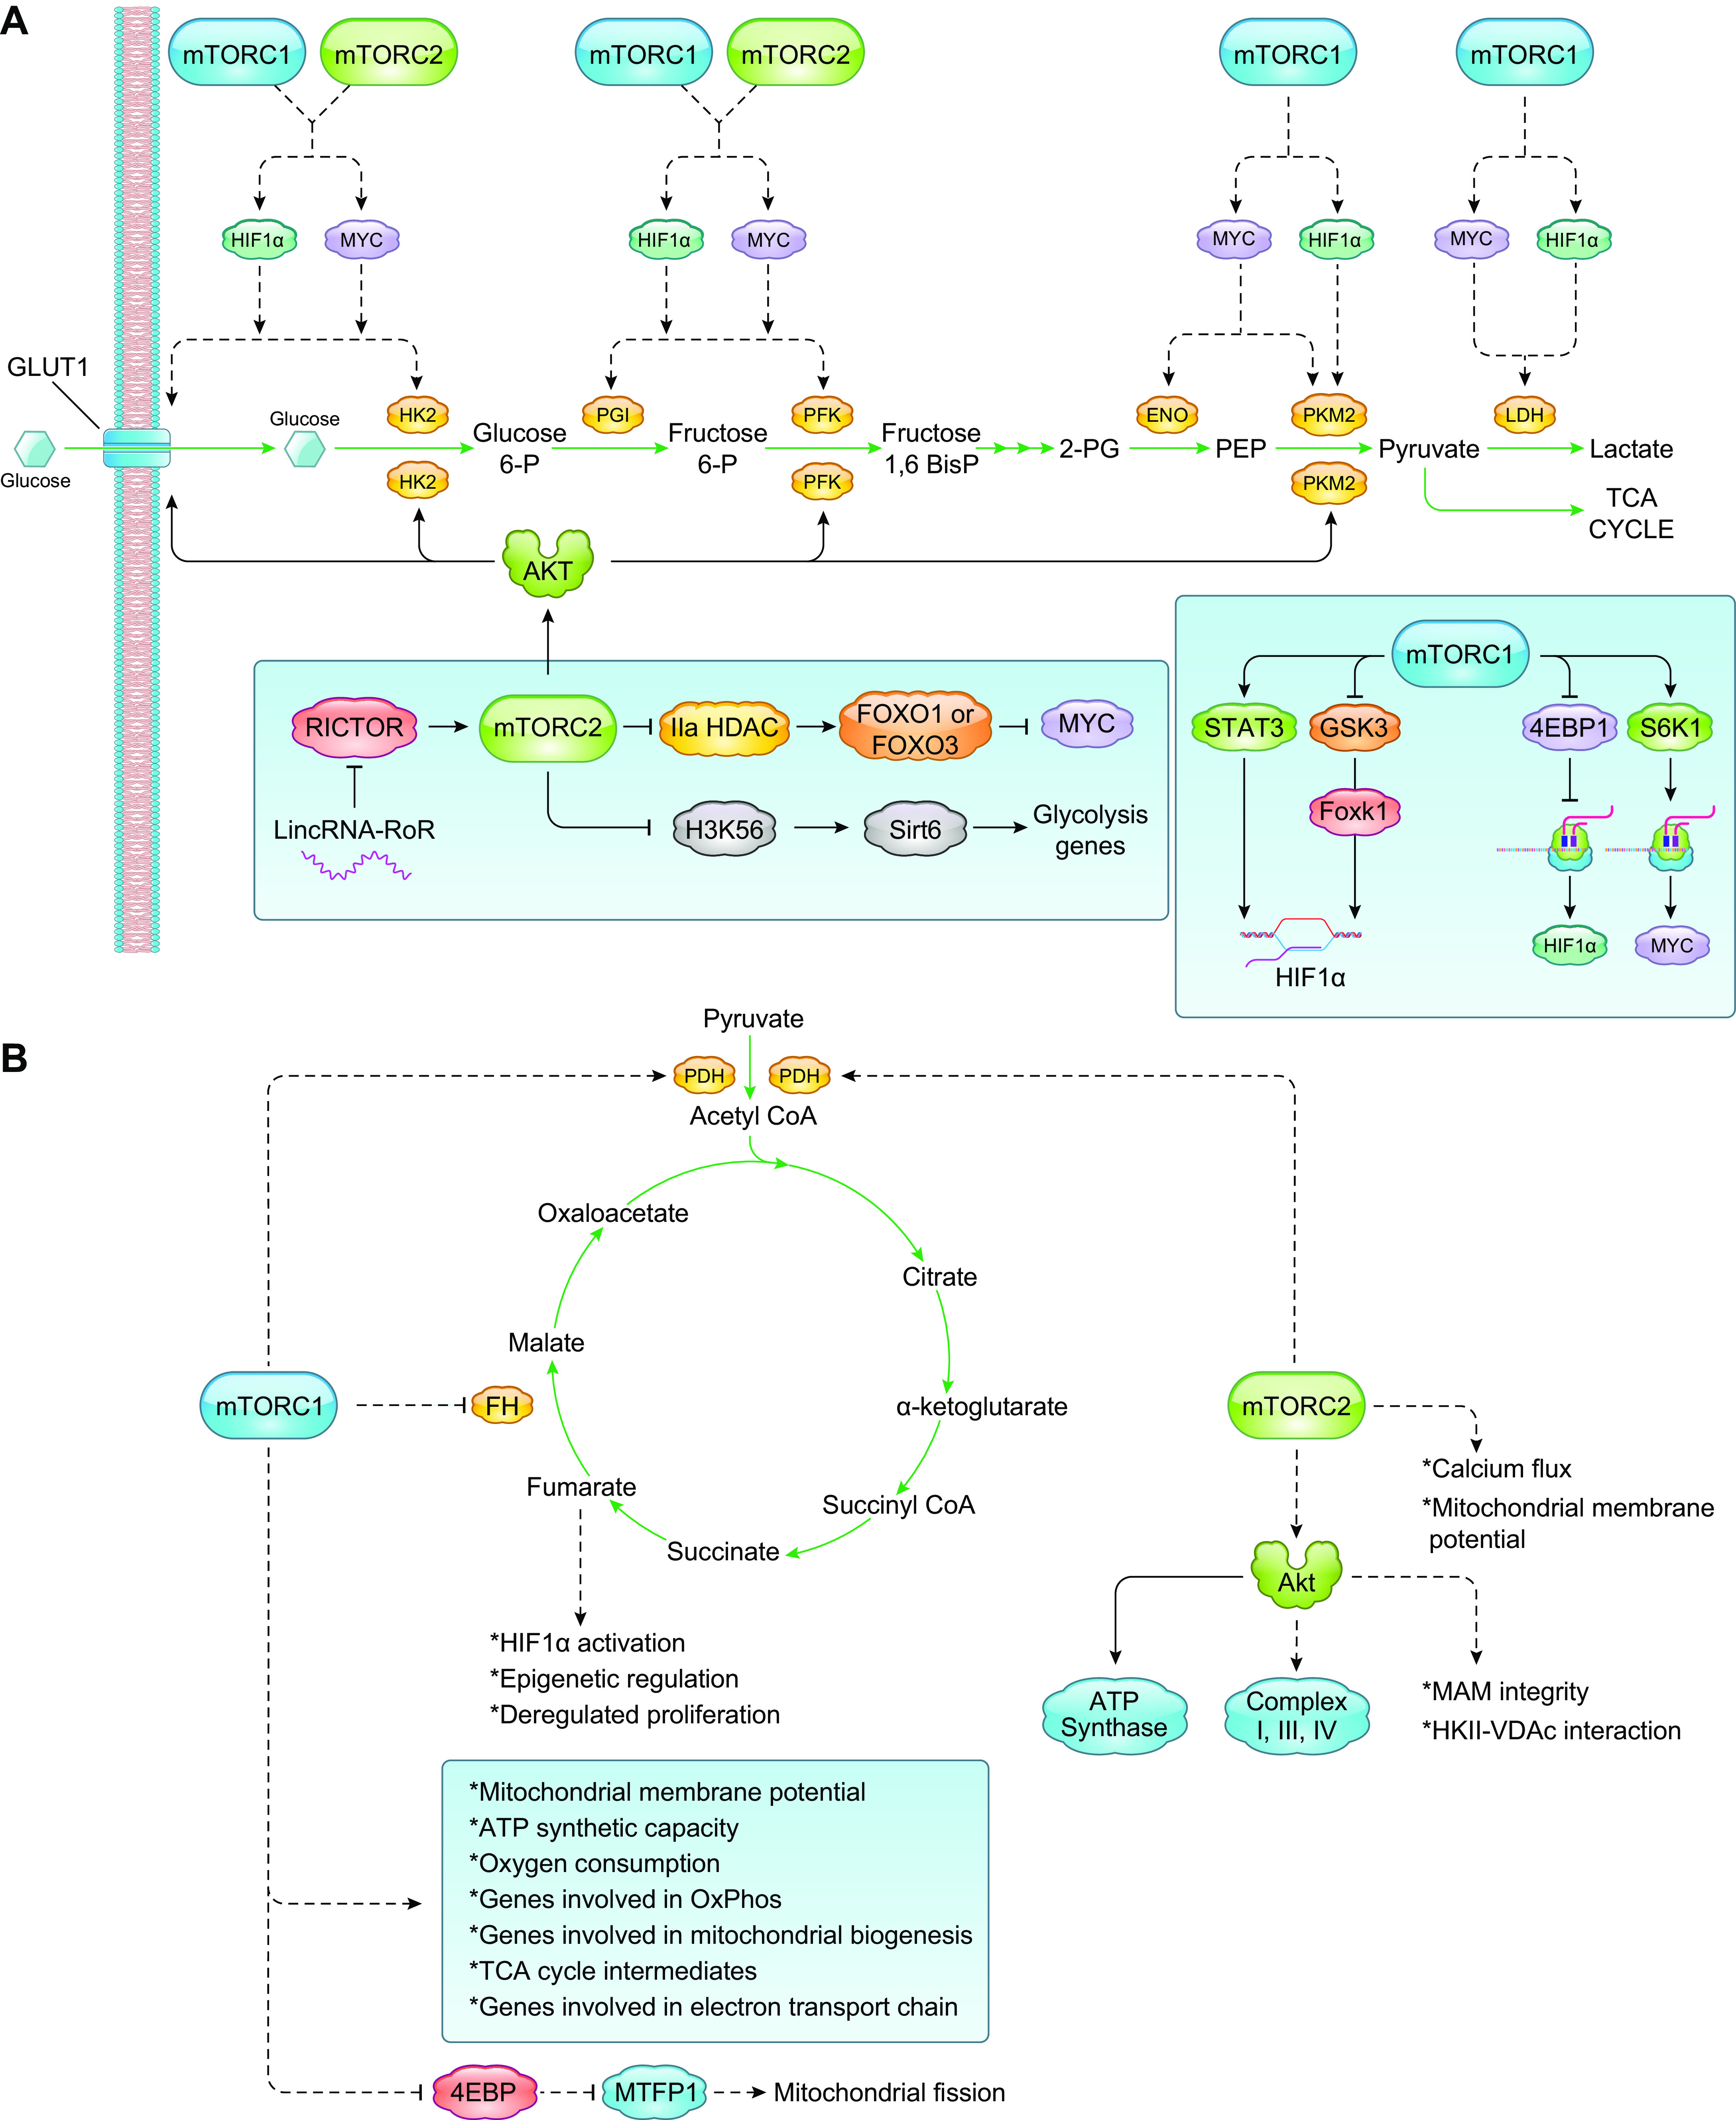
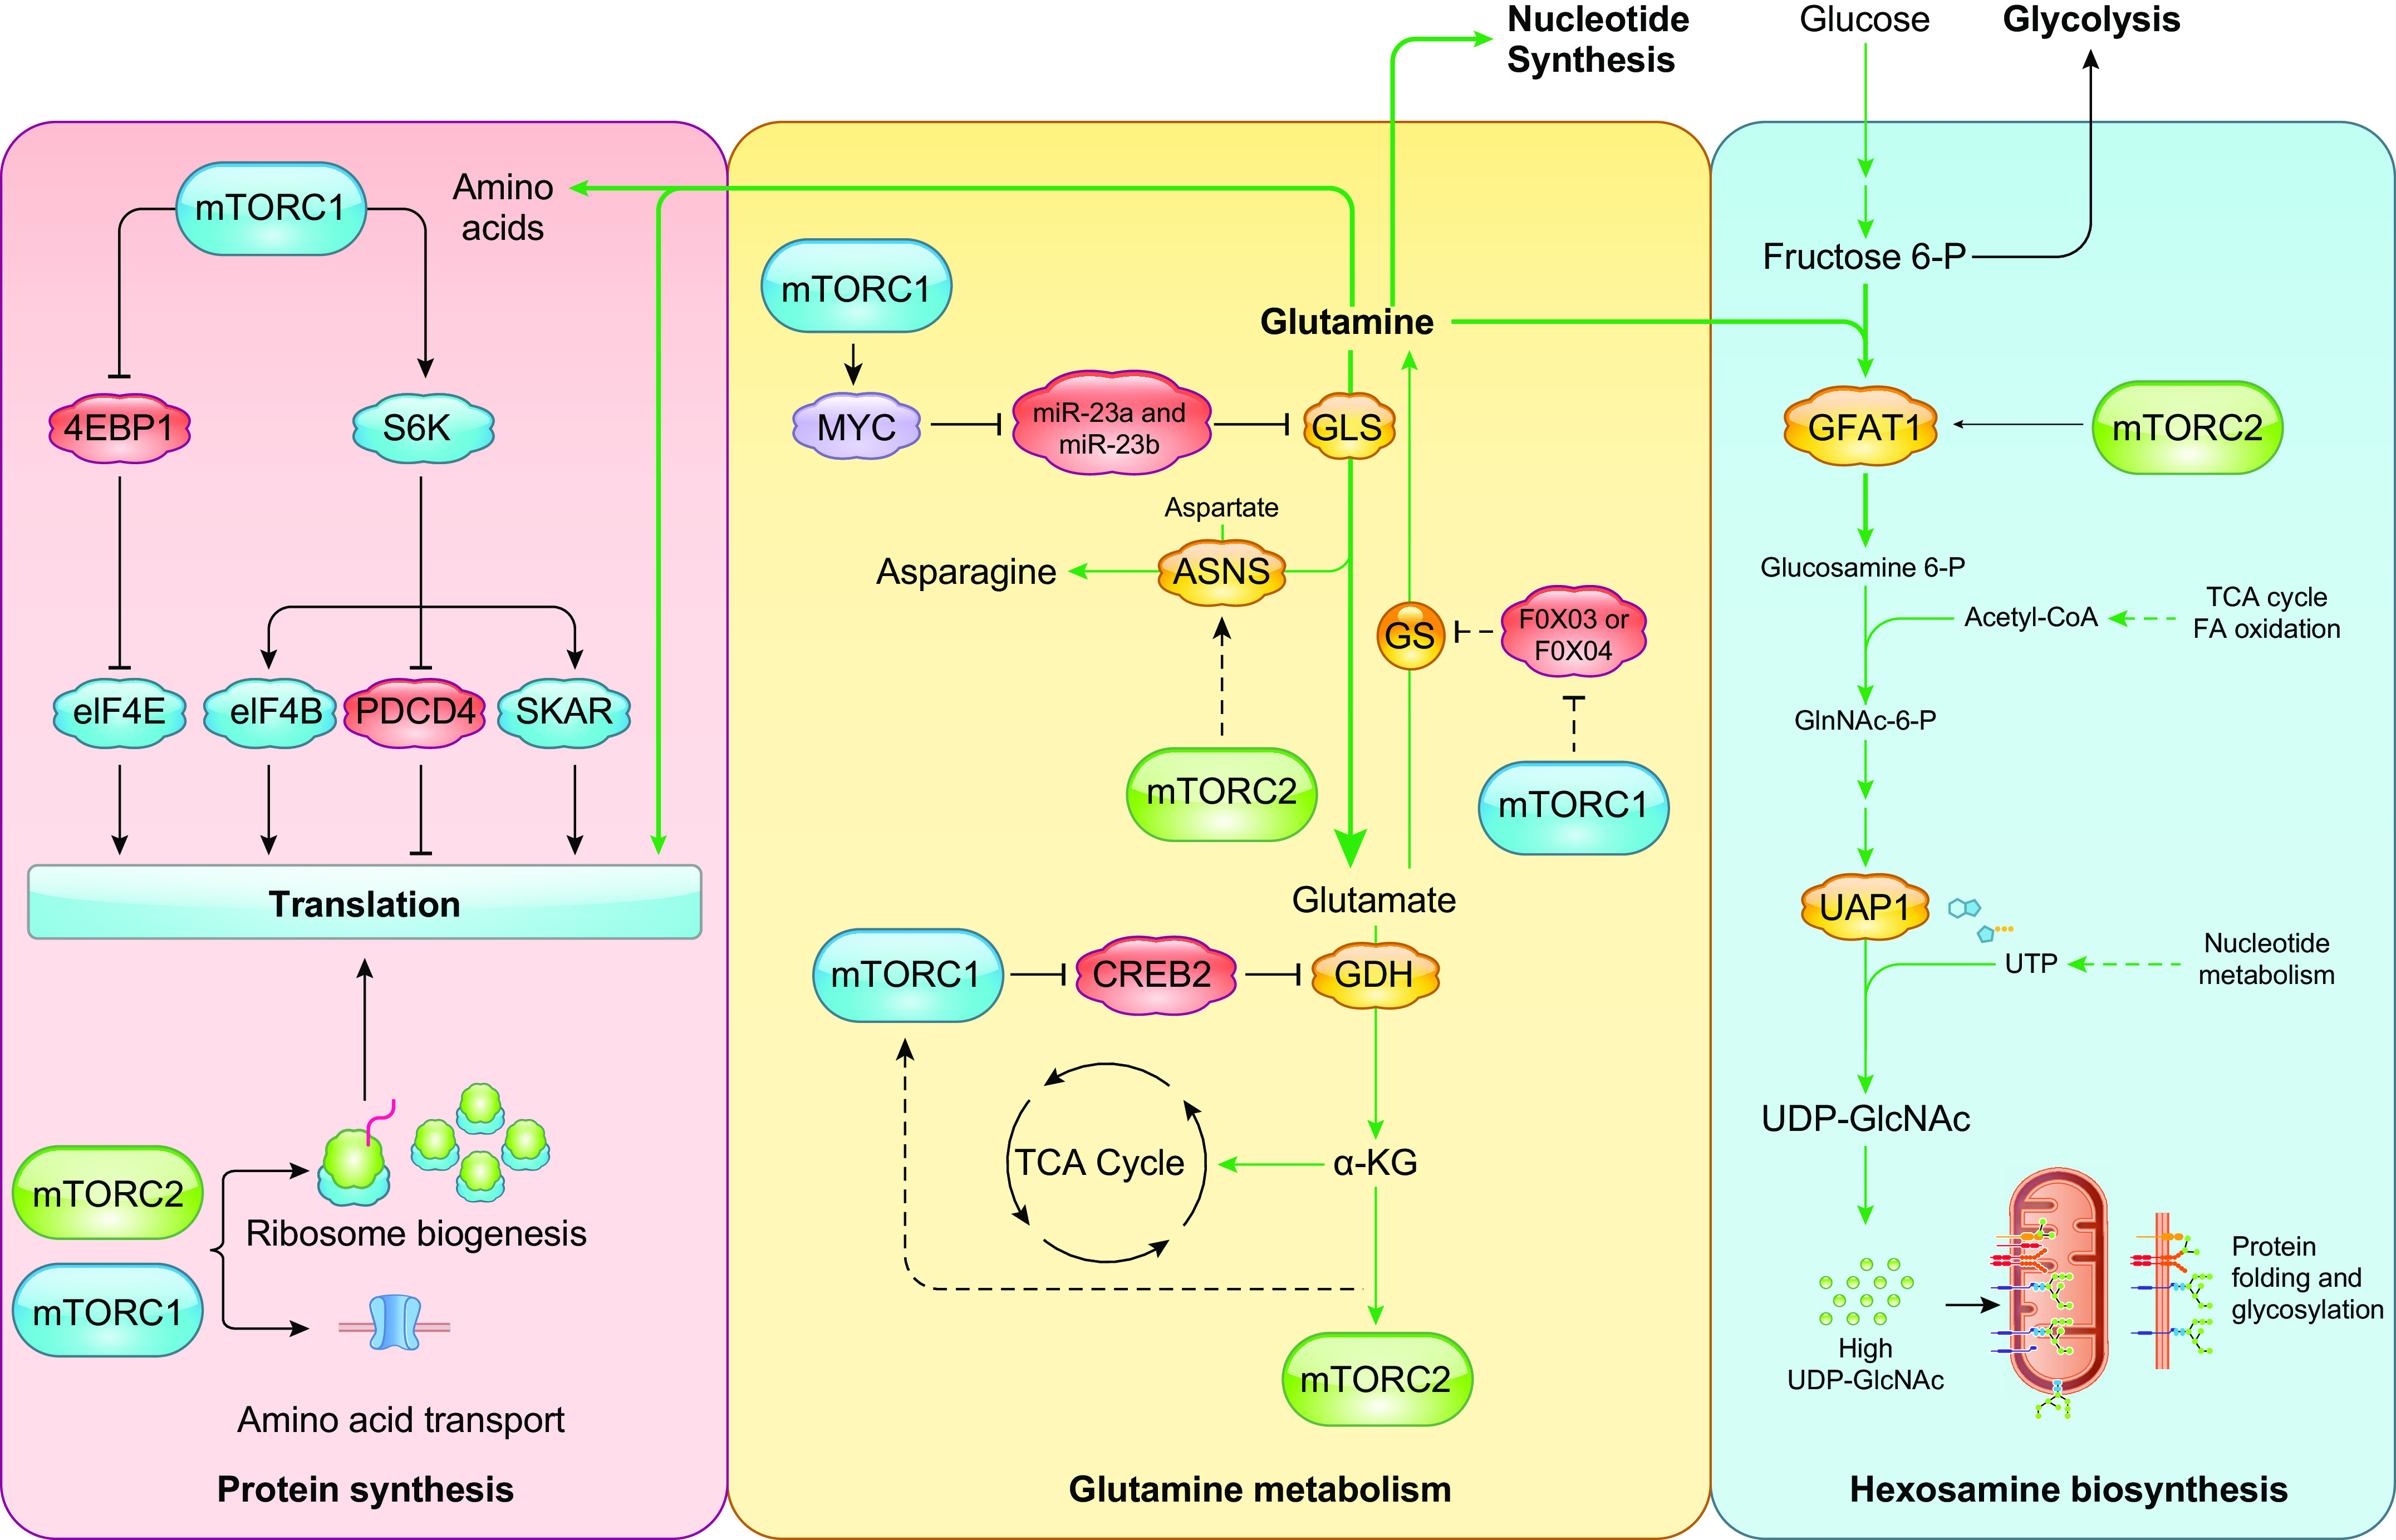
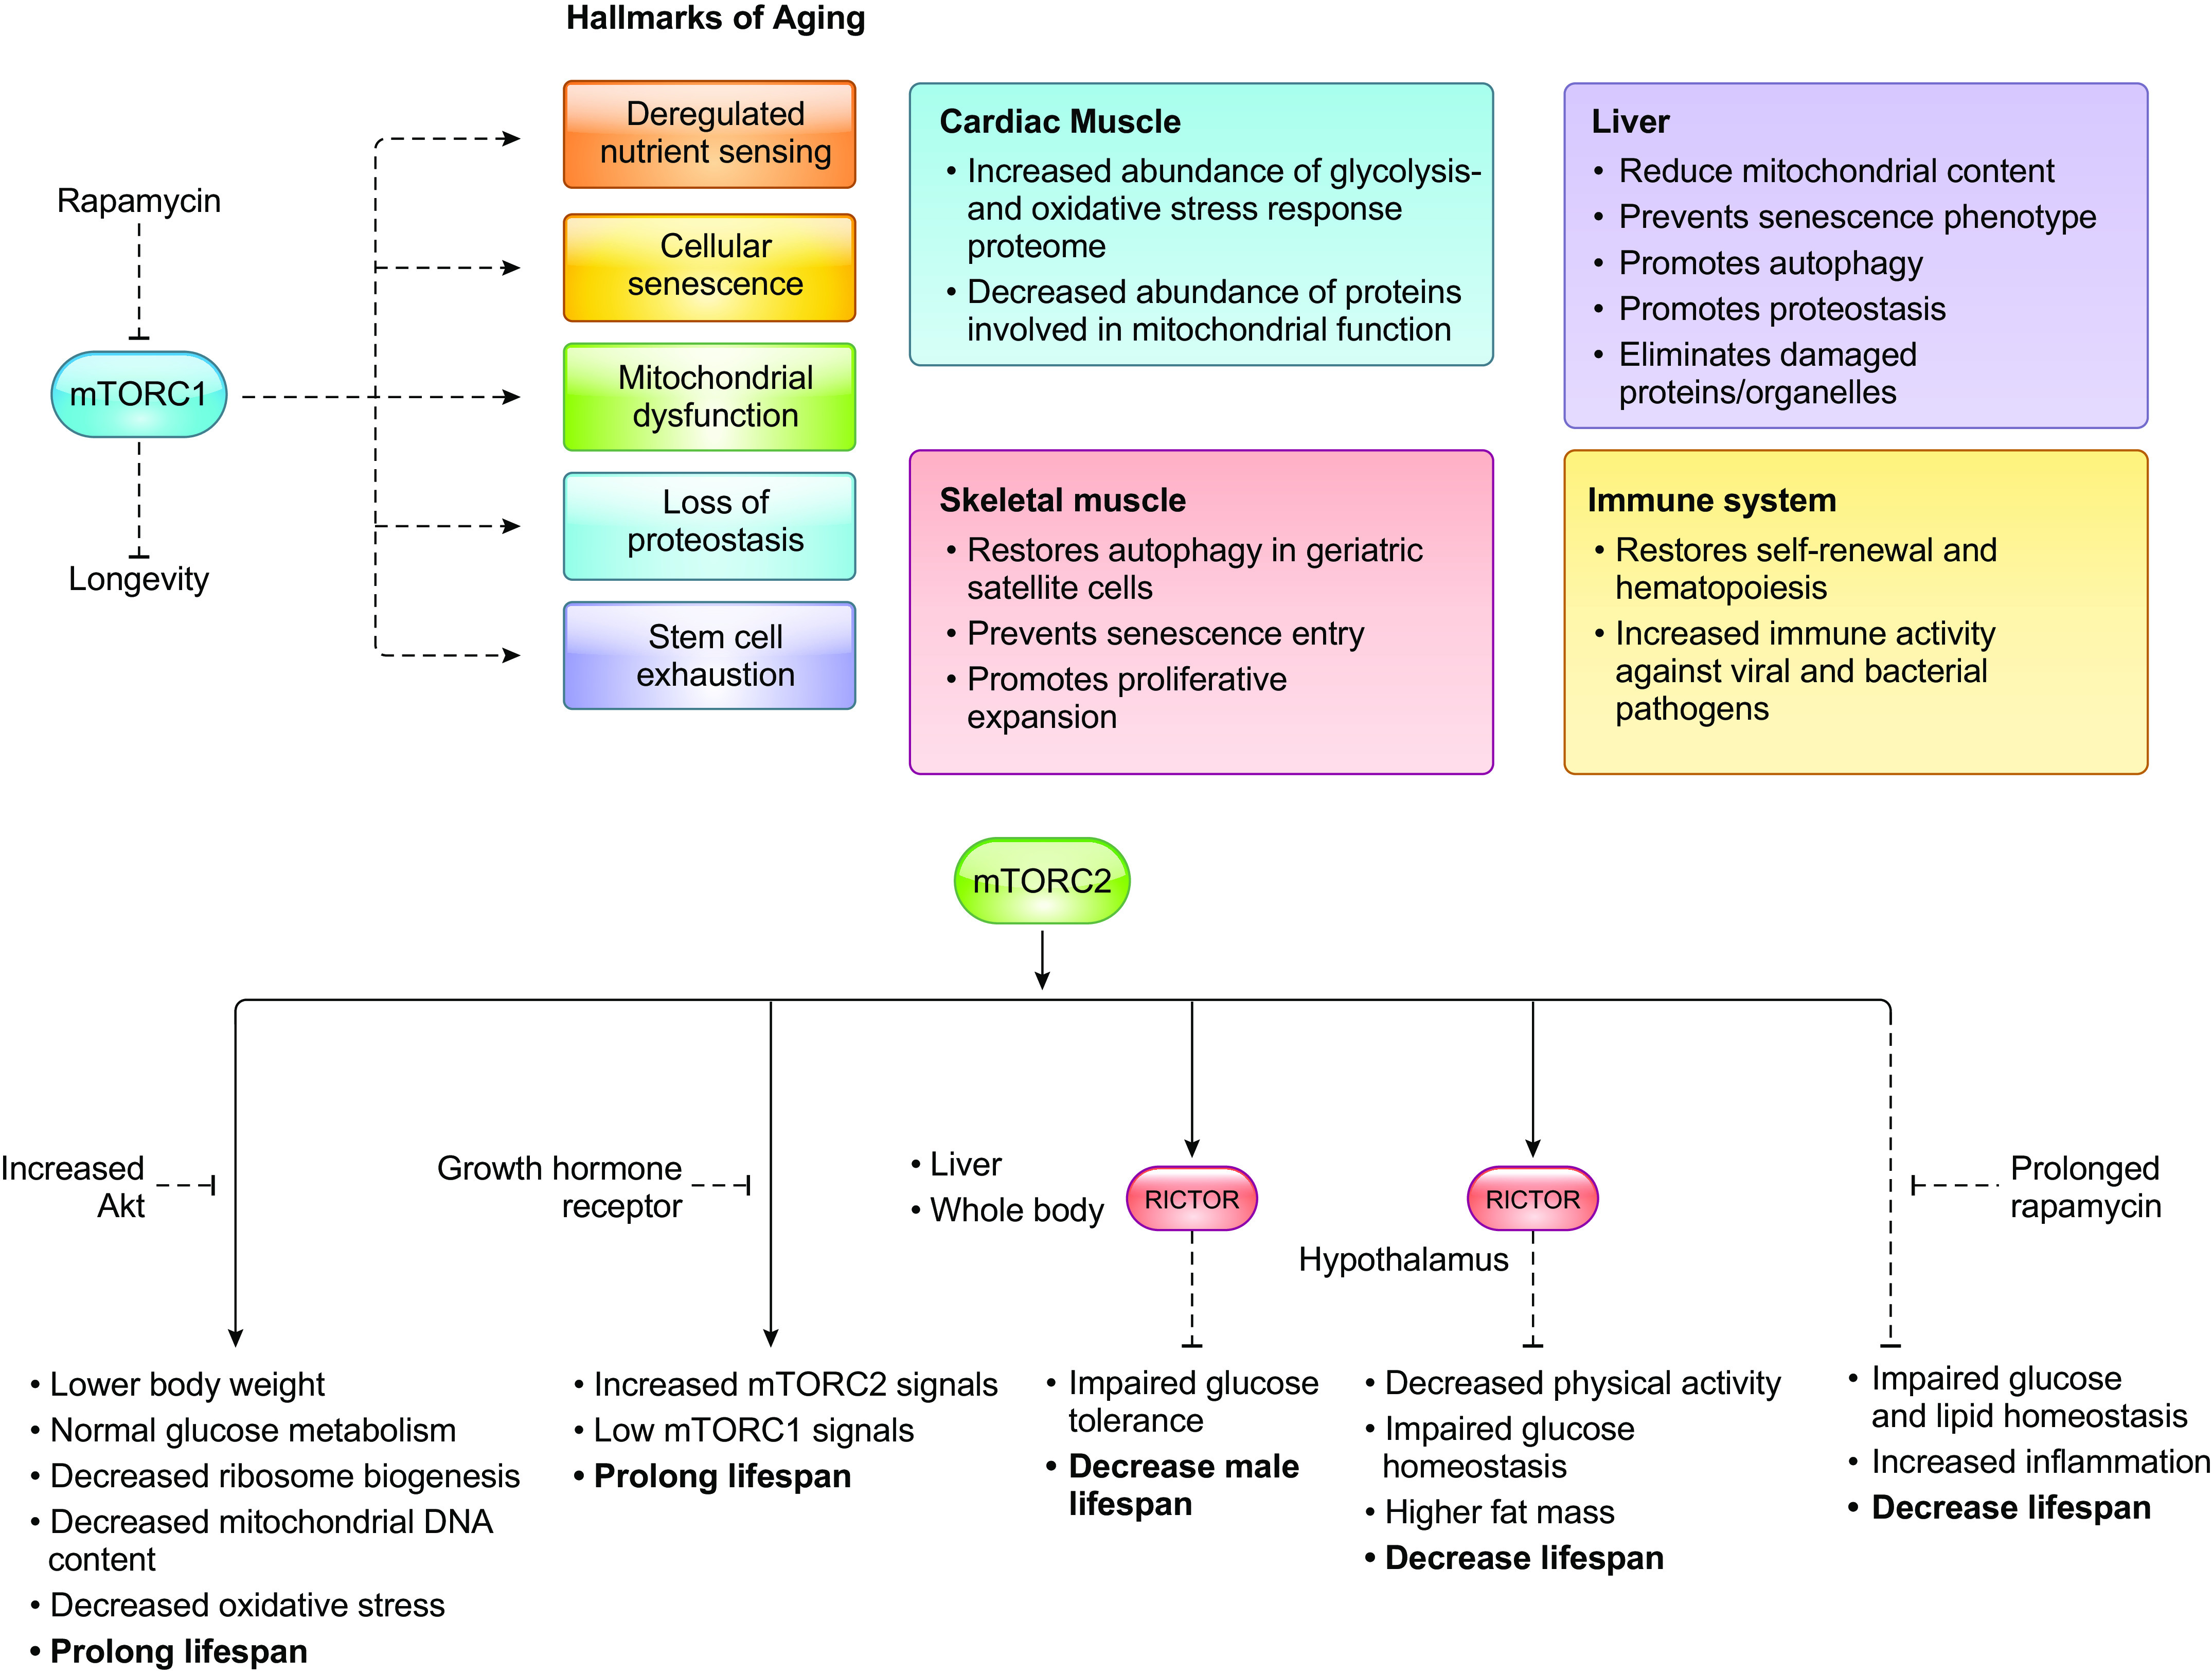
Cells metabolize nutrients for biosynthetic and bioenergetic needs to fuel growth and proliferation. The uptake of nutrients from the environment and their intracellular metabolism is a highly controlled process that involves cross talk between growth signaling and metabolic pathways. Despite constant fluctuations in nutrient availability and environmental signals, normal cells restore metabolic homeostasis to maintain cellular functions and prevent disease. A central signaling molecule that integrates growth with metabolism is the mechanistic target of rapamycin (mTOR). mTOR is a protein kinase that responds to levels of nutrients and growth signals. mTOR forms two protein complexes, mTORC1, which is sensitive to rapamycin, and mTORC2, which is not directly inhibited by this drug. Rapamycin has facilitated the discovery of the various functions of mTORC1 in metabolism. Genetic models that disrupt either mTORC1 or mTORC2 have expanded our knowledge of their cellular, tissue, as well as systemic functions in metabolism. Nevertheless, our knowledge of the regulation and functions of mTORC2, particularly in metabolism, has lagged behind. Since mTOR is an important target for cancer, aging, and other metabolism-related pathologies, understanding the distinct and overlapping regulation and functions of the two mTOR complexes is vital for the development of more effective therapeutic strategies. This review discusses the key discoveries and recent findings on the regulation and metabolic functions of the mTOR complexes. We highlight findings from cancer models but also discuss other examples of the mTOR-mediated metabolic reprogramming occurring in stem and immune cells, type 2 diabetes/obesity, neurodegenerative disorders, and aging.

Keywords: cancer metabolism; glycolysis; lipid metabolism; mTOR; metabolic reprogramming.


Conflict of interest statement

No conflicts of interest, financial or otherwise, are declared by the authors.

Figures

None
Graphical abstract
FIGURE 1.
FIGURE 1.
mTORC1 and mTORC2 signaling pathways. A: the activation of mTORC1 occurs via distinct mechanisms that are either Rag dependent or -independent. When nutrients are present, mTORC1 is activated via Rag heterodimers (left). Ragulator serves as a GEF for RagA/B and facilitates localization of the Rag GTPases to the lysosomal surface. GATOR1 is the counteracting GAP and is engaged to the lysosomes via another large protein complex, KICSTOR. GATOR2 indirectly activates mTORC1 by binding to and blocking GATOR1 activity. By binding to regulatory proteins that modulate Rag activation, different amino acids promote mTORC1 activation. mTORC1 is also regulated by Rag-independent mechanisms (right). Glutamine and asparagine promote mTORC1 activation on the lysosomal surface via Arf-1 GTPase. mTORC1 activation is also subject to negative regulation to modulate its activity depending on levels of growth signals. TSC and PRAS40 are modulated by growth factor and energy signals. REDD1 negatively modulates mTORC1 in response to stress conditions. Signals from GPCRs also negatively regulate mTORC1 via PKA. mTORC1 is also modulated by amino acids at the surface of the Golgi via Rab1a (inset). B: mTORC2 is activated by growth factors and fluctuations in nutrient/metabolite levels. In response to growth factors, the increased PI3K signaling enhances mTORC2 activation, leading to phosphorylation of AGC kinase family members such as Akt, PKC, and SGK. mTORC2 allosterically activates these protein kinases, which have numerous cellular functions. mTORC2 activation is also enhanced by other signals including from the GPCR, translating ribosomes, nutrient fluctuations (including withdrawal or readdition), and association of mTORC2 components with other signaling molecules such as Ras, CD146, or IKK. See glossary for abbreviations.
FIGURE 2.
FIGURE 2.
Control of glycolysis and mitochondrial metabolism by mTORC1 and mTORC2. A: in highly proliferating cells there is a switch to aerobic glycolysis, termed the Warburg effect. The enhanced rate of glucose uptake and glycolytic activity results in an increased production of pyruvate, which is preferentially metabolized to lactate in the cytosol by LDH. mTORC1 and mTORC2 directly and indirectly reprogram glucose metabolism for increased cell growth and survival by control of the expression of transcription factors (HIF1α, Myc) that induce gene expression of glycolytic effectors and glucose transporters. mTORC2 also controls membrane trafficking of glucose transporters (GLUT1), expression and/or activity of glycolytic enzymes. B: mTORC1 controls several aspects of mitochondrial metabolism including oxygen consumption, membrane potential, and mitochondrial biogenesis. The role of mTORC2 in oxidative and mitochondrial metabolism is less understood, although its substrate Akt has been shown to modulate different components and processes involved in mitochondrial metabolism. See glossary for abbreviations.
FIGURE 3.
FIGURE 3.
mTORC1 and mTORC2 control metabolic processes important for protein synthesis and folding. mTORC1 controls protein synthesis via phosphorylation of the translation regulators S6K and 4EBP1. Both mTORC1 and mTORC2 are also involved in ribosome biogenesis and transport of amino acids that are required for translation. The amino acid glutamine is a major alternative carbon source and nitrogen source for a number of metabolic reactions including TCA cycle anaplerosis, nucleotide synthesis, and hexosamine biosynthesis. Multiple aspects of glutamine metabolism are controlled by both mTORC1 and mTORC2. mTORC2 has been shown to modulate hexosamine biosynthesis via GFAT1. See glossary for abbreviations.
FIGURE 4.
FIGURE 4.
The pentose phosphate pathway (PPP) and nucleotide metabolism are modulated by mTORC1 and mTORC2. The PPP generates the reducing equivalent, NADPH, and ribose-5-phosphate, which serves as a backbone for the synthesis of purines and pyrimidines. mTORC1 and the mTORC2 substrate Akt have been linked to the regulation of the key enzymes involved in the PPP. mTORC1 also controls the key enzyme, CAD, involved in pyrimidine synthesis. Both mTORC1 and mTORC2 have been linked to the regulation of purine synthesis. See glossary for abbreviations.
FIGURE 5.
FIGURE 5.
mTORC1 and mTORC2 control lipid metabolism. In proliferating cells, the production of fatty acids and cholesterol is enhanced for the biosynthesis of signaling molecules and membrane lipids. The function of mTORC1 in lipid metabolism is mediated via the transcription factor SREBP1, which is a master regulator of lipid metabolism-related genes. mTORC1 also modulates other proteins that contribute to lipid biosynthesis such as the histone demethylase JMJD1C and SRPK2, which regulates lipogenic mRNAs. mTORC1 also controls adipogenesis and fatty acid uptake via PPARγ. mTORC2 promotes de novo fatty acid and lipid synthesis (sphingolipid and glycerophospholipids) via transcriptional regulation independent of Akt. mTORC2 is also involved in adipogenesis via negative regulation of FoxC2. It promotes white adipose tissue lipogenesis via the transcription factor ChREBPβ and prevents brown adipose tissue lipid catabolism via repression of Fox01. See glossary for abbreviations.
FIGURE 6.
FIGURE 6.
mTOR mediates metabolic reprogramming of stem and immune cells. A: somatic cells switch from OxPhos to glycolysis during reprogramming to become iPSCs, enhanced by factors associated with the glycolytic phenotype (e.g., HIF1α, hypoxic conditions, lactate production, glycolytic enzyme expression). Reprogramming efficiency is also enhanced by increased Akt activity, which suggests a role for mTORC2. Hyperactivation of mTORC1 such as during TSC deficiency suppresses iPSC reprogramming. The proper activation of mTORC1 and mTORC2 is required to maintain the glycolytic metabolism of PSCs. B: upon antigen encounter, naive T cells switch from OxPhos to a glycolytic metabolism. This allows for the synthesis of cytokines and expansion of effector cells to promote pathogen elimination. Both mTOR complexes are required for this metabolic reprogramming. After proliferation of effector cells and elimination of pathogens, T memory cells persist and revert to a naivelike OxPhos metabolism, where mTOR activity is reduced. B cell activation is characterized by synthesis of immunoglobulins and the generation of antibody-secreting plasma cells. To facilitate antibody production and secretion, B cells increase glucose uptake but glucose catabolism is diverted to the PPP to generate sufficient NADPH to maintain redox homeostasis. Activated B cells also enhance de novo lipogenesis and hexosamine biosynthesis. Both mTORC1 and mTORC2 promote B cell proliferation and antibody responses. In macrophages, blocking mTOR activity or glycolysis diminishes inflammatory cytokine production and bacterial elimination. In response to microbial stimuli (e.g., β-glucan), CAMs increase aerobic glycolysis via mTORC1 modulating HIF1α. In response to IL-4, Akt and mTORC1 are upregulated, leading to increased glucose metabolism and lipid synthesis in AAMs. See glossary for abbreviations.
FIGURE 7.
FIGURE 7.
Defects in mTOR signaling underlie the pathogenesis of several neurodegenerative disorders. In Alzheimer’s disease (AD), inhibition of hyperactive mTOR signaling reduces Aβ deposition, pathogenic tau phosphorylation, and neurofibrillary tangles, leading to improvements in neuronal loss and cognitive function potentially due to promoting autophagy. Defects in branched-chain amino acid (BCAA) catabolism leading to increased BCAA levels enhance tau phosphorylation in an mTOR-dependent manner in AD. Deletion of brain-specific mTORC2, but not mTORC1, prolonged life span, prevented seizures, rescued AD-like behaviors and long-term memory, and normalized metabolic changes in the brain. In Parkinson’s disease (PD), insulin/mTOR signaling pathway is deregulated. Accumulation of α-synuclein is accompanied by increased mTOR activity and autophagy dysfunction. Rapamycin and depletion of mTOR mitigates the increased mTOR activity caused by elevated α-synuclein and induces autophagy and clearance of A53T α-synuclein. In models of PD with low mTORC1 activity due to elevated REDD1 levels, depletion of TSC2 enhances mTORC1 activity and is neuroprotective. In Huntington’s disease, enhancing mTORC1 activity by increasing expression of Rheb or Rhes mitigates mitochondrial dysfunction and abnormal cholesterol metabolism and increases autophagy. See glossary for abbreviations.
FIGURE 8.
FIGURE 8.
Modulating mTORC1 and mTORC2 signaling is important to prolong health span. A: downregulating mTORC1 in specific tissues and in the organism could counteract aging hallmarks such as deregulated nutrient sensing, mitochondrial dysfunction, loss of proteostasis, cellular senescence, and stem cell exhaustion. B: mTORC2 may have tissue-specific functions that could impact longevity. Decreased Akt signaling and growth hormone receptor prolong life span, while deficiency of rictor in the liver, hypothalamus, and the whole body or inhibition of mTORC2 via prolonged rapamycin treatment decreases life span. See glossary for abbreviations.

References

    1. Lorberg A, Hall MN. TOR: the first 10 years. Curr Top Microbiol Immunol 279: 1–18, 2004. doi:10.1007/978-3-642-18930-2_1. - DOI - PubMed
    1. Vanhaesebroeck B, Stephens L, Hawkins P. PI3K signalling: the path to discovery and understanding. Nat Rev Mol Cell Biol 13: 195–203, 2012. doi:10.1038/nrm3290. - DOI - PubMed
    1. Valcourt JR, Lemons JM, Haley EM, Kojima M, Demuren OO, Coller HA. Staying alive: metabolic adaptations to quiescence. Cell Cycle 11: 1680–1696, 2012. doi:10.4161/cc.19879. - DOI - PMC - PubMed
    1. Brown EJ, Albers MW, Shin TB, Ichikawa K, Keith CT, Lane WS, Schreiber SL. A mammalian protein targeted by G1-arresting rapamycin-receptor complex. Nature 369: 756–758, 1994. doi:10.1038/369756a0. - DOI - PubMed
    1. Heitman J, Movva NR, Hall MN. Targets for cell cycle arrest by the immunosuppressant rapamycin in yeast. Science 253: 905–909, 1991. doi:10.1126/science.1715094. - DOI - PubMed

Publication types

MeSH terms

Substances

LinkOut - more resources