. 2021 Feb 18:10:e62273.
doi: 10.7554/eLife.62273.

Virus infection of the CNS disrupts the immune-neural-synaptic axis via induction of pleiotropic gene regulation of host responses

Affiliations

Virus infection of the CNS disrupts the immune-neural-synaptic axis via induction of pleiotropic gene regulation of host responses

Olga A Maximova et al. Elife. .

Abstract

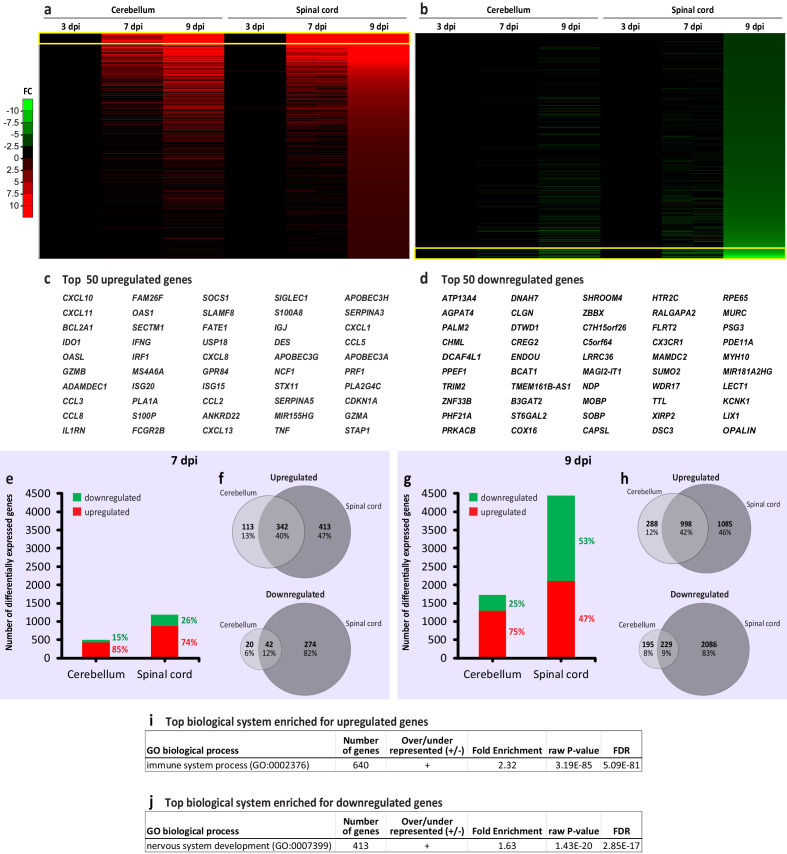
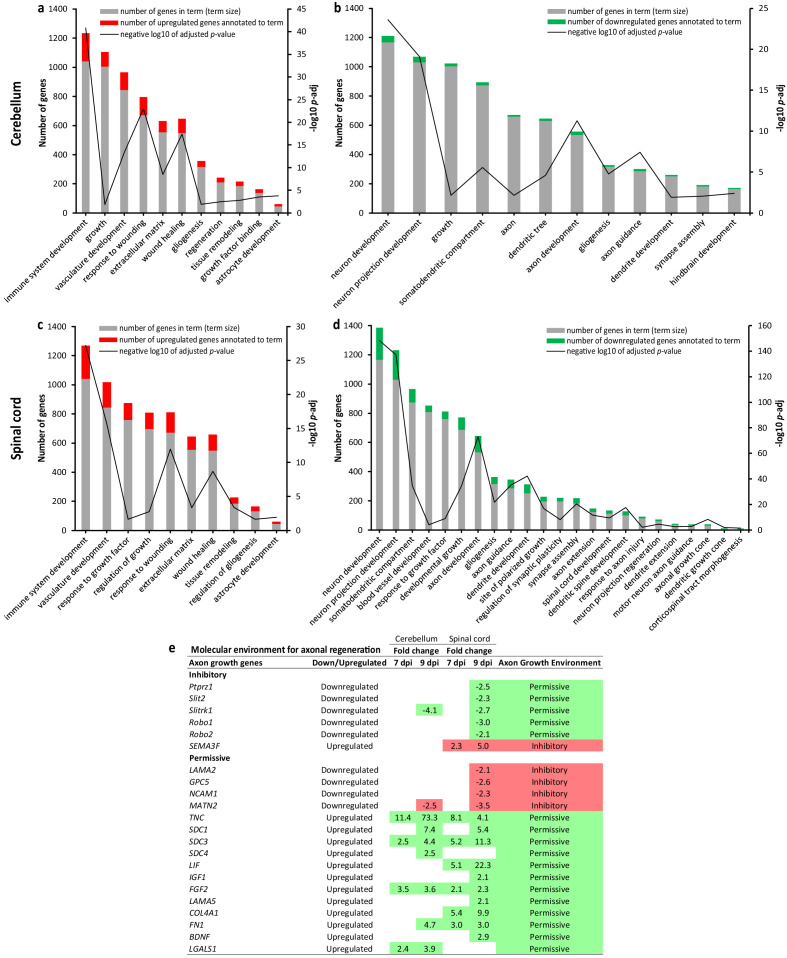
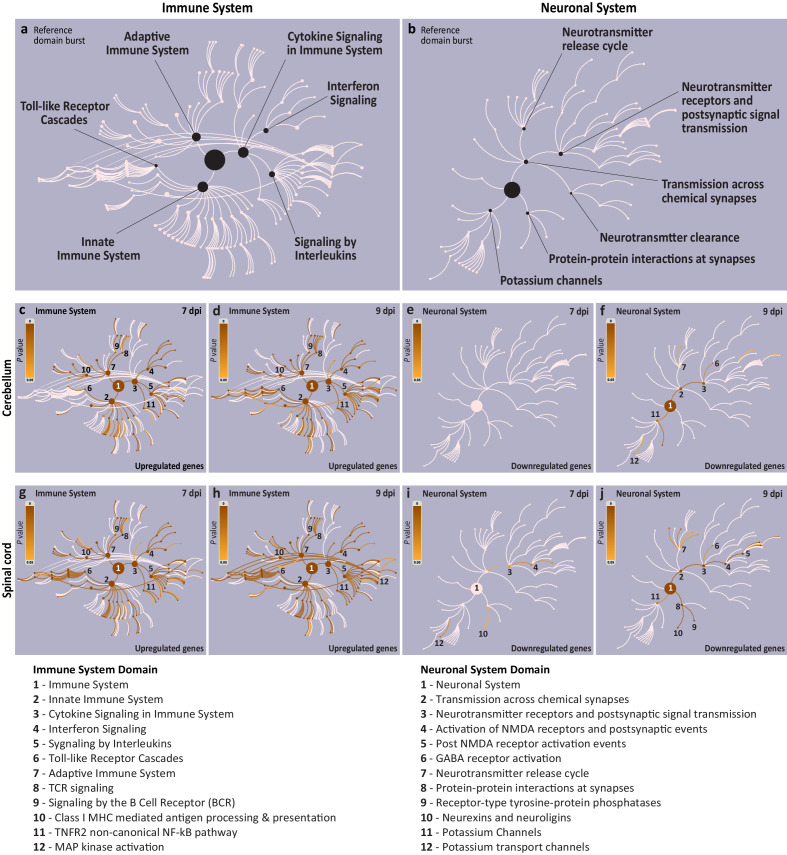
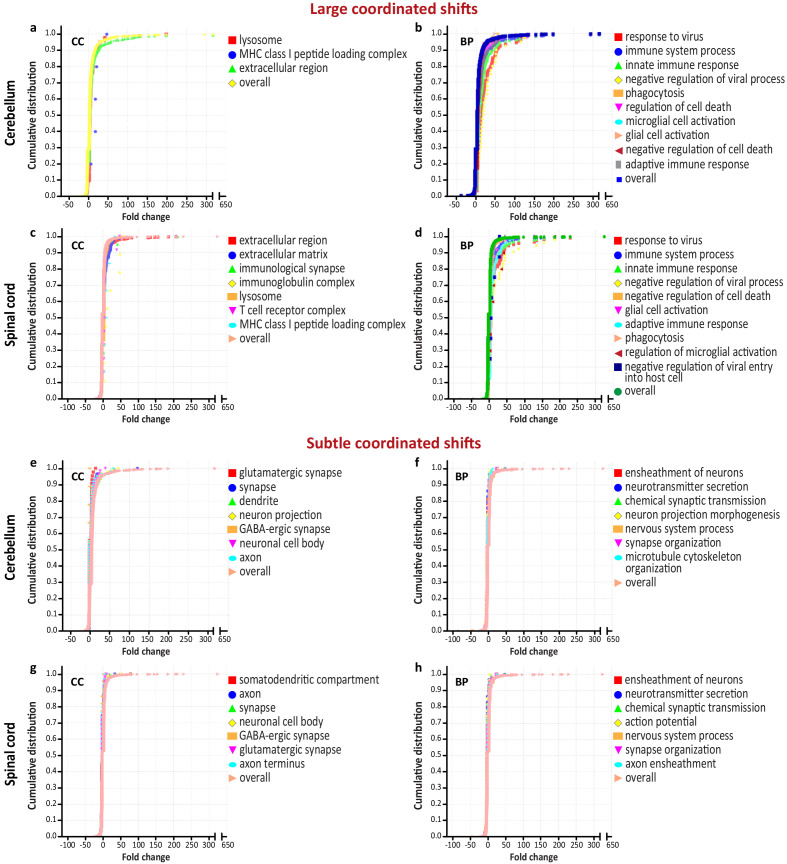
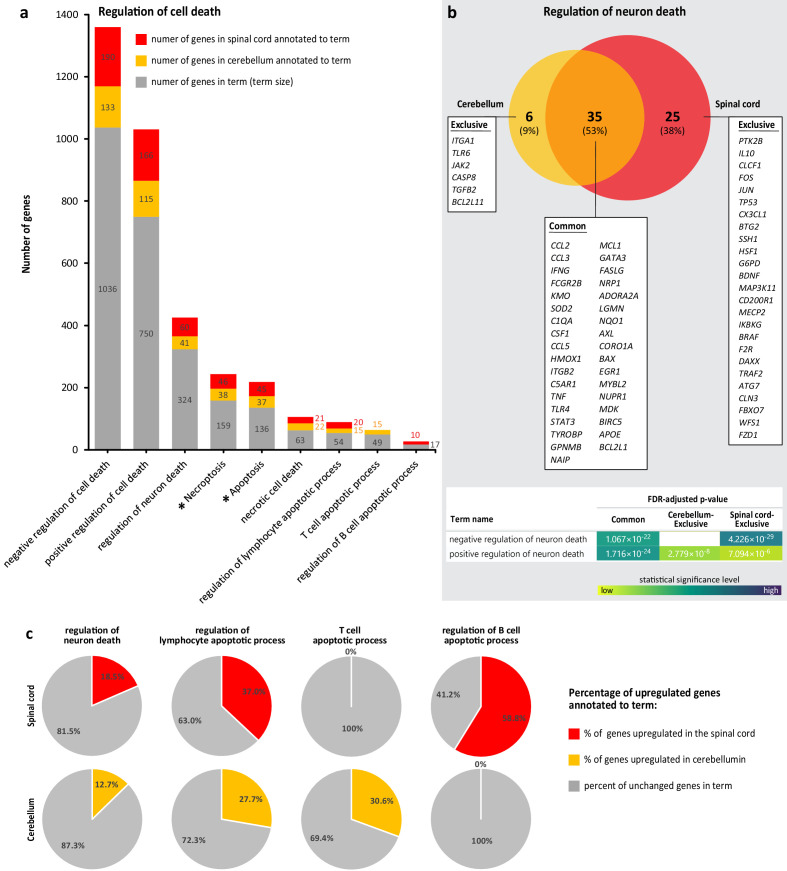
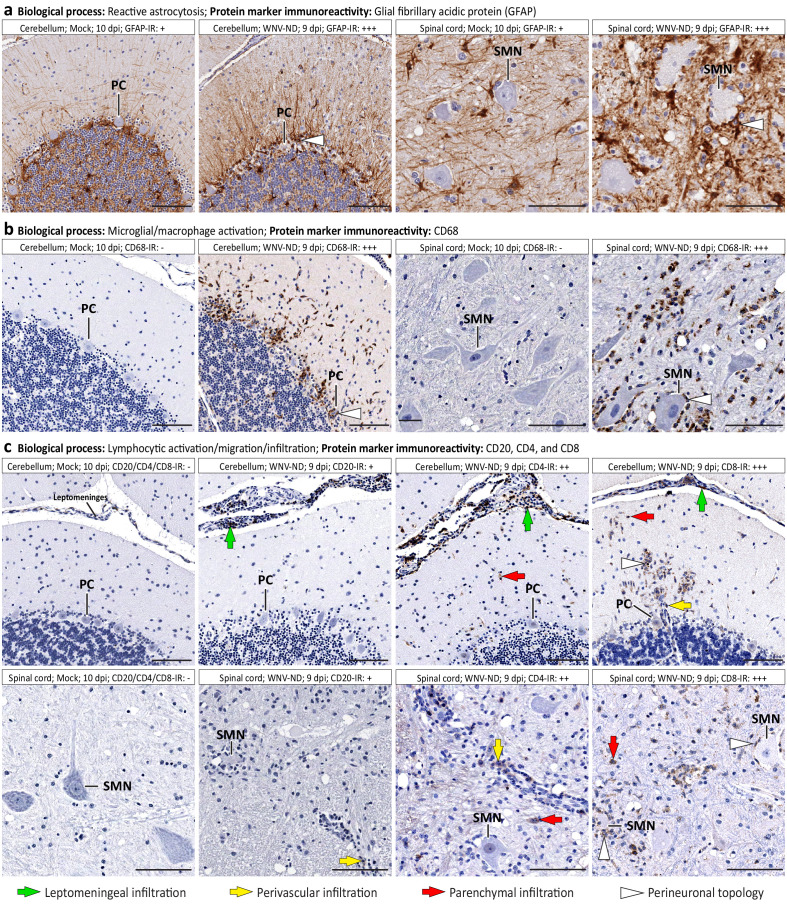
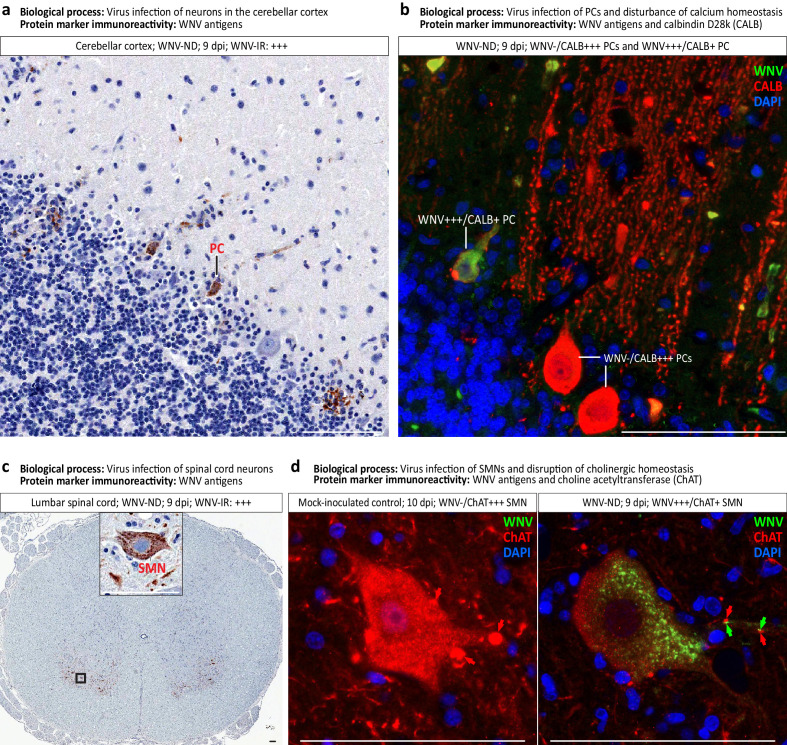
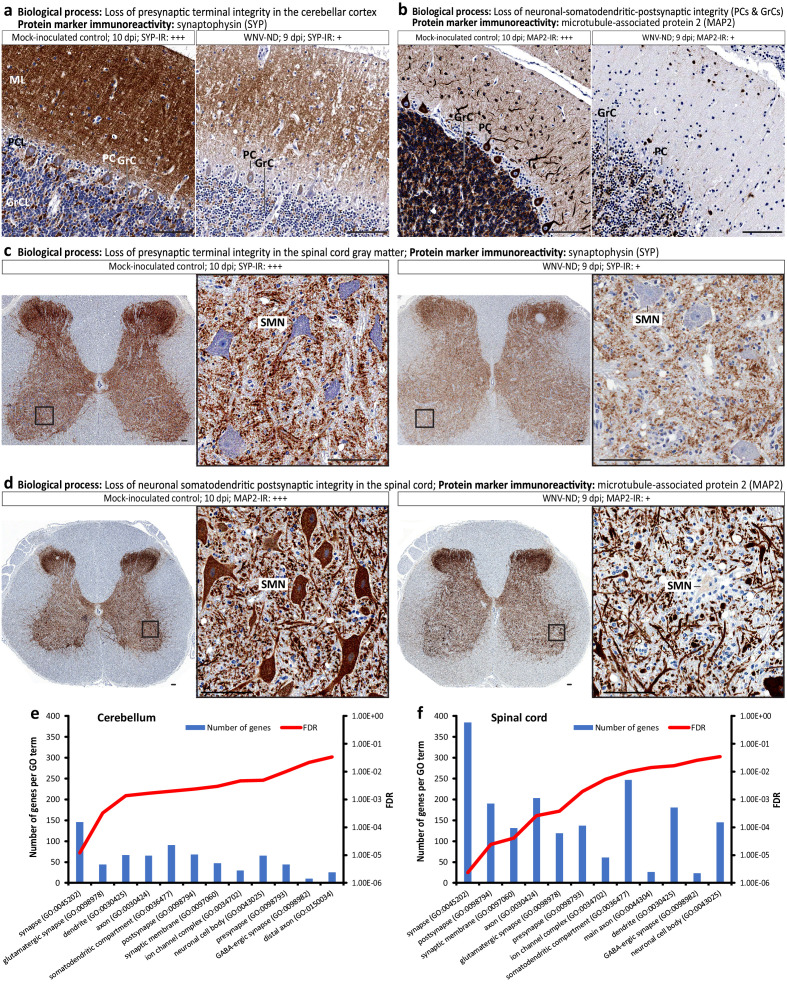
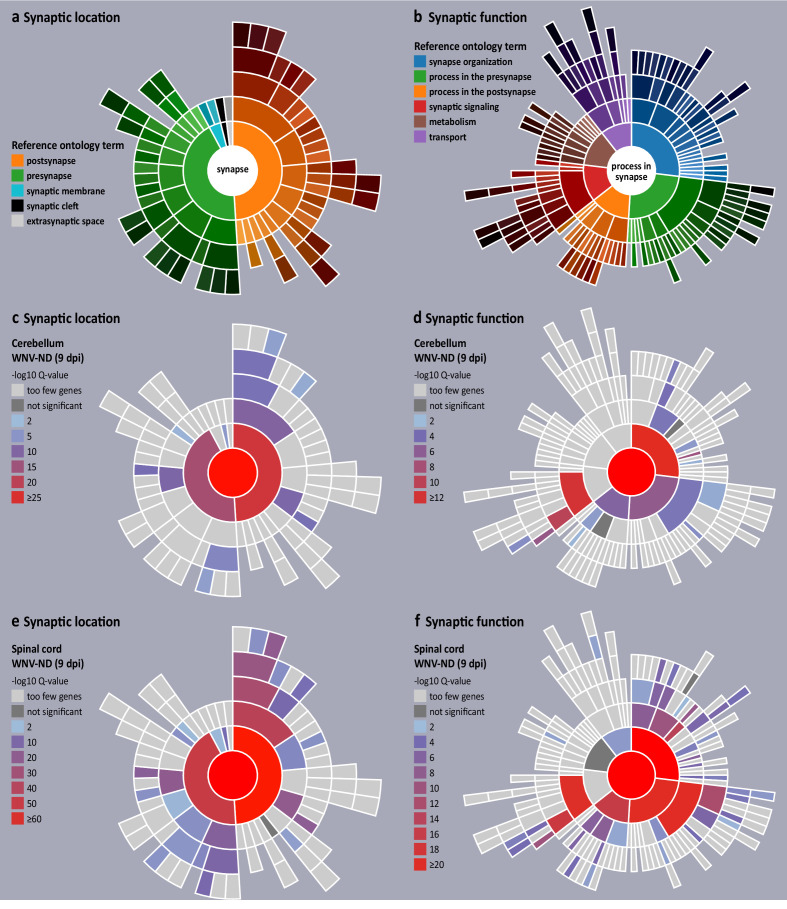
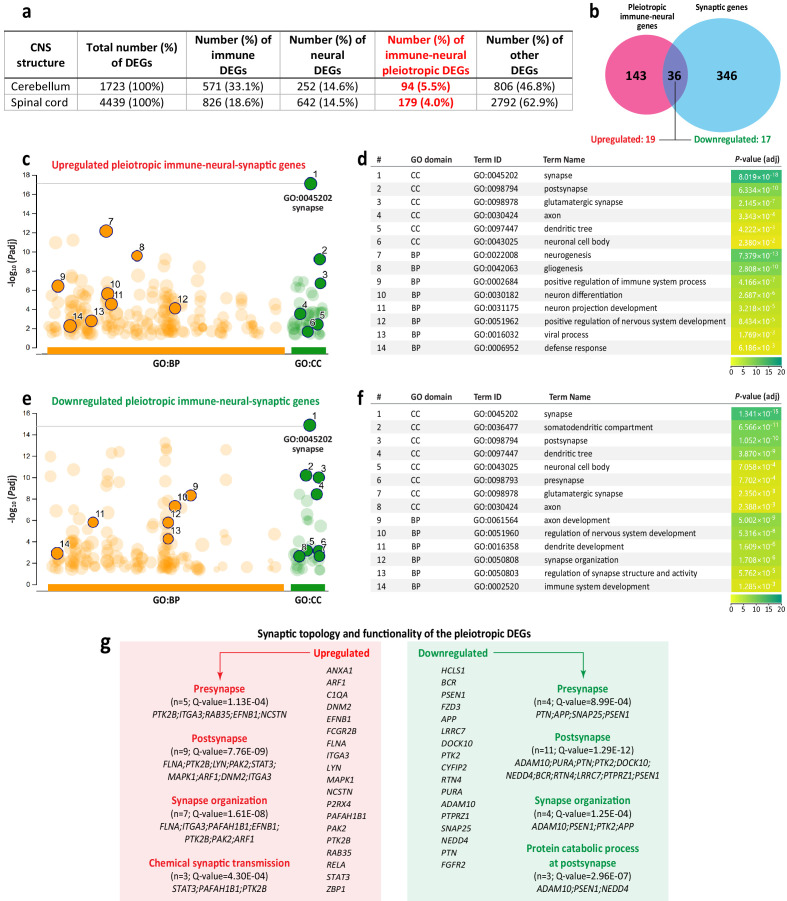
Treatment for many viral infections of the central nervous system (CNS) remains only supportive. Here we address a remaining gap in our knowledge regarding how the CNS and immune systems interact during viral infection. By examining the regulation of the immune and nervous system processes in a nonhuman primate model of West Nile virus neurological disease, we show that virus infection disrupts the homeostasis of the immune-neural-synaptic axis via induction of pleiotropic genes with distinct functions in each component of the axis. This pleiotropic gene regulation suggests an unintended off-target negative impact of virus-induced host immune responses on the neurotransmission, which may be a common feature of various viral infections of the CNS.

Keywords: functional genomics; immune system; immunology; infectious disease; inflammation; microbiology; neuronal system; pleiotropic genes; rhesus macaque; synapses; virus.


Conflict of interest statement

OM, DS, JK, KK, YX, MM, IM, JT, CM, JC, AP No competing interests declared

Figures

Figure 1.
Figure 1.. Transcriptional changes during progression of West Nile virus neurological disease (WNV-ND) converge on the immune and nervous system processes in a central nervous system (CNS)-region-specific manner.
(a and b) Heatmaps for the upregulated (a) or downregulated (b) genes in the cerebellum and spinal cord at indicated days post-inoculation (dpi) with WNV (three animals per time point for each CNS region); based on the fold change (FC) over mock (one animal per time point, pooled). The arbitrary threshold for the visualization is −10 to 10 FC. (c and d) Listed are the top 50 upregulated or downregulated genes that correspond to the yellow boxed areas in a and b, respectively. (e–h) Ratios of the upregulated to downregulated genes (e and g) and Venn diagram comparison of the upregulated and downregulated genes (f and h) in the cerebellum and spinal cord during indicated stages of WNV-ND. (i and j) Identification of the top biological systems significantly enriched for the upregulated (i) or downregulated genes (j) by ORT. FDR, false discovery rate.
Figure 2.
Figure 2.. West Nile virus (WNV) infection alters transcriptional regulation of the developmental and repair processes in the central nervous system (CNS).
(a–d) Enrichment of the developmental process and/or repair in WNV-infected cerebellum (a and b) and spinal cord (c and d) based on the ratios between GO term size (number of genes in term) and intersection size (number of differentially expressed genes annotated to term) at the advanced-symptomatic stage of WNV neurological disease (WNV-ND; 9 dpi). (e) Dissection of the molecular environment for axonal regeneration based on the differential transcriptional regulation of the molecules with established inhibitory or permissive roles in the regulation of axon growth.
Figure 3.
Figure 3.. Visualization of the affected immune and neuronal system pathways during symptomatic stages of West Nile virus neurological disease (WNV-ND).
(a and b) Reference Reactome biological domain bursts for the immune system (a) and neuronal system (b). Each reference burst visualizes the pathways specific to a respective biological system. The largest central node of each burst corresponds to the uppermost level of the domain hierarchy and successive concentrically positioned nodes and arcs represent more specific pathway levels. The major pathway nodes are indicated for each system. (c–j) Diagrams illustrate the coverage of reference bursts for the immune system (c), (d), (g), and (h) or neuronal system (e), (f), (i), and (j) by pathways affected during the early-symptomatic (7 dpi) and advanced-symptomatic (9 dpi) stages of WNV-ND in the cerebellum (c–f) or spinal cord (g–j). Each diagram (c–j) displays the enriched pathway coverage by overlaying the reference domain bursts (light pink) with an orange gradient color based on the p-values derived from an overrepresentation test (reference gradient is provided in each diagram based on the range of p-values from 0 to 0.05; darker colors indicate smaller p-values). Select nodes/pathways are enumerated and listed in the legends at the bottom of the figure.
Figure 4.
Figure 4.. Coordinated transcriptional shifts during the advanced-symptomatic stage of West Nile virus neurological disease (WNV-ND).
(a–h) Graphs show the cumulative distribution of fold change values for groups of differentially expressed genes and select large coordinated shifts from the overall distribution (predominantly under the curve) (a–d) or subtle coordinated shifts from the overall distribution (predominantly above the curve) (e–h) in the cerebellum (a), (b), (e), and (f) and spinal cord (c), (d), (g), and (h). Significantly enriched GO terms (FDR < 0.05) for the plotted groups of genes are shown in the corresponding legends. BP, biological process; CC, cellular component; GO, gene ontology.
Figure 5.
Figure 5.. Dissection of transcriptional regulation of cell death processes during advanced-symptomatic West Nile virus neurological disease (WNV-ND).
(a) Comparative analysis of the number of upregulated genes annotated to significantly enriched (FDR < 0.05) terms associated with cell death processes (BP GO terms) and pathways (KEGG pathways; asterisks) in the cerebellum and spinal cord (numbers of upregulated genes annotated to each term and term sizes are indicated). (b) Venn diagram comparison of the upregulated genes annotated to the term ‘regulation of neuron death’ in the cerebellum and spinal cord with functional characterization of each indicated gene set (gene symbols and statistical details for enriched GO BP terms are provided for each component of Venn diagram; blank: not significant). (c) Percentages of genes in indicated cell-specific terms of interest that were upregulated in WNV-ND relative to the term size (calculated from data in a).
Figure 6.
Figure 6.. Immune cell morphology and topology during advanced-symptomatic West Nile virus neurological disease (WNV-ND).
Representative images illustrate major cellular immune responses (indicated in a–c) by displaying immunoreactivity (IR) for relevant protein markers (brown) in WNV-infected cerebellum and spinal cord versus mock. Labeling keys are provided at the bottom of the figure. Semi-quantitative assessment of the IR is as follows: -, negative; +, minimal; ++; moderate; +++, strong. PC, Purkinje cell. SMN, spinal motor neuron. Scale bars: 100 μm.
Figure 7.
Figure 7.. Virus-infected neuronal cell types and loss of neuronal cell-specific protein markers in West Nile virus neurological disease (WNV-ND).
(a–d) Representative images illustrate identification of the types of neurons infected with WNV in the cerebellar cortex (a and b) and ventral horns of the gray matter in the spinal cord (c and d). Viral infection of specific neuronal types as a major biological process, and immunoreactivity (IR) for each protein marker ((a) and (c): brown; (b) and (d): colors are indicated in top-right corners) are provided for each panel. Red arrows in (d) indicate the ChAT-positive cholinergic presynaptic C-boutons innervating the somata and proximal dendrites of SMNs. Green arrows in (d) point to focal accumulations of WNV+++ granules in the proximal dendrites of WNV-infected SMN. Note that WNV+++ granules are immediately adjacent to few remaining ChAT+ C-boutons. Semi-quantitative assessment of the IR is as follows: -, negative; +, minimal; ++; moderate; +++, strong. PC, Purkinje cell. SMN, spinal motor neuron. Scale bars: 100 μm.
Figure 8.
Figure 8.. Loss of neuronal cell structural organization and function during advanced-symptomatic West Nile virus neurological disease (WNV-ND).
(a–d) Representative images illustrate major pathological processes in the cerebellar cortex and spinal cord gray matter (indicated above each panel) by displaying the immunoreactivity (IR) for relevant protein markers (brown) in WNV-infected cerebellum and spinal cord versus mock-inoculated control. Semi-quantitative assessment of the IR is as follows: -, negative; +, minimal; ++; moderate; +++, strong. (e and f) Ranking of neuronal CC GO terms based on their enrichment values in the cerebellum (e) and spinal cord (f) at the advanced-symptomatic stage (9 dpi) of WNV-ND. Plotted for each CC GO term (x-axes) are the number of differentially expressed genes (left y-axes) and FDR-adjusted p-values (right y-axes). ML, molecular layer. PCL, Purkinje cell layer. GrCL, granule cell layer. PC, Purkinje cell. GrC, granule cell. SMN, spinal motor neuron. Scale bars: 100 μm.
Figure 9.
Figure 9.. Visualization of transcriptional dysregulation of the synaptic organization and function in West Nile virus neurological disease (WNV-ND).
(a and b) Reference sunburst diagrams for synaptic location (a) and synaptic function (b) gene ontologies (GOs). The top-level GO terms ‘synapse’ and ‘process in synapse’ are at the center of corresponding sunbursts. GO terms representing major synaptic subcompartments (a) or synaptic functions (b) are positioned in the next level from the center, color-coded and shown in the legends. Child GO terms are positioned in the successive rings and colored by progressively darkening hues. (c–f) Transcriptional synaptic dysregulation in the cerebellum (c and d) and spinal cord (e and f) is visualized by the overlaying reference sunbursts with a color based on the -log10 Q values (FDR corrected raw p-values) for enriched synaptic GO terms. Specific synaptic GO terms are listed in Table 2. Stringent high-level evidence SynGO settings were applied.
Figure 10.
Figure 10.. Identification and functional analysis of pleiotropic immune-neural-synaptic genes induced by West Nile virus (WNV) infection.
(a) Distribution of differentially expressed genes (DEGs) annotated to the immune or nervous system, or both (immune-neural pleiotropic DEGs; highlighted in red), relative to the total number of DEGs in indicated central nervous system (CNS) structures at the advanced-symptomatic stage of WNV neurological disease (WNV-ND). (b) Venn diagram shows the overlap (n = 36) between the immune-neural pleiotropic and synaptic DEGs in the spinal cord at the advanced-symptomatic stage of WNV-ND (numbers of the up- or downregulated genes in the overlap are indicated). (c–f) Select significantly enriched BP and CC GO terms (orange and green solid circles, respectively) and their respective statistical data (identified using gProfiler) for the upregulated (c and d) or downregulated (e and f) immune-neural-synaptic pleiotropic DEGs. (g) Gene symbols, significantly enriched SynGO terms, and respective statistical data for immune-neural-synaptic pleiotropic DEGs.

Similar articles

Cited by

References

    1. Anderson MA, Burda JE, Ren Y, Ao Y, O'Shea TM, Kawaguchi R, Coppola G, Khakh BS, Deming TJ, Sofroniew MV. Astrocyte scar formation aids central nervous system axon regeneration. Nature. 2016;532:195–200. doi: 10.1038/nature17623. - DOI - PMC - PubMed
    1. Armah HB, Wang G, Omalu BI, Tesh RB, Gyure KA, Chute DJ, Smith RD, Dulai P, Vinters HV, Kleinschmidt-DeMasters BK, Wiley CA. Systemic distribution of west nile virus infection: postmortem immunohistochemical study of six cases. Brain Pathology. 2007;17:354–362. doi: 10.1111/j.1750-3639.2007.00080.x. - DOI - PMC - PubMed
    1. Arroyo J, Miller C, Catalan J, Myers GA, Ratterree MS, Trent DW, Monath TP. ChimeriVax-West nile virus live-attenuated vaccine: preclinical evaluation of safety, immunogenicity, and efficacy. Journal of Virology. 2004;78:12497–12507. doi: 10.1128/JVI.78.22.12497-12507.2004. - DOI - PMC - PubMed
    1. Betsem E, Kaidarova Z, Stramer SL, Shaz B, Sayers M, LeParc G, Custer B, Busch MP, Murphy EL. Correlation of west nile virus incidence in donated blood with west nile neuroinvasive disease rates, united states, 2010-2012. Emerging Infectious Diseases. 2017;23:212–219. doi: 10.3201/eid2302.161058. - DOI - PMC - PubMed
    1. Binder GK, Griffin DE. Interferon-gamma-mediated site-specific clearance of Alphavirus from CNS neurons. Science. 2001;293:303–306. doi: 10.1126/science.1059742. - DOI - PubMed

Publication types

Associated data