

High-quality carnivoran genomes from roadkill samples enable comparative species delineation in aardwolf and bat-eared fox
- PMID: 33599612
- PMCID: PMC7963486
- DOI: 10.7554/eLife.63167
High-quality carnivoran genomes from roadkill samples enable comparative species delineation in aardwolf and bat-eared fox
Abstract
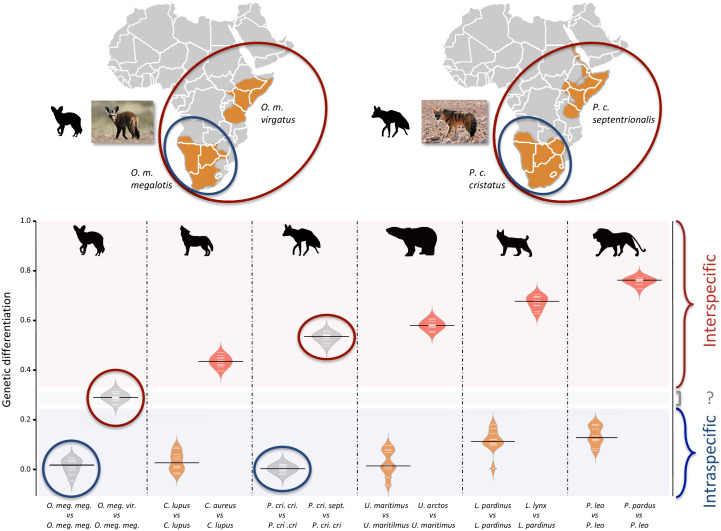
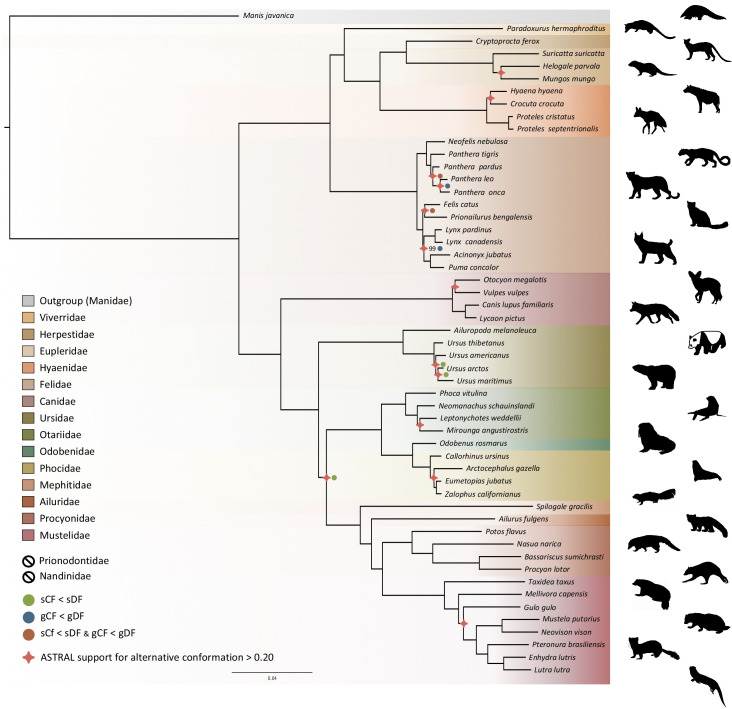
In a context of ongoing biodiversity erosion, obtaining genomic resources from wildlife is essential for conservation. The thousands of yearly mammalian roadkill provide a useful source material for genomic surveys. To illustrate the potential of this underexploited resource, we used roadkill samples to study the genomic diversity of the bat-eared fox (Otocyon megalotis) and the aardwolf (Proteles cristatus), both having subspecies with similar disjunct distributions in Eastern and Southern Africa. First, we obtained reference genomes with high contiguity and gene completeness by combining Nanopore long reads and Illumina short reads. Then, we showed that the two subspecies of aardwolf might warrant species status (P. cristatus and P. septentrionalis) by comparing their genome-wide genetic differentiation to pairs of well-defined species across Carnivora with a new Genetic Differentiation index (GDI) based on only a few resequenced individuals. Finally, we obtained a genome-scale Carnivora phylogeny including the new aardwolf species.
Keywords: carnivora; evolutionary biology; genetics; genomics; phylogenomics; population genomics; roadkill; species delimitation.
© 2021, Allio et al.
Conflict of interest statement
RA, MT, CS, NA, AK, EC, BN, FD No competing interests declared
Figures


Similar articles
-
Ecological Specialization and Evolutionary Reticulation in Extant Hyaenidae.Mol Biol Evol. 2021 Aug 23;38(9):3884-3897. doi: 10.1093/molbev/msab055. Mol Biol Evol. 2021. PMID: 34426844 Free PMC article.
-
Molecular systematics of the Hyaenidae: relationships of a relictual lineage resolved by a molecular supermatrix.Mol Phylogenet Evol. 2006 Mar;38(3):603-20. doi: 10.1016/j.ympev.2005.10.017. Mol Phylogenet Evol. 2006. PMID: 16503281
-
Molecular epidemiology of rabies in bat-eared foxes (Otocyon megalotis) in South Africa.Virus Res. 2007 Oct;129(1):1-10. doi: 10.1016/j.virusres.2007.04.024. Epub 2007 May 29. Virus Res. 2007. PMID: 17537536
-
The primary structure of the hemoglobin from the aardwolf (Proteles cristatus, Hyaenidae).Biol Chem Hoppe Seyler. 1991 Jun;372(6):393-9. doi: 10.1515/bchm3.1991.372.1.393. Biol Chem Hoppe Seyler. 1991. PMID: 1910578
-
Genomic resources and their influence on the detection of the signal of positive selection in genome scans.Mol Ecol. 2016 Jan;25(1):170-84. doi: 10.1111/mec.13468. Epub 2015 Dec 17. Mol Ecol. 2016. PMID: 26562485 Review.
Cited by
-
From roads to biobanks: Roadkill animals as a valuable source of genetic data.PLoS One. 2023 Dec 7;18(12):e0290836. doi: 10.1371/journal.pone.0290836. eCollection 2023. PLoS One. 2023. PMID: 38060478 Free PMC article.
-
Pangolin Genomes Offer Key Insights and Resources for the World's Most Trafficked Wild Mammals.Mol Biol Evol. 2023 Oct 4;40(10):msad190. doi: 10.1093/molbev/msad190. Mol Biol Evol. 2023. PMID: 37794645 Free PMC article.
-
PhylteR: Efficient Identification of Outlier Sequences in Phylogenomic Datasets.Mol Biol Evol. 2023 Nov 3;40(11):msad234. doi: 10.1093/molbev/msad234. Mol Biol Evol. 2023. PMID: 37879113 Free PMC article.
-
Exon Capture Museomics Deciphers the Nine-Banded Armadillo Species Complex and Identifies a New Species Endemic to the Guiana Shield.Syst Biol. 2025 Apr 1;74(2):177-197. doi: 10.1093/sysbio/syae027. Syst Biol. 2025. PMID: 38907999 Free PMC article.
-
When morphology does not fit the genomes: the case of rodent olfaction.Biol Lett. 2023 Apr;19(4):20230080. doi: 10.1098/rsbl.2023.0080. Epub 2023 Apr 12. Biol Lett. 2023. PMID: 37042683 Free PMC article.
References
-
- Abascal F, Corvelo A, Cruz F, Villanueva-Cañas JL, Vlasova A, Marcet-Houben M, Martínez-Cruz B, Cheng JY, Prieto P, Quesada V, Quilez J, Li G, García F, Rubio-Camarillo M, Frias L, Ribeca P, Capella-Gutiérrez S, Rodríguez JM, Câmara F, Lowy E, Cozzuto L, Erb I, Tress ML, Rodriguez-Ales JL, Ruiz-Orera J, Reverter F, Casas-Marce M, Soriano L, Arango JR, Derdak S, Galán B, Juie B, Gut M, Lorente-Galdos B, Andrés-Nieto M, López-Otín C, Valencia A, Gut I, García JL, Guigó R, Murphy WJ, Ruiz-Herrera A, Marques-Bonet T, Roma G, Notredame C, Mailund T, Albà MM, Gabaldón T, Alioto T, Godoy JA. Extreme genomic erosion after recurrent demographic bottlenecks in the highly endangered iberian Lynx. Genome Biology. 2016;17:251. doi: 10.1186/s13059-016-1090-1. - DOI - PMC - PubMed
-
- Allen JA, Tjader R, Lang H. Mammals from british East Africa, collected by the tjäder expedition of 1906. Bulletin of the AMNH. 1909;26:12
-
- Allen R, Ryan H, Davis BW, King C, Frantz L, Irving-Pease E, Barnett R, Linderholm A, Loog L, Haile J, Lebrasseur O, White M, Kitchener AC, Murphy WJ, Larson G. A mitochondrial genetic divergence proxy predicts the reproductive compatibility of mammalian hybrids. Proceedings of the Royal Society B: Biological Sciences. 2020;287:20200690. doi: 10.1098/rspb.2020.0690. - DOI - PMC - PubMed
Publication types
MeSH terms
Associated data
LinkOut - more resources
Full Text Sources
Other Literature Sources
