Review
. 2021 Feb 19;128(4):544-566.
doi: 10.1161/CIRCRESAHA.120.317872. Epub 2021 Feb 18.

Machine Learning in Arrhythmia and Electrophysiology

Affiliations
Review

Machine Learning in Arrhythmia and Electrophysiology

Natalia A Trayanova et al. Circ Res. .

Abstract

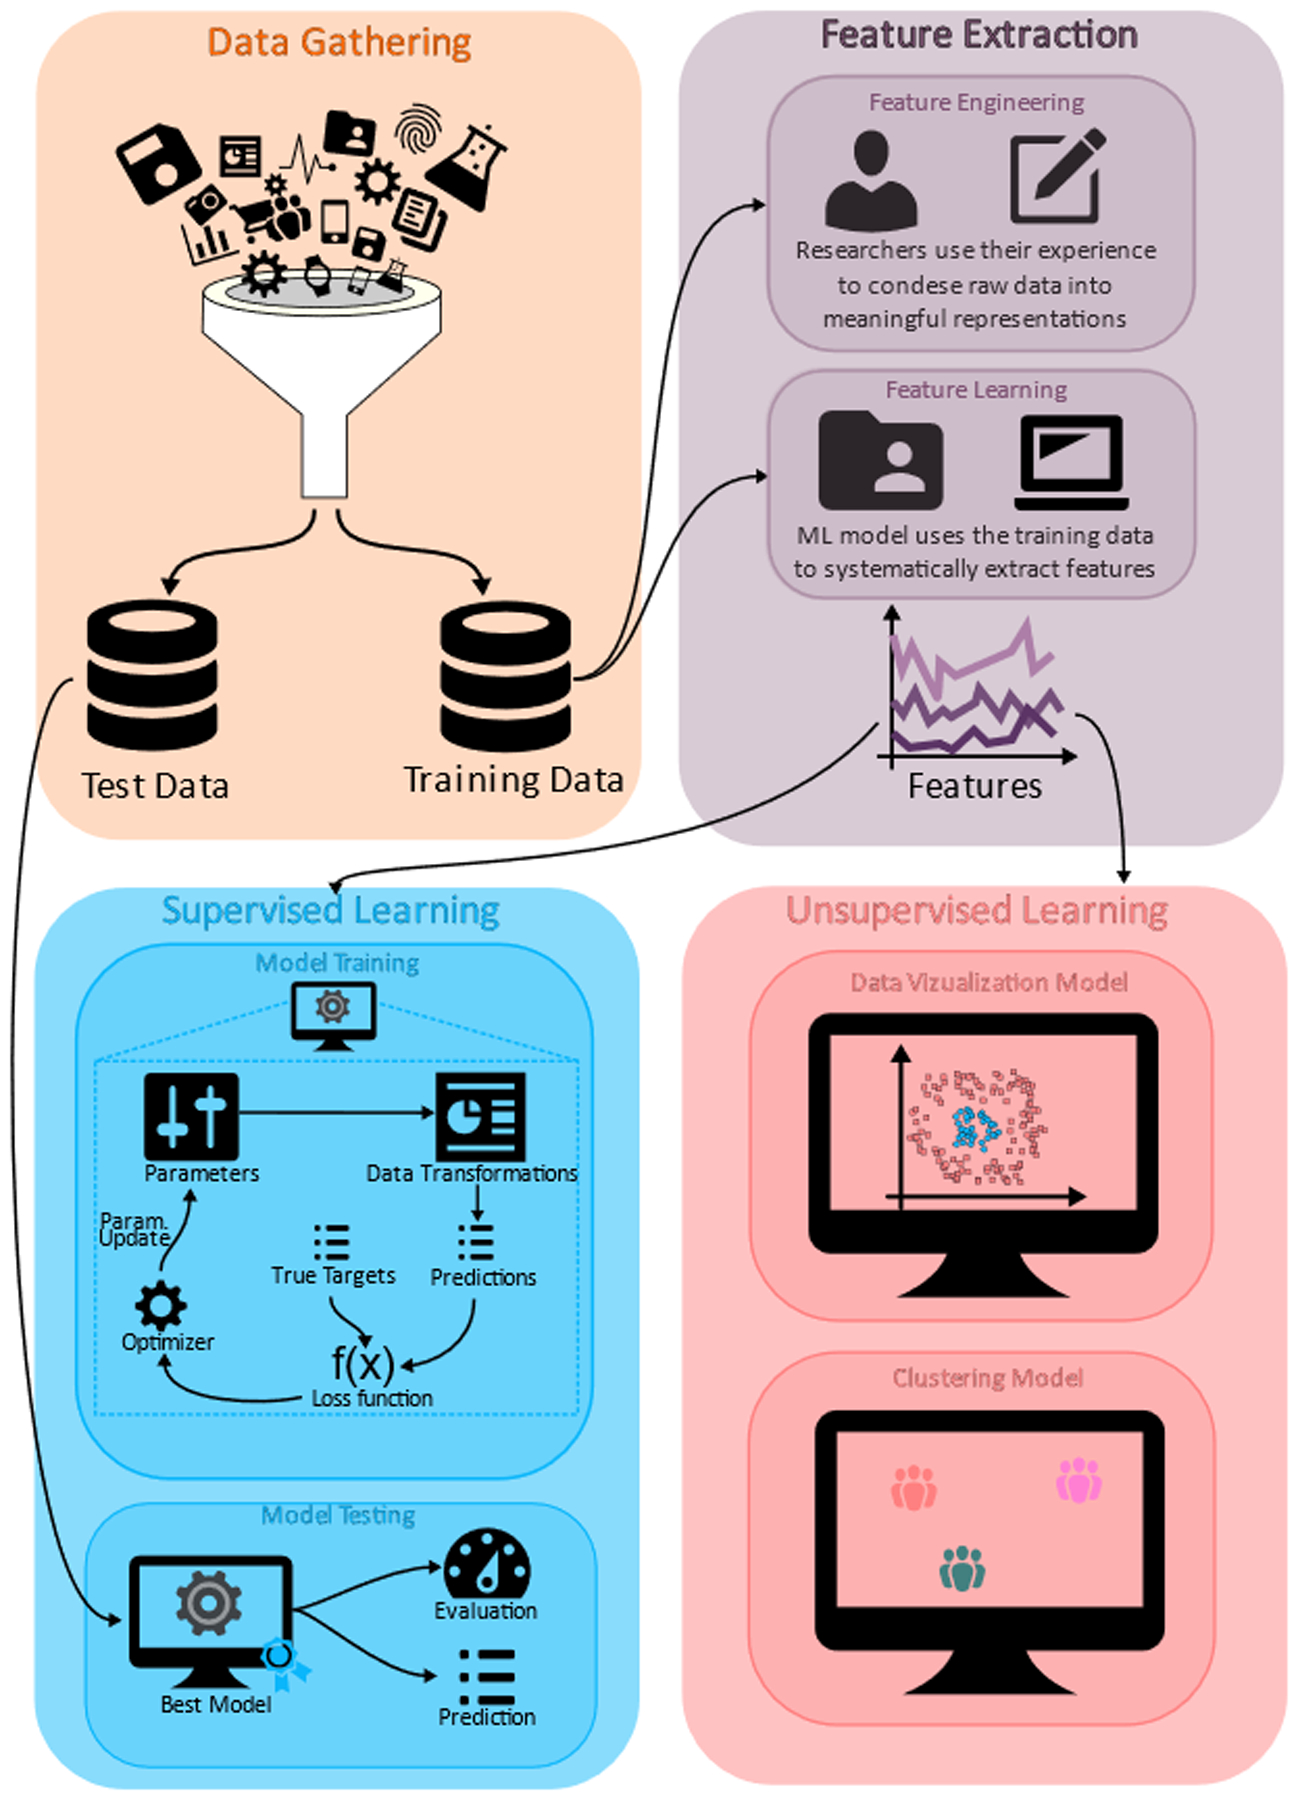
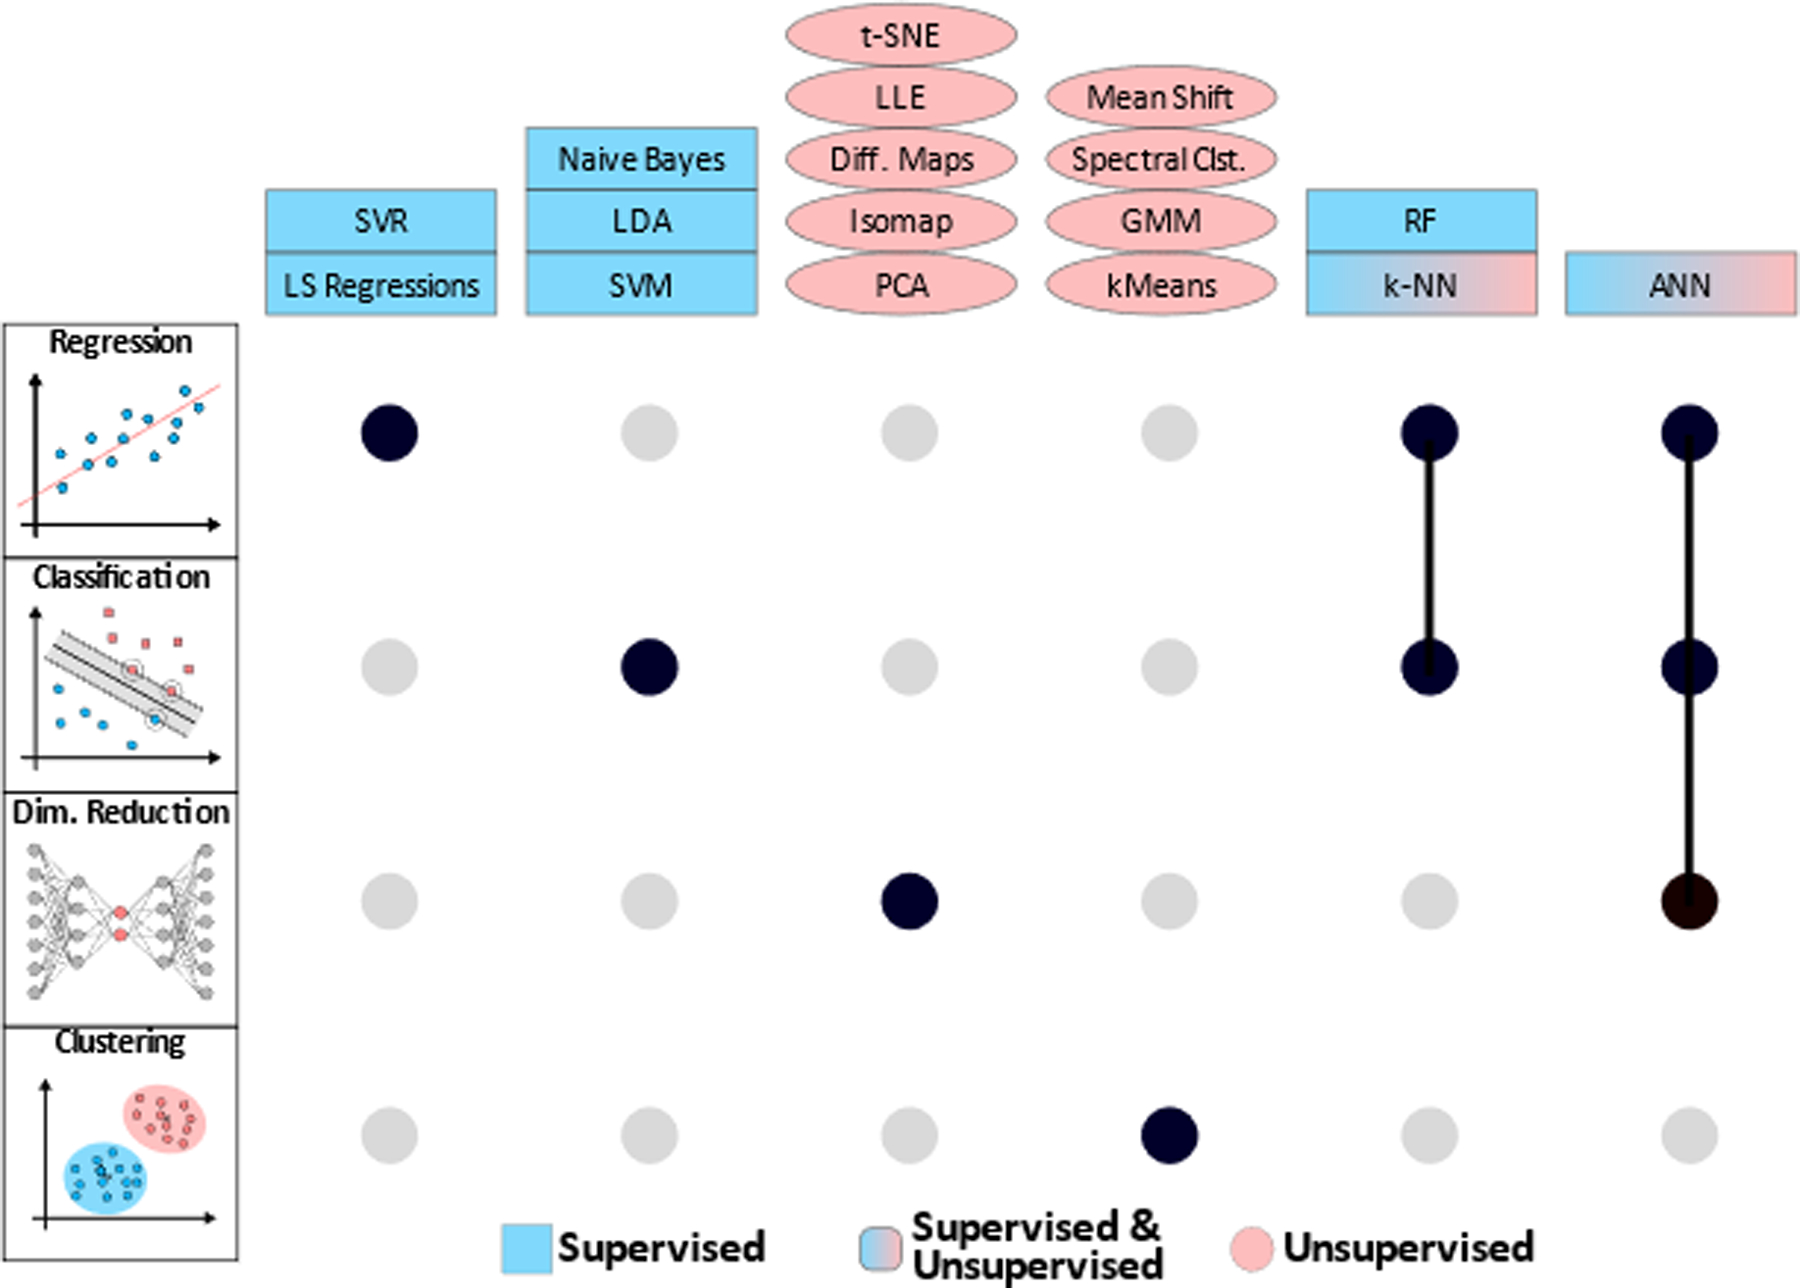
Machine learning (ML), a branch of artificial intelligence, where machines learn from big data, is at the crest of a technological wave of change sweeping society. Cardiovascular medicine is at the forefront of many ML applications, and there is a significant effort to bring them into mainstream clinical practice. In the field of cardiac electrophysiology, ML applications have also seen a rapid growth and popularity, particularly the use of ML in the automatic interpretation of ECGs, which has been extensively covered in the literature. Much lesser known are the other aspects of ML application in cardiac electrophysiology and arrhythmias, such as those in basic science research on arrhythmia mechanisms, both experimental and computational; in the development of better techniques for mapping of cardiac electrical function; and in translational research related to arrhythmia management. In the current review, we examine comprehensively such ML applications as they match the scope of this journal. The current review is organized in 3 parts. The first provides an overview of general ML principles and methodologies that will afford readers of the necessary information on the subject, serving as the foundation for inviting further ML applications in arrhythmia research. The basic information we provide can serve as a guide on how one might design and conduct an ML study. The second part is a review of arrhythmia and electrophysiology studies in which ML has been utilized, highlighting the broad potential of ML approaches. For each subject, we outline comprehensively the general topics, while reviewing some of the research advances utilizing ML under the subject. Finally, we discuss the main challenges and the perspectives for ML-driven cardiac electrophysiology and arrhythmia research.

Keywords: arrhythmias, cardiac; artificial intelligence; atrial fibrillation; electrophysiology; machine learning.


Figures

Figure 1.
Figure 1.. Typical workflow of the machine learning approach.
After the data gathering step, data is split into a train set and a test set. Features (useful representations of the data) are then extracted from the training data, either by performing researcher-defined transformations of the data (feature engineering) or using machine learning techniques (feature learning). Depending on the availability of targets (expected answers from the data) and the desired machine learning task, features can be used in either a supervised or unsupervised setting. In the supervised setting, a model is trained by iteratively minimizing a loss function, which adjusts the model’s parameters such that predictions and targets match. The resulting best model is then used on the test data. In the unsupervised setting in which there are no targets available, data can be used for visualization or identifying sub-groups with common characteristics, i.e., clusters.
Figure 2.
Figure 2.. Classification of machine learning algorithms by task type.
UpSet plot showing algorithms (columns) that can be used for a given task type (rows: regression, classification, dimensionality reduction, and clustering) using black filled-in circles. Gray circles denote algorithms not typically used for the respective task. Connected circles denote algorithms which are used for multiple tasks. Algorithms in blue rectangles are typically supervised, those in red ellipses are typically unsupervised, and algorithms in red and blue can be either supervised or unsupervised.
Figure 3.
Figure 3.. Commonly used machine learning algorithms. A. Least square regressions.
For these models, assume the data can be fitted by a given (usually, linear) function (regression line), but may deviate due to noise, and find the function’s parameters which minimize the sum of squared distances (errors) to the observed data. B. Support Vector Machines. Typically using binary classification in a supervised setting, the model aims to locate a decision boundary based on a subset of data points (support vectors) that maximizes the margin, i.e., the perpendicular distance between the decision boundary and the closest of the data points. C. k-nearest neighbors. These are non-parametric models for classification and regression problems, in which the idea is to use a vote (for example, majority) of the k closest neighbors to inform a new point’s predicted value/label. D. K means clustering. The goal of this unsupervised clustering algorithm is to split the available data into k clusters by re-assigning each point to different clusters until some distance (typically, Euclidean) is minimized between all points and the respective cluster’s centroid. E. Random forests. Decision trees are a supervised approach to classification and regression problems in which input data is sequentially classified through a flowchart-like structure, where the features to be learned are questions about the data (e.g., “Is patient’s age less than 40?”). Random forests use many decision trees to construct an ensembled output, offering a more robust learning algorithm. F. Principal component analysis. The goal is to change coordinates for the data to an orthogonal basis (principal components, in red) that maximizes the variance of the data along these new principal component directions. This allows for a truncation after a suitable number of principal components, reducing the dimensions of the data. G. Neural networks. Shown here is a neural network autoencoder which consists of artificial neurons (or nodes, gray and red circles) organized in layers (shaded in gray), sharing weighted, directed connections (thin black lines) amongst themselves, each being responsible for combining inputs via a propagation function and generating outputs to be passed further in the network. The input data is passed through fully connected layers to produce a low dimensional encoding (red circles) during encoding, then decoded using additionally fully-connected layers to produce the reconstructed image (here the image of the number 5).
Figure 4.
Figure 4.. Clustering and classification of BSPM integrals.
a) Clustering of 57 patterns of BSPM integrals (30 from right and 27 from left atrium) using the K-means algorithm on the torso surface nodes where K is the number of pre-defined ectopy clusters (ECs). For each K, all the foci belonging to the same EC have the same color. b) For each K, left column shows the color and number of each EC resulting from the clustering step (for example blue-k2–0 refers to blue EC, equivalent to class 0, when k=2), while right column shows the classification results identifying the ectopic site that is not well classified with the color of the correct group, to which it really belongs. Reproduced from [].
Figure 5.
Figure 5.. Substrate spatial complexity analysis.
(A) Flowchart of the analysis. Signal intensity patterns from cardiac LGE-MRI were analyzed using a Fourier-like technique for assessment of global irregularity. This analysis generated features that were used in an ML algorithm, which yielded a complexity score ranging from 0 to 1, where 0 represents low arrhythmic risk and 1 represents high arrhythmic risk. (B, C) Eigenvectors (sine-like functions) of varying frequencies oscillating over graphs encoding patient-specific LV size and geometry were compared with signal intensity patterns to generate Fourier coefficients. These coefficients were then used in the ML algorithm. Each panel (B and C) shows a different eigenvector frequency. Colors represent amplitude of the sine-like function. (D) Example of substrate spatial complexity analysis showing LGE-MRI-derived scar pattern from a patient with a low scar burden (12.1 g) but a high complexity score (CS; 0.99) who ultimately had a VA event. Modified from [].
Figure 6.
Figure 6.
(A) Detecting regions in the atria containing sites of rotational activity. CNN was trained on regional intracardiac voltage time-series data from basket catheters positioned in left then right atrium (left-most column). Explainability analysis (Methods column) to probe how CNN interprets intracardiac AF patterns. In training, ML uses forward propagation of an input tile, creating weights w (red), then backward propagation to update internal weights using gradients x (green). This training process matches each input with its known output label (0,1). Explainability is applied once the CNN is trained. (a) Weights w and (b) gradients x of the output of the fifth convolutional layer are combined by the dot-product operation. (c) Gradient-weighted class activation mapping (Grad-CAM) heatmap plots the importance of each input pixel to the CNN classification. Brighter (higher value) pixels have a greater influence on the CNN. Gradient-weighted class activation mapping (Grad-CAM) heatmaps (Results column) of trained CNN empirically detect AF features identified by experts with domain knowledge. Numbered from top to bottom: 1, Input vector showing site of interest in AF in a 49-year-old female. The heatmap site in Conv 5 coincides with the precise location in the heart coded by experts as a site of rotation. 2, AF in a 63-year-old female with AF, showing 2 concurrent regions of interest. 3, AF in a 64-year-old man, showing 3 regions of interest. 4, AF in 74-year-old-female showing no region of interest. In each case, Grad-CAM heatmaps empirically identified tile regions identified by experts with physiological knowledge, although CNN were not explicitly trained in expert rules. Reproduced and adapted from []. (B) Overview of study by Shade et al in which the researchers predicted recurrence of AF post-PVI by conducting simulations of AF induction in atrial models reconstructed from paroxysmal AF patients with fibrosis on LGE-MRI, and trained an ML classifier on simulated AF episodes and on imaging features to predict, pre-procedurally, the outcome of the clinical procedure. Modified from [].

References

    1. Johnson KW, Torres Soto J, Glicksberg BS, Shameer K, Miotto R, Ali M, Ashley E, Dudley JT. Artificial Intelligence in Cardiology. J. Am. Coll. Cardiol 2018;71:2668–2679. - PubMed
    1. Krittanawong C, Zhang HJ, Wang Z, Aydar M, Kitai T. Artificial Intelligence in Precision Cardiovascular Medicine. J. Am. Coll. Cardiol 2017;69:2657–2664. - PubMed
    1. Lyon A, Mincholé A, Martínez JP, Laguna P, Rodriguez B. Computational techniques for ECG analysis and interpretation in light of their contribution to medical advances. J R Soc Interface. 2018;15:20170821. - PMC - PubMed
    1. Perez MV, Mahaffey KW, Hedlin H, et al. Large-scale assessment of a smartwatch to identify atrial fibrillation. N Engl J Med. 2019;381:1909–1917. - PMC - PubMed
    1. Muthalaly RG, Evans RM. Applications of Machine Learning in Cardiac Electrophysiology. Arrhythmia Electrophysiol Rev. 2020;9:71–77. - PMC - PubMed

Publication types

MeSH terms