

US State Disparities in Life Expectancy, Disability-Free Life Expectancy, and Disabled Life Expectancy Among Adults Aged 25 to 89 Years
- PMID: 33600246
- PMCID: PMC7958042
- DOI: 10.2105/AJPH.2020.306064
US State Disparities in Life Expectancy, Disability-Free Life Expectancy, and Disabled Life Expectancy Among Adults Aged 25 to 89 Years
Abstract
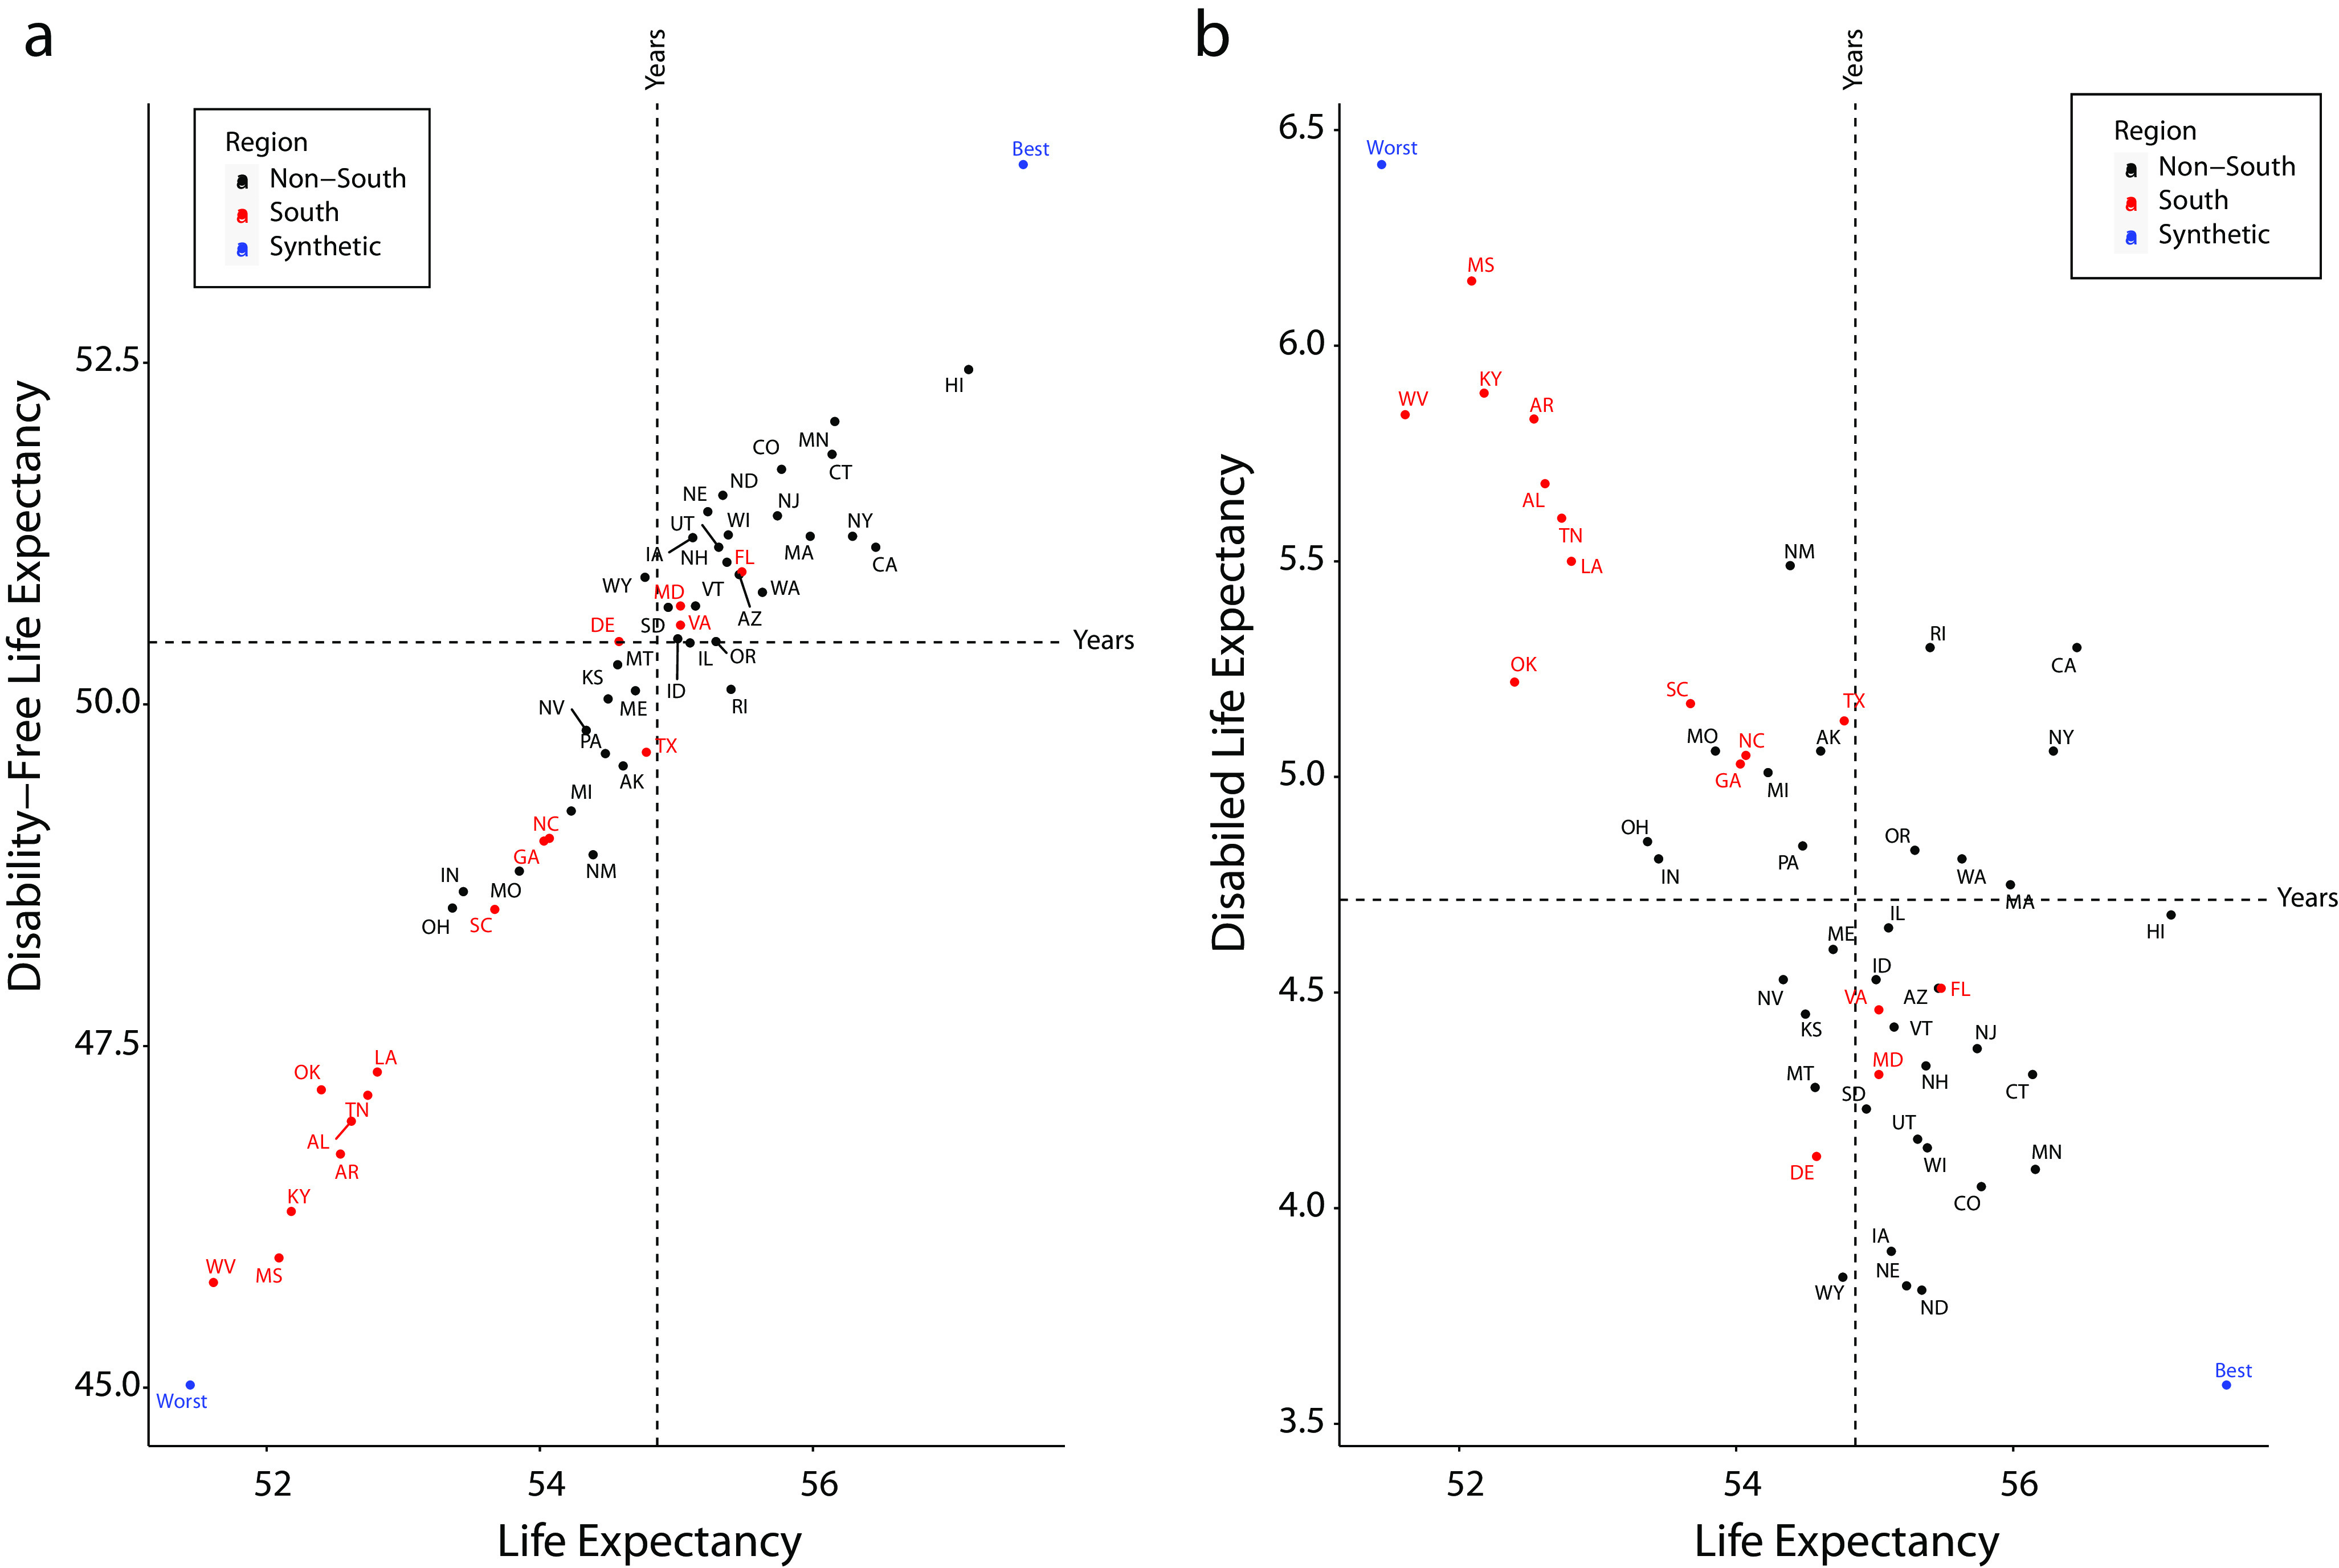
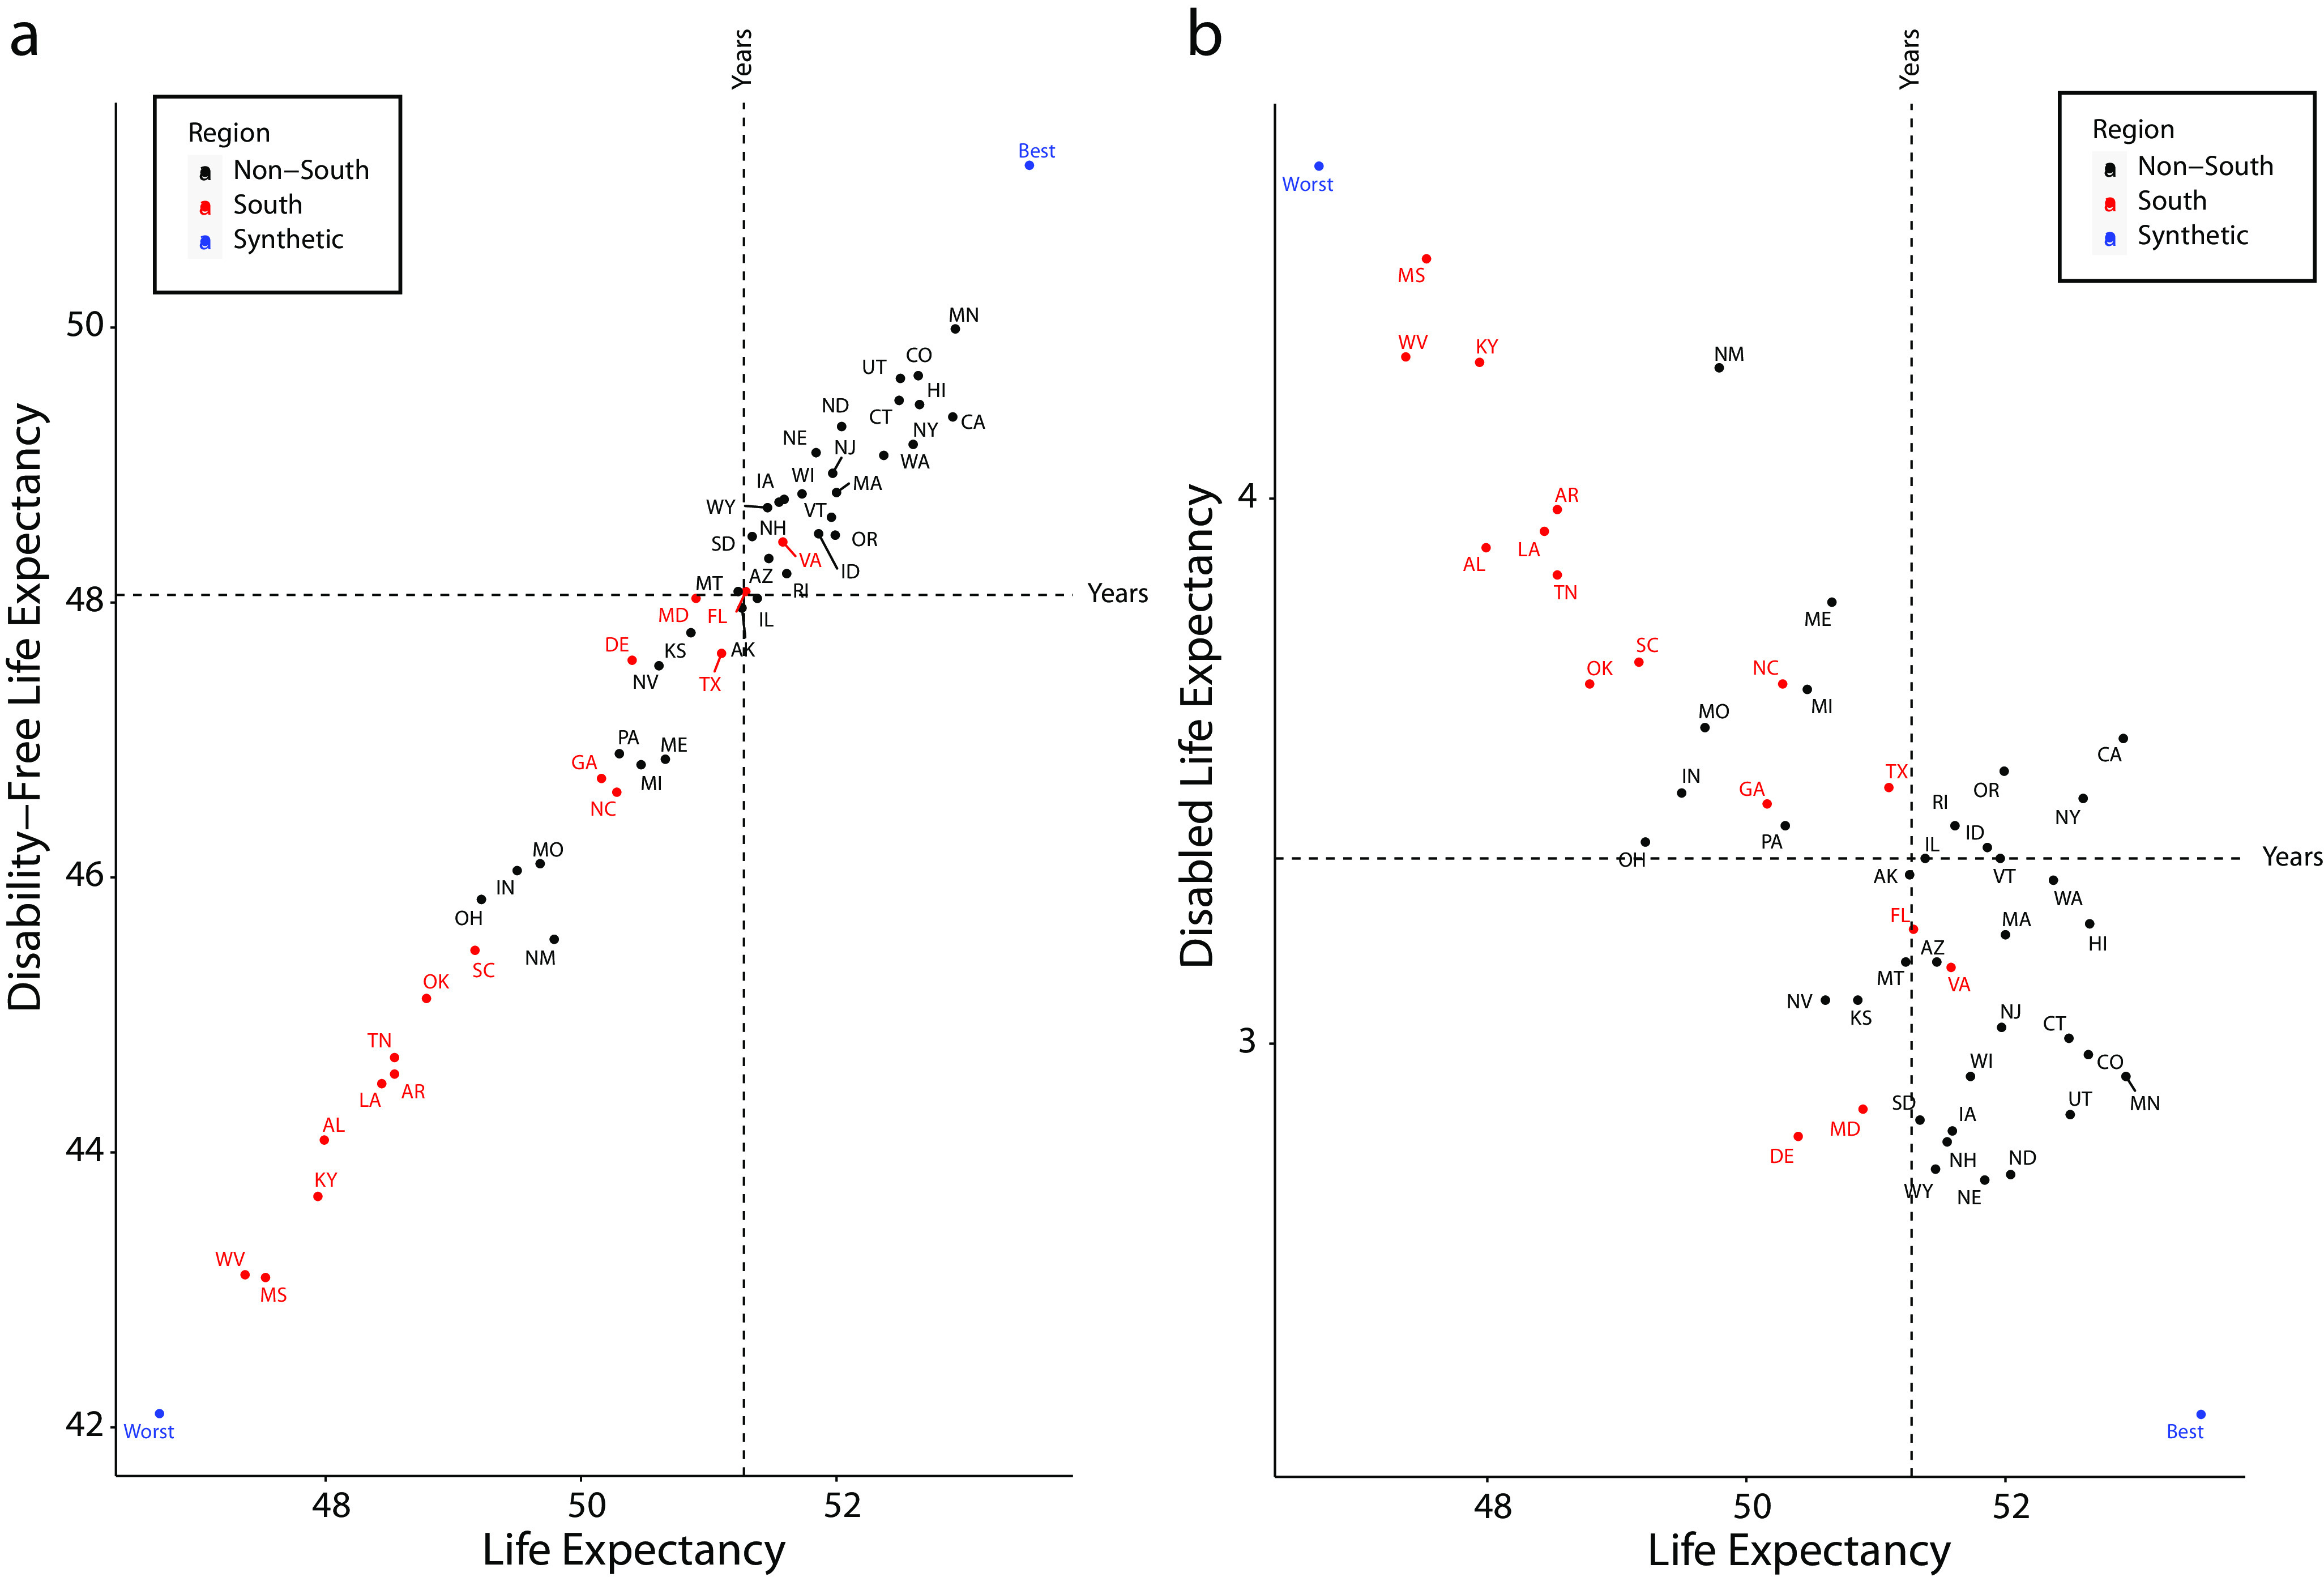
Objectives. To estimate total life expectancy (TLE), disability-free life expectancy (DFLE), and disabled life expectancy (DLE) by US state for women and men aged 25 to 89 years and examine the cross-state patterns.Methods. We used data from the 2013-2017 American Community Survey and the 2017 US Mortality Database to calculate state-specific TLE, DFLE, and DLE by gender for US adults and hypothetical worst- and best-case scenarios.Results. For men and women, DFLEs and DLEs varied widely by state. Among women, DFLE ranged from 45.8 years in West Virginia to 52.5 years in Hawaii, a 6.7-year gap. Men had a similar range. The gap in DLEs across states was 2.4 years for women and 1.6 years for men. The correlation among DFLE, DLE, and TLE was particularly strong in southern states. The South is doubly disadvantaged: residents have shorter lives and spend a greater proportion of those lives with disability.Conclusions. The stark variation in DFLE and DLE across states highlights the large health inequalities present today across the United States, which have significant implications for individuals' well-being and US states' financial costs and medical care burden.
Figures
Comment in
-
Elevating the Value of Health to Guide Decision-Making in the Long Term.Am J Public Health. 2021 Apr;111(4):562-563. doi: 10.2105/AJPH.2021.306180. Am J Public Health. 2021. PMID: 33689412 Free PMC article. No abstract available.
Similar articles
-
Regional patterns of disability-free life expectancy and disability-adjusted life expectancy: global Burden of Disease Study.Lancet. 1997 May 10;349(9062):1347-52. doi: 10.1016/S0140-6736(96)07494-6. Lancet. 1997. PMID: 9149696
-
Changes in disability-free life expectancy (DFLE) at birth between 2000 and 2010 across Japanese prefectures.Int J Public Health. 2016 Sep;61(7):739-49. doi: 10.1007/s00038-016-0847-3. Epub 2016 Jun 28. Int J Public Health. 2016. PMID: 27349481
-
Fruit and vegetable consumption and its contribution to inequalities in life expectancy and disability-free life expectancy in ten European countries.Int J Public Health. 2019 Jul;64(6):861-872. doi: 10.1007/s00038-019-01253-w. Epub 2019 Jun 11. Int J Public Health. 2019. PMID: 31183533 Free PMC article.
-
Health inequalities are worsening in the North East of England.Br Med Bull. 2020 Jul 9;134(1):63-72. doi: 10.1093/bmb/ldaa008. Br Med Bull. 2020. PMID: 32462181 Free PMC article. Review.
-
Loss in life expectancy and gain in life years as measures of cancer impact.Cancer Epidemiol. 2019 Jun;60:168-173. doi: 10.1016/j.canep.2019.04.005. Epub 2019 May 1. Cancer Epidemiol. 2019. PMID: 31054465 Review.
Cited by
-
US State Policy Contexts and Population Health.Milbank Q. 2023 Apr;101(S1):196-223. doi: 10.1111/1468-0009.12617. Milbank Q. 2023. PMID: 37096608 Free PMC article.
-
Heterogeneity in Disparities in Life Expectancy Across US Metropolitan Areas.Epidemiology. 2022 Nov 1;33(6):890-899. doi: 10.1097/EDE.0000000000001537. Epub 2022 Oct 5. Epidemiology. 2022. PMID: 36220582 Free PMC article.
-
Trends in lifespan variation across the spectrum of rural and urban places in the United States, 1990-2017.SSM Popul Health. 2022 Aug 22;19:101213. doi: 10.1016/j.ssmph.2022.101213. eCollection 2022 Sep. SSM Popul Health. 2022. PMID: 36059373 Free PMC article.
-
Healthy life expectancy by county, race, and ethnicity in the USA, 2009-19: a systematic analysis of health disparities.Lancet Reg Health Am. 2025 Apr 17;45:101064. doi: 10.1016/j.lana.2025.101064. eCollection 2025 May. Lancet Reg Health Am. 2025. PMID: 40475811 Free PMC article.
-
Educational disparities in joint pain within and across US states: do macro sociopolitical contexts matter?Pain. 2023 Oct 1;164(10):2358-2369. doi: 10.1097/j.pain.0000000000002945. Epub 2023 Jul 3. Pain. 2023. PMID: 37399230 Free PMC article.
References
Publication types
MeSH terms
Grants and funding
LinkOut - more resources
Full Text Sources
Other Literature Sources
Medical
Miscellaneous
