. 2021 Mar 22;6(6):e141690.
doi: 10.1172/jci.insight.141690.

Aging imparts cell-autonomous dysfunction to regulatory T cells during recovery from influenza pneumonia

Affiliations

Aging imparts cell-autonomous dysfunction to regulatory T cells during recovery from influenza pneumonia

Luisa Morales-Nebreda et al. JCI Insight. .

Abstract

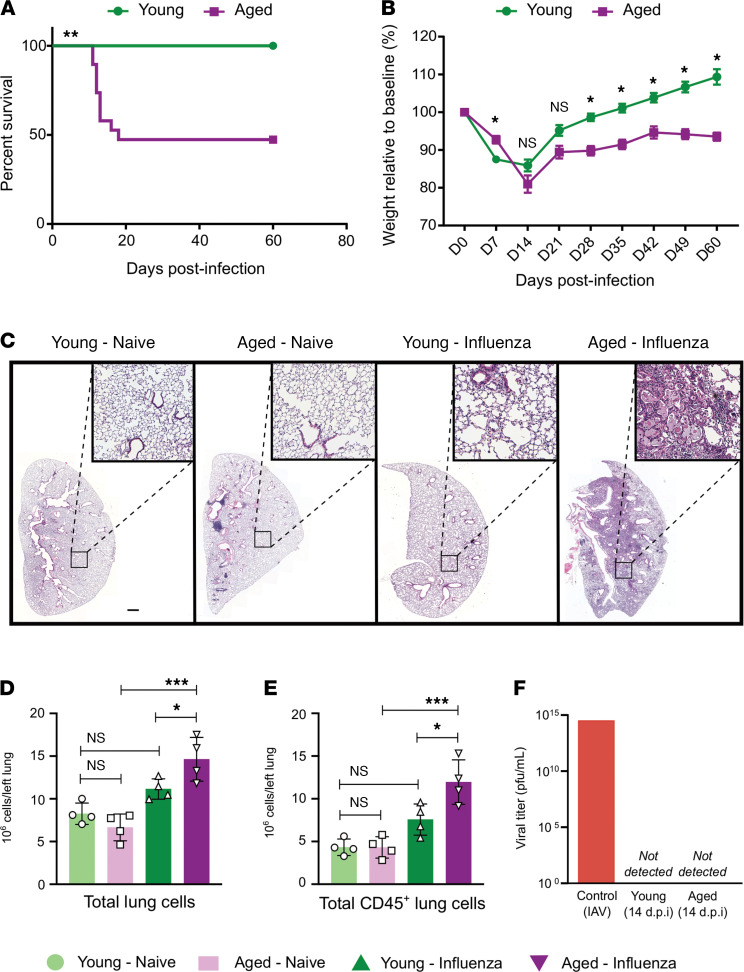
Regulatory T (Treg) cells orchestrate resolution and repair of acute lung inflammation and injury after viral pneumonia. Compared with younger patients, older individuals experience impaired recovery and worse clinical outcomes after severe viral infections, including influenza and SARS coronavirus 2 (SARS-CoV-2). Whether age is a key determinant of Treg cell prorepair function after lung injury remains unknown. Here, we showed that aging results in a cell-autonomous impairment of reparative Treg cell function after experimental influenza pneumonia. Transcriptional and DNA methylation profiling of sorted Treg cells provided insight into the mechanisms underlying their age-related dysfunction, with Treg cells from aged mice demonstrating both loss of reparative programs and gain of maladaptive programs. Strategies to restore youthful Treg cell functional programs could be leveraged as therapies to improve outcomes among older individuals with severe viral pneumonia.

Keywords: Aging; T cells.


Conflict of interest statement

Conflict of interest: BDS has a pending patent application — US patent application 15/542,380, “Compositions and Methods to Accelerate Resolution of Acute Lung Inflammation.”

Figures

Figure 1
Figure 1. Aged mice demonstrate increased mortality and lung inflammation during recovery from influenza infection.
(A) Survival curve comparison of young (2 months, n = 20) and aged (18 months, n = 19) WT mice using log-rank (Mantel-Cox) test. (B) Weight loss percentage from baseline in young (2–4 months, n = 20) and aged (18–22 months, n = 19) mice compared using a mixed-effects model (REML) with Sidak’s post hoc multiple-comparison test. Data presented as mean ± SEM. (C) Representative lung histopathology (H&E staining) of young and aged mice during the naive state and recovery phase after influenza infection (day 60). Original magnification ×10. Scale bar: 500 μm. (D) Flow cytometry quantitative analysis of total number of cells and (E) total number of CD45+ cells from left lung during the naive state and recovery phase from influenza infection. (F) Viral titer measurement of lung homogenates in young and aged mice 14 days after infection. Positive control from influenza A/WSN/33 (H1N1) viral stock. n = 4 mice/group (young — influenza and aged — influenza). Data presented as mean ± SD, 1-way ANOVA with Holm-Sidak’s post hoc testing for multiple comparisons (D and E). *P < 0.05; **P < 0.005; ***P < 0.0005. NS, not significant. n = 4 mice/group (young — naive, aged — naive, young — influenza, and aged — influenza) for D and E.
Figure 2
Figure 2. Aging results in failure to repopulate the alveolar epithelial-capillary barrier during recovery 60 days after influenza infection.
(A) Representative flow cytometry contour plot analysis of type II alveolar epithelial cells (AT2). See Supplemental Figure 2 for parent gating. (B) CD326+MHCII+ type II alveolar epithelial cells as a percentage of CD45T1αCD31 cells. (C) Total type II alveolar epithelial cells from left lung. (D) Representative flow cytometry contour plot analysis of endothelial cells. (E) CD326CD31+ endothelial cells as a percentage of CD45T1α cells. (F) Total endothelial cells from left lung. (G) Representative flow cytometry contour plot analysis of Krt5+ cells. (H) Krt5+ epithelial cells as a percentage of CD45CD31CD326+ cells. Data presented as mean ± SD, 1-way ANOVA with Holm-Sidak’s post hoc testing for multiple comparisons (B, E, and H) or Mann-Whitney test (C and F). *P < 0.05; **P < 0.005; ***P < 0.0005. NS, not significant. n = 4 mice/group (young — naive, aged — naive, young — influenza, and aged — influenza) for all panels.
Figure 3
Figure 3. Age determines the tissue-protective phenotype of Treg cells during influenza-induced lung injury.
(A) Schematic of experimental design. (B) Survival curve of adoptive Treg cell transfer experiments. n = 5 (young — PBS), 14 (aged — PBS), 9 (young into young), 9 (aged into aged), 9 (aged into young) and 11 (young into aged) animals per group. (C) Schematic of experimental design. (D) Survival curve of adoptive Treg cell transfer experiments in Foxp3DTR mice. n = 7 to 8 animals per group except for the Foxp3DTR group (n = 3). DTx denotes diphtheria toxin. Survival curves of mice compared using log-rank (Mantel-Cox) test. *P < 0.05; **P < 0.005.
Figure 4
Figure 4. Young and aged Treg cells differ in their transcriptional response during recovery from influenza infection.
(A) Schematic of experimental design. (B) Principal component analysis of 3,132 differentially expressed genes identified from a generalized linear model and ANOVA-like testing with FDR q value < 0.05. Ellipses represent normal contour lines with 1 standard deviation probability. (C) K-means clustering of 3,132 genes with an FDR q value < 0.05 comparing the cell populations from B with k = 4 and scaled as z scores across rows. Top 5 gene ontology (GO) processes derived from clusters I, III, and IV and top 10 GO processes derived from cluster II are annotated and ranked by –log10-transformed FDR q value. (D) Average z scores for the 4 clusters shown in C. Violin plots show median and quartiles. One-way ANOVA with 2-stage linear step-up procedure of Benjamini, Krieger, and Yekutieli with Q = 5%. *q < 0.05. n = 5 mice/group (young — naive, aged — naive, young — influenza, and aged — influenza) for all panels.
Figure 5
Figure 5. Young Treg cells upregulate a prorepair transcriptional program during recovery from influenza infection.
(A) Fold change–fold change plot for the young Treg cell response to influenza infection versus the aged Treg cell response to influenza infection highlighting genes exhibiting q < 0.05 and fold change > 0.5 (green dots = young and purple dots = aged). Numbers of differentially expressed genes are indicated. (B) Top 20 gene ontology (GO) processes derived from differentially expressed genes (q < 0.05) from A for young Treg cells (1,174 genes) and aged Treg cells (288 genes) are annotated and ranked by –log10-transformed FDR q value. Red font denotes prorepair processes in young Treg cells n = 5 mice/group (young — naive, aged — naive, young — influenza, and aged — influenza) for all panels.
Figure 6
Figure 6. Aged Treg cells downregulate prorepair programs during recovery from influenza pneumonia when compared with young hosts.
(A) MA plot comparing gene expression of young Treg versus aged Treg cells during the recovery phase from influenza infection. Genes of interest are annotated. (B) Gene set enrichment analysis (GSEA) dot plot highlighting key statistics (FDR q value and normalized enrichment score or NES) and gene set enrichment per phenotype. Genes were ordered by log2(fold change) and ranked by the aged Treg cell phenotype. Red dots denote gene sets with a positive enrichment score or enrichment at the top of the ranked list. Blue dots denote gene sets with a negative enrichment score or enrichment at the bottom of the ranked list. n = 5 mice/group (young — influenza and aged — influenza) for all panels.
Figure 7
Figure 7. Aged lung Treg cells fail to upregulate a prorepair transcriptional program to the same extent as young Treg cells during recovery from influenza infection.
(A) MA plot comparing gene expression of young Treg cells during the naive state with young Treg cells during the recovery phase of influenza infection. Genes of interest are annotated and y axis denotes fold-change dynamic range. (B) MA plot comparing gene expression of aged Treg cells during the naive state with aged Treg cells during the recovery phase of influenza infection. Genes of interest are annotated and y axis denotes fold-change dynamic range. Note that the y axis extends to +8 in A and +5 in B. (C and D) GSEA dot plot results highlighting key statistics (FDR q value and normalized enrichment score or NES) and enriched gene sets per phenotype. Genes were ordered by log2(fold change) and ranked by the young Treg cell–influenza (C) or aged Treg cell–influenza (D) phenotype. Red dots denote gene sets with a positive enrichment score or enrichment at the top of the ranked list. Blue dots denote gene sets with a negative enrichment score or enrichment at the bottom of the ranked list. (E and F) Top 3 GSEA positive enrichment plots for the young Treg cell–influenza (E) or aged Treg cell–influenza (F) phenotype. n = 5 mice/group (young — naive, aged — naive, young — influenza, and aged — influenza) for all panels.
Figure 8
Figure 8. Comparison of enriched gene ontology processes during recovery from influenza pneumonia in young and aged Treg cells.
Venn diagram partitioning into upregulated genes in young Treg cells during recovery from influenza infection (green, 1,336 genes), upregulated genes in aged Treg cells during recovery from influenza infection (light purple, 103 genes), and upregulated genes in both young and aged Treg cells during recovery from influenza infection (dark purple intersection, 342 genes). FDR q value < 0.05. A hypergeometric P value is shown. Top 10 gene ontology (GO) processes derived from genes in each partition of the Venn diagram are annotated and ranked by –log10-transformed FDR q value. n = 5 mice/group (young — influenza and aged — influenza).
Figure 9
Figure 9. Aging results in induction of a Treg cell proinflammatory phenotype after recovery from influenza infection.
(A) Representative flow cytometry contour plot analysis of central Treg (cTreg) cells and effector Treg (eTreg) cells. Percentage of lung cTreg cells (CD62LhiCD44lo) and lung eTreg cells (CD62LloCD44hi) of lung Treg cells. n = 7 mice/group (young — naive, aged — naive, young — influenza, and aged — influenza). (B) Representative contour plots and pairwise comparison of percentage of CD4+Foxp3+ cells expressing T helper cell canonical transcription factors. (C) Representative contour plots and pairwise comparison of percentage of CD4+Foxp3+ cells expressing proinflammatory cytokines. Data presented as mean ± SD, 1-way ANOVA with Holm-Sidak post hoc testing for multiple comparisons (A) or Mann-Whitney test (B and C). *P < 0.05; **P < 0.005; ***P < 0.0005; ****P < 0.0001. NS, not significant. n = 4 mice/group (young — influenza and aged — influenza) for B and C.
Figure 10
Figure 10. DNA methylation regulates the age-related prorepair gene signature during recovery from influenza infection.
(A) Schematic of experimental design. (B) Principal component analysis of approximately 70,000 differentially methylated cytosines (DMCs) identified from a generalized linear model and ANOVA-like testing with FDR q value < 0.05. Ellipses represent normal contour lines with 1 standard deviation probability. n = 3 mice/group (young — naive, aged — naive, young — influenza, and aged — influenza). (C) Venn diagram partitioning into differentially expressed genes or DEGs (yellow, 1,813 genes), gene promoters containing DMCs (dark orange, 5,535 genes), and genes that are both DEGs and have gene promoters containing DMCs (light orange intersection, 1,319 genes). Promoters were defined as 1 kb surrounding the transcription start site. A hypergeometric P value is shown. K-means clustering of 1,319 genes with an FDR q value < 0.05. Fold change–fold change plot for young Treg cell response to influenza versus aged Treg cell response to influenza infection highlighting methylation-regulated DEGs. GSEA results showing the top 5 positively enriched gene sets with an FDR q value < 0.25. Genes were ordered by log2(fold change) and ranked by the young Treg cell phenotype. n = 5 mice/group (young — naive, aged — naive, young — influenza, and aged — influenza).

References

    1. Thompson WW, et al. Epidemiology of seasonal influenza: use of surveillance data and statistical models to estimate the burden of disease. J Infect Dis. 2006;194 suppl 2:S82–S91. - PubMed
    1. Liu Y, et al. Association between age and clinical characteristics and outcomes of COVID-19. Eur Respir J. 2020;55(5):2001112. doi: 10.1183/13993003.01112-2020. - DOI - PMC - PubMed
    1. Torres Acosta MA, Singer BD. Pathogenesis of COVID-19-induced ARDS: implications for an aging population. Eur Respir J. 2020;56(3):2002049. doi: 10.1183/13993003.02049-2020. - DOI - PMC - PubMed
    1. Iuliano AD, et al. Estimates of global seasonal influenza-associated respiratory mortality: a modelling study. Lancet. 2018;391(10127):1285–1300. doi: 10.1016/S0140-6736(17)33293-2. - DOI - PMC - PubMed
    1. Matthay MA, et al. Acute respiratory distress syndrome. Nat Rev Dis Primers. 2019;5(1):18. doi: 10.1038/s41572-019-0069-0. - DOI - PMC - PubMed

Publication types

MeSH terms