LncRNAs Landscape in the patients of primary gout by microarray analysis
- PMID: 33600466
- PMCID: PMC7891695
- DOI: 10.1371/journal.pone.0232918
LncRNAs Landscape in the patients of primary gout by microarray analysis
Abstract
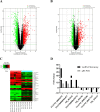
To determine the expression profile and clinical significance of long non-coding RNAs (lncRNAs) in peripheral blood mononuclear cells (PBMCs) of patients with primary gout and healthy control subjects. Human lncRNA microarrays were used to identify the differentially expressed lncRNAs and mRNAs in primary gout patients (n = 6) and healthy control subjects (n = 6). Bioinformatics analyses were performed to predict the roles of differently expressed lncRNAs and mRNAs. Quantitative real-time polymerase chain reaction (qRT-PCR) was performed to detect the expression levels of 8 lnRNAs in 64 primary gout patients and 32 healthy control subjects. Spearman's correlation was used to analyze the correlation between these eight lncRNAs and the laboratory values of gout patients. A receiver operating characteristic (ROC) curve was constructed to evaluate the diagnostic value of the lncRNAs identified in gout. The microarray analysis identified 1479 differentially expressed lncRNAs (879 more highly expressed and 600 more lowly expressed), 862 differentially expressed mRNAs (390 more highly expressed and 472 more lowly expressed) in primary gout (fold change > 2, P < 0.05), respectively. The bioinformatic analysis indicated that the differentially expressed lncRNAs regulated the abnormally expressed mRNAs, which were involved in the pathogenesis of gout through several different pathways. The expression levels of TCONS_00004393 and ENST00000566457 were significantly increased in the acute gout flare group than those in the intercritical gout group or healthy subjects (P<0.01). Moreover, inflammation indicators were positive correlated with TCONS_00004393 and ENST00000566457 expression levels. The areas under the ROC curve of ENST00000566457 and NR-026756 were 0.868 and 0.948, respectively. Our results provide novel insight into the mechanisms of primary gout, and reveal that TCONS_00004393 and ENST00000566457 might be as candidate targets for the treatment of gout flare; ENST00000566457 and NR-026756 could effectively discriminate between the gout and the healthy control groups.
Conflict of interest statement
The authors have declared that no competing interests exist.
Figures


Similar articles
-
Characterization of LncRNA expression profile and identification of novel LncRNA biomarkers to diagnose coronary artery disease.Atherosclerosis. 2018 Aug;275:359-367. doi: 10.1016/j.atherosclerosis.2018.06.866. Epub 2018 Jun 18. Atherosclerosis. 2018. PMID: 30015300
-
Long non-coding RNA expression profile in minor salivary gland of primary Sjögren's syndrome.Arthritis Res Ther. 2016 May 17;18(1):109. doi: 10.1186/s13075-016-1005-2. Arthritis Res Ther. 2016. PMID: 27188286 Free PMC article.
-
Plasma long noncoding RNA expression profile identified by microarray in patients with Crohn's disease.World J Gastroenterol. 2016 May 21;22(19):4716-31. doi: 10.3748/wjg.v22.i19.4716. World J Gastroenterol. 2016. PMID: 27217703 Free PMC article.
-
Identification and bioinformatics analysis of lncRNAs in serum of patients with ankylosing spondylitis.BMC Musculoskelet Disord. 2024 Apr 15;25(1):291. doi: 10.1186/s12891-024-07396-z. BMC Musculoskelet Disord. 2024. PMID: 38622662 Free PMC article. Review.
-
A molecular conundrum involving hypothalamic responses to and roles of long non-coding RNAs following food deprivation.Mol Cell Endocrinol. 2016 Dec 15;438:52-60. doi: 10.1016/j.mce.2016.08.028. Epub 2016 Aug 20. Mol Cell Endocrinol. 2016. PMID: 27555291 Free PMC article. Review.
Cited by
-
Development and Validation of Prognostic Characteristics Associated With Chromatin Remodeling-Related Genes in Ovarian Cancer.Cancer Med. 2025 Feb;14(3):e70634. doi: 10.1002/cam4.70634. Cancer Med. 2025. PMID: 39932052 Free PMC article.
-
Key Genes Associated with Pyroptosis in Gout and Construction of a miRNA-mRNA Regulatory Network.Cells. 2022 Oct 17;11(20):3269. doi: 10.3390/cells11203269. Cells. 2022. PMID: 36291136 Free PMC article.
-
Long noncoding RNA SNHG8 accelerates acute gouty arthritis development by upregulating AP3D1 in mice.Bioengineered. 2021 Dec;12(2):9803-9815. doi: 10.1080/21655979.2021.1995579. Bioengineered. 2021. PMID: 34874227 Free PMC article.
-
JUN and ATF3 in Gout: Ferroptosis-related potential diagnostic biomarkers.Heliyon. 2024 Oct 30;10(22):e39957. doi: 10.1016/j.heliyon.2024.e39957. eCollection 2024 Nov 30. Heliyon. 2024. PMID: 39619595 Free PMC article. Review.
-
Expression Profile of Pyroptosis-Related Genes and the Associated Regulatory Axis in Primary Gout Patients.J Inflamm Res. 2023 Apr 19;16:1711-1725. doi: 10.2147/JIR.S407359. eCollection 2023. J Inflamm Res. 2023. PMID: 37155429 Free PMC article.
References
-
- Miao Z, Li C, Chen Y, Zhao S, Wang Y, Wang Z, et al. Dietary and lifestyle changes associated with high prevalence of hyperuricemia and gout in the Shandong coastal cities of Eastern China. J Rheumatol. 2008;35: 1859–1864. - PubMed
Publication types
MeSH terms
Substances
LinkOut - more resources
Full Text Sources
Other Literature Sources
Medical
Molecular Biology Databases

