. 2021 Mar 1;153(3):e202012707.
doi: 10.1085/jgp.202012707.

A high-throughput fluorescence lifetime-based assay to detect binding of myosin-binding protein C to F-actin

Affiliations

A high-throughput fluorescence lifetime-based assay to detect binding of myosin-binding protein C to F-actin

Thomas A Bunch et al. J Gen Physiol. .

Abstract

Binding properties of actin-binding proteins are typically evaluated by cosedimentation assays. However, this method is time-consuming, involves multiple steps, and has a limited throughput. These shortcomings preclude its use in screening for drugs that modulate actin-binding proteins relevant to human disease. To develop a simple, quantitative, and scalable F-actin-binding assay, we attached fluorescent probes to actin's Cys-374 and assessed changes in fluorescence lifetime upon binding to the N-terminal region (domains C0-C2) of human cardiac myosin-binding protein C (cMyBP-C). The lifetime of all five probes tested decreased upon incubation with cMyBP-C C0-C2, as measured by time-resolved fluorescence (TR-F), with IAEDANS being the most sensitive probe that yielded the smallest errors. The TR-F assay was compared with cosedimentation to evaluate in vitro changes in binding to actin and actin-tropomyosin arising from cMyBP-C mutations associated with hypertrophic cardiomyopathy (HCM) and tropomyosin binding. Lifetime changes of labeled actin with added C0-C2 were consistent with cosedimentation results. The HCM mutation L352P was confirmed to enhance actin binding, whereas PKA phosphorylation reduced binding. The HCM mutation R282W, predicted to disrupt a PKA recognition sequence, led to deficits in C0-C2 phosphorylation and altered binding. Lastly, C0-C2 binding was found to be enhanced by tropomyosin and binding capacity to be altered by mutations in a tropomyosin-binding region. These findings suggest that the TR-F assay is suitable for rapidly and accurately determining quantitative binding and for screening physiological conditions and compounds that affect cMyBP-C binding to F-actin for therapeutic discovery.


Figures

Figure 1.
Figure 1.
TR-F binding assays for actin and actin–Tm compared with cosedimentation. Unphosphorylated C0–C2 (solid lines) and phosphorylated C0–C2 (dotted lines) were assayed. (A) TR-F using IAEDANS–actin (thin lines). (B) TR-F using IAEDANS–actin–Tm (thick lines). (C) TR-F using IAEDANS–actin and IAEDANS–actin–Tm showing 0–5 µM C0–C2 added. (D) Cosedimentation using actin. (E) Cosedimentation using actin–Tm. (F) Cosedimentation using IAEDANS–actin and IAEDANS–actin–Tm showing 0–5 µM C0–C2 added. Arrows in A–F indicate the C0–C2 concentrations to be used in future screens (thin arrows, 2.5 µM for actin alone; thick arrows, 1.25 µM for actin–Tm). (G) Linear correlation plot of unphosphorylated C0–C2 binding measured by TR-F (change in lifetime) and cosedimentation ([bound C0–C2]/[actin]) for actin (R2 = 0.96) with each assay readout normalized to 1 (at 20 µM C0–C2). (H) Linear correlation plot in the presence of Tm, under conditions of G, for unphosphorylated C0–C2 binding to actin–Tm (R2 = 0.87). Refer to Table 1 for statistical analysis of fitted binding properties for curves. Data are provided as mean ± SE (n > 4).
Figure 2.
Figure 2.
Example of Z score calculation for TR-F of IAEDANS-labeled F-actin binding to unphosphorylated and phosphorylated C0–C2. (A) Fluorescence waveform of IAEDANS-labeled F-actin (blue line) and the same together with 20 µM C0–C2 (black line; both normalized to their maximum intensity values) and the instrument response function (IRF; gray line). Red box (inset) highlights Relative Fluorescence Intensity ∼1/e magnified to show difference in TR-F lifetimes of actin and actin + C0–C2. This is expanded further in B. (B) Magnified view of lifetime differences from red box in A. The actual lifetimes (∼17.5 ns, shown in C–E) are the times shown on the x axis to reach 1/e of the peak intensity (∼22.5 ns) minus the time to reach peak intensity (∼5 ns in the convoluted fluorescence waveform; see peak in A). (C) Lifetimes measured in a 384-well plate containing 60 wells each of 1 µM IAEDANS–actin alone (blue), actin plus 2.5 µM C0–C2 (black), or actin plus 2.5 µM PKA-treated C0–C2 (red). (D) Comparing actin alone to actin plus C0–C2. (E) Comparing actin plus C0–C2 versus actin plus PKA-treated C0–C2. For D and E, horizontal solid lines indicate 3× SD of the mean lifetime (dotted line). Z′ score is defined as the difference between 3× SD (a) divided by the difference in the mean signal (b) in D and E. While comparisons made in D and E, having no overlap at 3× SD, are clearly significantly different, note that even the difference between actin alone and actin bound to phosphorylated C0–C2 (blue versus red in C) is also significant (P < 0.0001).
Figure 3.
Figure 3.
cMyBPC organization and C0–C2 mutants tested. (A) Full-length cMyBP-C domains C0–C10. Ig-like domains shown as circles and Fn3-like domains as hexagons. (B) C0–C2 domains containing P/A linker and phosphorylatable M-domain are shown. Sequence of M-domain and locations of HCM mutations tested for binding. PKA phosphorylatable Ser residues are in green, PKA recognition sequences are indicated with underlines, and HCM mutation sites are in red. Helix residues in the tri-helix bundle are indicated with thick underlines. Structure insets: tri-helix bundle (Michie et al., 2016; PDB accession no. 5K6P) containing L352P and E334K mutations and C1 (Risi et al., 2018; PDBaccession no. 6CXI) showing the RASK loop between adjacent β-strands that interacts with Tm. (C) C0–C1 is a deletion of the M-domain and C2.
Figure 4.
Figure 4.
TR-F binding curves of WT C0–C2, L352P, E334K, and C0–C1 on IAEDANS–actin. TR-F of IAEDANS–actin binding to 0–20 µM C0–C2 and C0–C1. Data are provided as mean ± SE (n > 4).
Figure 5.
Figure 5.
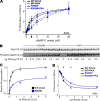
Effects of WT and R282W HCM mutant on phosphorylation-modulated binding to actin at submaximal phosphorylation by PKA. (A) TR-F of IAEDANS–actin incubated with increasing concentrations of C0–C2 (WT, black; R282W, blue) either unphosphorylated (solid lines) or phosphorylated using 7.5 ng PKA/µg C0–C2 (dashed lines). For B–D, effects of HCM mutant R282W on C0–C2 phosphorylation were tested over a range of PKA levels (0–5 ng PKA/µg C0–C2). (B) SYPRO Ruby (total protein; top bands) and Pro-Q Diamond (phosphorylated protein; bottom bands) stains of SDS-PAGE. (C) Relative phosphorylation levels of WT and R282W (normalized to the ratio of the Pro-Q Diamond/SYPRO Ruby intensities for WT C0–C2 at 5 ng PKA/µg C0–C2). Phosphorylation levels of R2828W are significantly different (P < 0.00006) from WT for all concentrations of PKA. (D) WT and R282W effects on IAEDANS–actin lifetime change as a function of PKA concentration. At intermediate phosphorylation levels (0.5 and 1.5 ng PKA/µM C0–C2), binding to actin detected by TR-F is significantly different between WT and R282W (*, P < 0.003). Average data are provided as mean ± SE (n > 4).
Figure 6.
Figure 6.
Effects of WT and Tm-binding mutants on binding to actin–Tm and actin. Effects of WT and Tm-binding mutants on actin–Tm (thick lines) and actin (thin lines) TR-F were tested. Tm-binding mutants reverse charges (EASE; R215E/K218E) or introduce additional positive charges (RRKK; A216R/S217K) in the Tm-binding loop 215–218, RASK, of C0–C2. (A) WT and R215E/K218E (EASE in red) effects on IAEDANS-actin–Tm and IAEDANS-actin for C0–C2 from 0 to 20 µM. (B) Zooming in on the lower concentrations (0–5 µM) C0–C2 added in A. (C and D) The same conditions as A and B above but comparing WT and A216R/S217K (RRKK in green). For the Tm-binding mutant (charge reversal-EASE), apparent Kd changes trended toward significant (P = 0.11) for actin–Tm, but not for actin alone. For the positive Tm-binding mutant (additional positive charges-RRKK), apparent Kd changes were significant (P < 0.05) for binding to both actin and actin–Tm. Refer to Table S1 for statistical analysis of fitted binding properties for curves and Table 2 for comparisons of binding at specific C0–C2 concentrations. Data are provided as mean ± SE (n > 4).
Figure S1.
Figure S1.
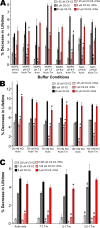
Lifetime changes of five fluorescent dyes attached to actin at Cys-374 upon binding to C0–C2. Either 1 or 5 µM of fluorescently labeled actin was mixed with 0, 5, or 20 µM unlabeled C0–C2. White bars indicate actin alone, gray/black bars indicate unphosphorylated C0–C2, and pink/red bars indicate phosphorylated C0–C2. (A) Fluorescence lifetime. (B) Relative reduction (% decrease) in lifetime compared with actin alone (see Materials and methods). Note that the actin alone (white bars) in B display only error bars, as the percent decrease in lifetime for actin alone relative to itself is 0. Significant differences were observed (P < 0.000002) for all probes comparing actin alone to actin plus C0–C2 (white bars versus gray, and white bars versus black) with two exceptions that trend to, but do not reach, significance in A or B: 1 µM IANBD-actin with 5 µM C0–C2 (P = 0.06) and 5 µM IANBD-actin with 5 µM C0–C2 (P = 0.16). For comparison of unphosphorylated versus phosphorylated C0–C2 (gray versus pink and black versus red), P < 0.05 for all probes and C0–C2 concentrations with four exceptions in A or B: 1 µM IANBD–actin 5 µM C0–C2 P = 0.86, 5 µM IANBD–actin 5 and 20 µM C0–C2 P = 0.94 and 0.40, and 5 µM IAEDANS–actin 20 µM C0–C2 P = 0.24. Data are provided as mean ± SE (n > 4).
Figure S2.
Figure S2.
Buffer conditions optimization of the TR-F assay for C0–C2 binding to IAEDANSactin and IAEDANSactinTm. Reduction in lifetimes (% decrease) for either 1 µM IAEDANS-labeled actin or actin–Tm binding to the indicated concentrations of C0–C2 that was not phosphorylated (gray and black) or phosphorylated by PKA (+PKA, pink and red). Note the first bar left of the six colored bars in each group shows 0% decrease in lifetime with baseline error bars for actin, or actin–Tm, alone (i.e., 0% decrease relative to itself). (A) Binding buffers at varying pH and either 100 mM KCl or NaCl. (B) Three concentrations of KCl in binding buffer. (C) Different ratios of actin/Tm. In C, for unphosphorylated C0–C2, significant differences comparing actin alone to actin/Tm are indicated ($,P < 0.05). In A–C, significant differences between minus and plus PKA are indicated (*, P < 0.05; #, P < 0.005). Data are provided as mean ± SE (n > 4).
Figure S3.
Figure S3.
Actin/Tm ratios. (A) Relative staining intensity of actin and Tm in SDS-PAGE gels stained with Coomassie blue was determined. 1 µg actin from two separate preps (lanes 1–6) and 1 µg Tm (lanes 7–9) were compared as were 0.2 µg actin (lanes 10–15) and 0.2 µg Tm (lanes 16–18). The concentrations of actin and Tm were determined using their extinction coefficients. For actin, absorbance at 290 nm 0.1% (1 g/liter) was 0.63. For Tm absorbance at 280 nm 0.1% (1 g/liter) was 0.274. The average actin/Tm staining intensity ratio was 1.55. (B) Mixtures of 3.5:1 actin/Tm were made (total, first six lanes). Following centrifugation (TLA 100 rotor, 100,000 rpm, 30 min, 4°C) actin and bound (cosedimenting) Tm in the pellet were examined (pellet, lanes 7–12). Supernatant (unbound Tm) was also examined (supernatant, lanes 13–18). The relative intensities of the actin and Tm bands was 3:1 for the Total and 7.5:1 for the Pellet following correction for staining differences determined in A and differences in molecular weights (actin, 42,000 D; Tm dimer, 65,300 D). Total and Supernatant can be directly compared as the same volume was examined for each. 40% of the input Tm remained unbound indicating that there was excess Tm in the mixture. All of the actin was found in the pellet.
Figure S4.
Figure S4.
TR-F IAEDANS-actin–Tm and IAEDANS-actin-binding curves for C0–C2 mutants. TR-F measurements of the effects of mutant C0–C2 on the reduction (percent decrease) in lifetimes are plotted for increasing concentration without (solid red lines) and with PKA treatment (dotted red lines). For comparison, curves for WT C0–C2 are included in each graph (black lines). (A) C0–C1/actin–Tm. (B) C0–C1/actin. (C) L352P/actin–Tm. (D) L352P/actin. (E) E334K/actin–Tm. (F) E334K/actin. (G) R282W/actin–Tm. (H) R282W/actin. Arrows indicate the C0–C2 concentrations to be used in future screens (thick arrows, 1.25 µM for actin–Tm in A, C, E, and G; thin arrows, 2.5 µM for actin alone in B, D, F, and H). Data are provided as mean ± SE (n > 4).
Figure S5.
Figure S5.
Effects of R282W HCM mutant on phosphorylation-modulated binding to actin–Tm at submaximal phosphorylation by PKA. Effects of HCM mutant R282W on C0–C2 phosphorylation were tested over a range (0–5 ng PKA/µg C0–C2) of PKA levels. WT and R282W effects on IAEDANS–actin–Tm lifetime change (percent decrease) as a function of PKA concentration. At intermediate phosphorylation levels (0.5 and 1.5 ng PKA/µM C0–C2), binding to actin or actin–Tm detected by TR-F is significantly increased in R282W (*, P < 0.003). Data are provided as mean ± SE (n > 4).
Figure S6.
Figure S6.
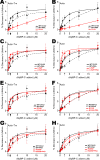
Effects of Tm-binding mutants on phosphorylation-dependent binding to actin–Tm and actin. Effects of Tm-binding mutants C0–C2 on actin–Tm and actin TR-F were tested with and without PKA treatment. Tm-binding mutants reverse charges (EASE; R215E/K218E) or introduce additional positive charges (RRKK; A216R/S217K) in the Tm-binding loop 215–218, RASK, of C0–C2. For comparison, curves for WT C0–C2 are included in each graph. (A) WT (black lines) and R215E/K218E (EASE in red) effects on IAEDANS–actin–Tm for unphosphorylated (solid lines) and phosphorylated (+PKA, dotted lines) C0–C2 from 0 to 20 µM cMyBP-C added. (B) Same conditions as A, except that IAEDANS–actin was used. (C and D) Zooming in on the lower concentrations (0 to 5 µM) cMyBP-C added in A and B. (E–H) The same conditions as A–D above but comparing WT (black lines) and A216R/S217K (RRKK in green). For the unphosphorylated Tm-binding mutant (charge reversal-EASE), apparent Kd changes trended toward significant (P = 0.11) for actin–Tm, but not for actin alone. The phosphorylated mutant did not fit well to a quadratic binding equation for either actin or actin–Tm (but did fit to a linear equation). For the unphosphorylated positive Tm-binding mutant (additional positive charges, RRKK) apparent Kd changes were significant (P < 0.05) for binding to both actin and actin–Tm. For phosphorylated RRKK binding, changes in Kd did not reach significance. Refer to Table S1 for statistical analysis of fitted binding properties for curves. See Table S2 for comparisons of binding at specific substoichiometric C0–C2 concentrations discussed in supplemental Results. Arrows in indicate the C0–C2 concentrations to be used in future screens (thick arrows, 1.25 µM for actin–Tm in A, C, E, and G; thin arrows, 2.5 µM for actin alone in B, D, F, and H). Data are provided as mean ± SE (n > 4).
Figure S7.
Figure S7.
Cosedimentation assays for C0C1 binding to actin–Tm and actin. C0–C1 (red lines) was assayed and unphosphorylated C0–C2 (solid lines), and phosphorylated C0–C2 (dotted lines) are shown for reference. (A) Cosedimentation using actin–Tm. (B) Cosedimentation using actin. Cosedimentation using actin–Tm or actin was also measured at 40 µM C0–C1, and this was used for determination of Kd and Bmax for C0–C1 curves (Table S1). Data are provided as mean ± SE (n > 4).
Figure S8.
Figure S8.
Comparison of TR-F and cosedimentation actin-binding assays for C0–C2 mutants. Unphosphorylated and phosphorylated WT and five mutants of C0–C2 were assayed using IAEDANS–actin or IAEDANS–actin–Tm. (A) TR-F using 1.25 µM C0–C2. (B) Cosedimentation using 1.25 µM C0–C2. (C) TR-F using 10 µM C0–C2. (D) Cosedimentation using 10 µM C0–C2. *, P < 0.05 for comparisons with WT under the same conditions at substoichiometric binding levels (1.25 µM C0–C2, A and B). In A and B, reduction in binding due to phosphorylation was significant (P < 0.005) in all cases with the exception of EASE C0–C2 binding to actin–Tm measured by TR-F. Data are provided as mean ± SE (n > 4).

References

    1. Bahrudin, U., Morisaki H., Morisaki T., Ninomiya H., Higaki K., Nanba E., Igawa O., Takashima S., Mizuta E., Miake J., et al. . 2008. Ubiquitin-proteasome system impairment caused by a missense cardiac myosin-binding protein C mutation and associated with cardiac dysfunction in hypertrophic cardiomyopathy. J. Mol. Biol. 384:896–907. 10.1016/j.jmb.2008.09.070 - DOI - PubMed
    1. Beausoleil, S.A., Villén J., Gerber S.A., Rush J., and Gygi S.P.. 2006. A probability-based approach for high-throughput protein phosphorylation analysis and site localization. Nat. Biotechnol. 24:1285–1292. 10.1038/nbt1240 - DOI - PubMed
    1. Bezold, K.L., Shaffer J.F., Khosa J.K., Hoye E.R., and Harris S.P.. 2013. A gain-of-function mutation in the M-domain of cardiac myosin-binding protein-C increases binding to actin. J. Biol. Chem. 288:21496–21505. 10.1074/jbc.M113.474346 - DOI - PMC - PubMed
    1. Bunch, T.A., Lepak V.C., Kanassatega R.S., and Colson B.A.. 2018. N-terminal extension in cardiac myosin-binding protein C regulates myofilament binding. J. Mol. Cell. Cardiol. 125:140–148. 10.1016/j.yjmcc.2018.10.009 - DOI - PMC - PubMed
    1. Bunch, T.A., Kanassatega R.S., Lepak V.C., and Colson B.A.. 2019. Human cardiac myosin-binding protein C restricts actin structural dynamics in a cooperative and phosphorylation-sensitive manner. J. Biol. Chem. 294:16228–16240. 10.1074/jbc.RA119.009543 - DOI - PMC - PubMed

Publication types