. 2021 Feb 26;41(2):BSR20203827.
doi: 10.1042/BSR20203827.

Effects of storage time and temperature on highly multiparametric flow analysis of peripheral blood samples; implications for clinical trial samples

Affiliations

Effects of storage time and temperature on highly multiparametric flow analysis of peripheral blood samples; implications for clinical trial samples

Amelia Jerram et al. Biosci Rep. .

Abstract

We sought to determine the effect of time and temperature of blood sample storage before preparation of human peripheral blood mononuclear cells (PBMCs) by Ficoll-hypaque density gradient centrifugation. Blood samples from healthy donors were stored at room temperature (RT) or refrigerated at 4°C before preparation of PBMCs. Cell yield and viability, and proportions of major cell populations within PBMCs, as determined by fluorescence flow cytometry, were assessed for both fresh and cryopreserved samples. Highly multiparametric mass cytometry was performed on cryopreserved PBMCs. We found that refrigeration had marked negative effects on subsequent PBMC yield. Storage at RT led to co-purification of low density neutrophils with PBMCs, but had no detectable effects on the proportions of multiple cell subsets including, but not limited to, monocytes, NK cells, B cells, Treg cells, and naïve, central memory and effector memory CD4+ and CD8+ T cells and CD45RA-positive terminal effector CD8+ T cells. Expression of a number of cell surface receptors, including CXCR5, CCR6, CXCR3 and TIGIT, but not CD247 was reduced after RT storage before PBMC preparation, and this effect correlated with the degree of low density neutrophil contamination. As such, when PBMC preparation cannot be undertaken immediately after blood draw, storage at RT is far superior to refrigeration. RT storage leads to neutrophil activation, but does not compromise measurement of PBMC subset distribution. However caution must be applied to interpretation of cytometric measurements of surface molecules such as chemokine receptors.

Keywords: Blood processing; cytometry; immunophenotyping; neutrophil.


Conflict of interest statement

The authors declare that there are no competing interests associated with the manuscript.

Figures
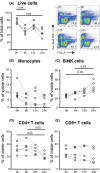
Figure 1
Figure 1. Effect of refrigerated storage of blood prior to PBMC processing
A total of 4 × 5 ml EDTA blood tubes were collected from each of five donors. Tubes were processed immediately or refrigerated for 6, 12 or 24 h before processing. All PBMCs were cryopreserved and subsequently thawed and assessed by fluorescence flow cytometry for FSC and SSC to distinguish monocytes and lymphocytes, and expression of CD3, CD4 and CD14. (A) Viability was determined using NIR viability dye, with representative dot plots showing changes in forward scatter vs viability over time. Within viable cells, (B) monocytes were gated as CD4loCD14+ and their identity confirmed by FSC/SSC, (C) B and NK cells were gated collectively as CD3-negative lymphocytes, (D) CD4+ T cells were gated as CD3+CD4+ and (E) CD8+ T cells were identified in this limited panel as CD3+CD4. Data were analysed with a one-way repeated measures ANOVA with post-hoc Tukey’s tests and P values indicating significant differences between the timepoints are shown.
Figure 2
Figure 2. Effect of time and temperature prior to PBMC processing on recovery of total WBCs and lymphocytes
A total of 5 × 7 ml heparin blood tubes were collected from each of seven donors, and 2 × 7 ml heparin blood tubes from an additional donor. Individual tubes were either processed immediately or kept at RT or 4°C for 6 or 24 h. PBMCs and an aliquot of whole blood were analysed using a Sysmex XP-300™ Automated Hematology Analyzer. These full blood counts were analysed using a one-way mixed effects ANOVA with post-hoc Tukey’s tests. A small drop in WBC was seen with RT storage (5% at 6 h, 11% at 24 h, P=0.04) and a larger drop at 4°C (12% at 6 h P=0.003, 25% at 24 h P=0.002). For the additional donor, only the 0 and 24 h RT analyses were performed. Cell recovery of (A) WBC and (B) lymphocytes was calculated as a percentage of the cell number loaded on to the Ficoll-hypaque gradient. Missing values for lymphocytes are due to the inability of the Sysmex to resolve a distinct lymphocyte peak. Data were analysed using a one-way mixed effects ANOVA with post-hoc Tukey’s tests and P values indicating significant differences between the timepoints are shown. For the 4°C analysis, a 24-h lymphocyte count was obtained for only a single sample, so the 0- and 6-h timepoints were analysed using a paired values t test.
Figure 3
Figure 3. Effect of blood storage at RT on the number of neutrophils in PBMCs
A total of 3 × 5 ml heparin blood tubes were collected from each of five donors, and individual tubes were either processed immediately or kept at RT for 6 or 24 h. Whole blood and PBMCs were analysed by fluorescence flow cytometry, using a cocktail of antibodies to CD3, CD4, CD8, CD56, CD14 and CD16. Dead cells were excluded with NIR viability dye. The percentage of neutrophils, identified by side scatter and expression of CD16, within live cells was calculated for (A) whole blood and (B) PBMCs. Each donor is indicated by a different colour. Data were analysed with a one-way repeated measures ANOVA with post-hoc Tukey’s tests and P values indicating significant differences between the timepoints are shown. (CE) Aliquots of PBMCs were cytospun, stained with modified Giemsa and photographed. Green arrows indicate neutrophils with typical mature nuclear morphology in the 6 and 24 h samples.
Figure 4
Figure 4. Effect of blood storage at RT on major cell subsets within PBMCs, assessed using fluorescence flow cytometry
Data from the experiment described in Figure 3 were analysed to determine the percentage of major cell subsets, expressed as a proportion of non-neutrophil WBCs to account for the effect of low density neutrophil contamination in the 6 and 24 h samples. (A) Total CD3+ T cells, (B) CD56+ NK cells, (C) monocytes, gated for side scatter and CD14 expression, (D) CD19+ B cells, (E) CD4+ T cells and (F) CD8+ T cells. One-way repeated measures ANOVA revealed no significant differences between the timepoints for any of the cell subsets.
Figure 5
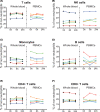
Figure 5. Effect of blood storage at RT on cell subsets within PBMCs, assessed using mass cytometry
Cryopreserved PBMCs from the experiment described in Figure 3, plus an additional three donors, were thawed in two batches and analysed using mass cytometry. For each donor, the 0, 6 and 24 h samples were barcoded before staining in a single tube to ensure equivalence of staining conditions across timepoints. Data were gated for the populations indicated. Results for (A) neutrophils are expressed as proportion of total cells, while results for the other cell populations (B–O) are expressed as proportion of total non-neutrophil cells. Treg cells were gated as CD25+CD127lo CD4+ T cells. Additional T cell subsets were gated for expression of CD45RA, CD45RO and CCR7 into naïve (CD45RA+CD45ROCCR7+), TCM (CD45RACD45RO+CCR7+), TEM (CD45RACD45RO+CCR7) and TEMRA (CD45RA+CD45ROCCR7) subsets. Each colour represents an individual donor. One-way repeated measures ANOVA revealed no significant differences between the timepoints for any of the cell subsets, apart from neutrophils. (P) Representative tSNE dimensionality reduction of non-neutrophils across time points for a donor with increasing neutrophil contamination over time (donor 3, represented in dark green in (A–O)). Dots represent individual cells and are coloured by populations in (B–O).
Figure 6
Figure 6. Effect of blood storage at RT on expression of cell surface proteins within PBMCs, assessed using mass cytometry
Data from the experiment described in Figure 5 were analysed to determine the effect of RT blood storage on expression of cell surface proteins detected by metal-labelled antibodies. No proteins increased expression at 6 or 24 h. Proteins whose expression decreased significantly over time, as assessed by MSI, are illustrated in (AE). Calculation of MSI for mass cytometry data is useful only when at least 50% of any cell population have detectable signals in that channel. For this reason, cell subsets with relatively high expression of the indicated proteins are shown. For (A–C) CXCR5, CCR6 and TIGIT, expression on all cell subsets was reduced, while for CXCR3, there was a disparity between (D) B cells, (E) CD8+ T cells and (F) monocytes. Data were analysed with a one-way repeated measures ANOVA with post-hoc Tukey’s tests and P values indicating significant differences between the timepoints are shown. (G–I) Expression of CD247 showed no significant change. Donors are identified by the same colours as in Figure 5.
Figure 7
Figure 7. Correlation between number of low density neutrophils and reduction in expression of CXCR5 and CCR6
The data shown in Figure 6 were analysed as a function of the percentage of low density neutrophils within PBMCs. (A,B) MSIs for CXCR5 and CCR6 expression by B cells in PBMCs prepared after 6 or 24 h at RT storage were expressed as a percentage of values for 0 h samples and graphed against the percentage of low density neutrophils within PBMCs. Donors are identified by the same colours as in Figures 5 and 6. (C,D) Linear regression analysis of the correlation between increasing neutrophils and decreasing CXCR5 and CCR6.

References

    1. Topalian S.L., Drake C.G. and Pardoll D.M. (2015) Immune checkpoint blockade: a common denominator approach to cancer therapy. Cancer Cell 27, 450–461 10.1016/j.ccell.2015.03.001 - DOI - PMC - PubMed
    1. Krieg C., Nowicka M., Guglietta S., Schindler S., Hartmann F.J., Weber L.M.et al. . (2018) High-dimensional single-cell analysis predicts response to anti-PD-1 immunotherapy. Nat. Med. 24, 144–153 10.1038/nm.4466 - DOI - PubMed
    1. Pirozyan M.R., McGuire H.M., Emran A.A., Tseng H.Y., Tiffen J.C., Lee J.H.et al. . (2020) Pretreatment innate cell populations and CD4 T cells in blood are associated with response to immune checkpoint blockade in melanoma patients. Front. Immunol. 11, 372 10.3389/fimmu.2020.00372 - DOI - PMC - PubMed
    1. Fuss I.J., Kanof M.E., Smith P.D. and Zola H. (2009) Isolation of whole mononuclear cells from peripheral blood and cord blood. Curr Protoc. Immunol. Chapter 7, Unit 7.1 10.1002/0471142735.im0701s85 - DOI - PubMed
    1. Ashmore L.M., Shopp G.M. and Edwards B.S. (1989) Lymphocyte subset analysis by flow cytometry. Comparison of three different staining techniques and effects of blood storage. J. Immunol. Methods 118, 209–215 10.1016/0022-1759(89)90008-2 - DOI - PubMed

Publication types

Substances